A comparative study between mathematical models and the ANN
data mining technique in draft force prediction of disk plow
implement in clay loam soil
Seyed Mojtaba Shafaei, Mohammad Loghavi,
Saadat Kamgar
* (Department of Biosystems Engineering, School of Agriculture, Shiraz University, Shiraz 71441-65186, Iran)Abstract: This paper communicates prediction of required draft force of disk plow implement during tillage operations. The well-known mathematical model proposed by American Society of Agricultural and Biological Engineers (ASABE), multiple linear regression (MLR), and data mining model, based on artificial neural network (ANN), were employed for this purpose. Input variables of the models were considered as forward speed of 2-6 km·h-1 and plowing depth of 10-30 cm. Development
details of the models have been documented in the paper. On account of statistical performance criteria, the best ANN model with coefficient of determination of 0.971, root mean square error of 0.762 kN, mean absolute percentage error of 1.886% and mean value of absolute prediction residual errors of 0.968 kN was better performed than the ASABE and MLR models for prediction of required draft force. The ANN modeling results also showed that simultaneous or individual increment of forward speed and plowing depth caused nonlinear increment of draft force. The well-developed ANN model should be considered operational to predict draft force as an essential step towards proper selection of combination of tractor and disk plow implement.
Keywords: plowing depth, forward speed, tillage operations, artificial neural network, tractor power
Citation: Shafaei, S. M., M. Loghavi, and S. Kamgar. 2018. A comparative study between mathematical models and the ANN data mining technique in draft force prediction of disk plow implement in clay loam soil. Agricultural Engineering International: CIGR Journal, 20(2): 71–79.
1 Introduction
Horizontal component of force generated by tractor to pull tillage implement within soil is known as draft force. Draft force of implement is a major factor in matching of tractor with implement in different tillage operations. Determination of proper size and power of tractor required to perform tillage operations with specific implement is obtained based on draft force data (Kumar et al., 2016). Hence, availability of draft force data for a specific tillage implement in particular farm situation is vital in this realm.
Magnitude of draft force is influenced by operational
Received date: 2017-06-21 Accepted date: 2018-03-23 *Corresponding author: Kamgar, Saadat, Ph.D., Assistant Professor, Department of Biosystems Engineering, School of Agriculture, Shiraz University, Shiraz, Iran 71441-65186. Tel: 98 07132287114. Fax: 98 07132286104. Email: [email protected].
variables such as soil conditions, forward speed, plowing depth, and implement geometry (Kepner et al., 2005). Determination of draft force data under wide range of field conditions is a time consuming and costly job. Therefore, investigators preferred to find relationship between draft force and operational variables, using available modeling techniques, in order to extend discrete experimental results towards integral applicable results with limited trials.
In this context, a mathematical model suggested by American Society of Agricultural and Biological Engineers (ASABE) is a well-known model which is initially used by researchers to predict draft force of implements in tillage operations. The model performs based on parameters of soil, forward speed, machine/implement width, and plowing depth (ASABE, 2015).
tillage implements were predicted well by the ASABE model in various types of soil over the past years (Ismail and Burkhardt, 1993; Harrigan and Rotz, 1995; Askari and Khalifahamzehghasem, 2013; Ranjbarian et al., 2017). Due to inadequate ability of the ASABE model in prediction of draft force of some implements in particular soils, previous authors intended to focus their studies on multiple linear regression (MLR) modeling of draft force (Harrison and Reed, 1962; Mamman and Oni, 2005; Al-Suhaibani et al., 2015). They found that the MLR model performed better than the ASABE model to predict draft force of desired tillage implement in target soil. Some available published documents revealed that draft force changed nonlinearly as affected by forward speed and plowing depth in a specific tillage system. Therefore, the MLR model could not successfully predict draft force in these conditions. Thus, other modeling techniques with ability of nonlinear mapping between multiple input and output parameters were examined by researchers to achieve better results in comparison with mathematical modeling techniques.
One of well-known nonlinear models performed based on data mining technique is artificial neural network (ANN). The ANN was originally established based on structure of biological neural system. The ANN models are adaptable intelligent systems capable of finding nonlinear relationships between input and output data sets. A trained ANN based on available observation data can be applied in the same situations for future works. This outstanding feature leads to employment of the ANN model in many fields of agricultural studies in recent years. Details of development aspects of the ANN modeling technique can be found in the literature (Taghavifar and Mardani, 2014a; Taghavifar and Mardani, 2014b; Shafaei et al., 2015; Taghavifar and Mardani, 2017; Shafaei et al., 2018a; Shafaei et al., 2018b). A probe into some published papers showed applications of the ANN in prediction of implement draft force based on field conditions (Aboukarima and Saad, 2006; Aboukarima, 2007; Alimardani et al., 2009). Furthermore, previous attempts indicated that the ANN model was proposed to predict draft force of tillage tools in controlled soil bin facility (Choi et al., 2000; Roul et al., 2009; Akbarnia et al., 2014).
In south regions of Iran, disk plowing is commonly performed by farmers as primary tillage operations in clay loam soils. In general, there have been no published results about draft force prediction of disk plow implement in clay loam soil on the basis of concurrent changes of plowing depth and forward speed. Therefore, current study was conducted to assess predictive ability of the ASABE, MLR, and ANN models for direct prediction of draft force of disk plow implement in clay loam soil. The best model with the highest predictive ability presented in the study results would be served in agricultural machinery managements to optimize matching situations of disk plow implement with available tractors in the country.
2 Materials and methods
2.1 Tillage site
An experimental farmland with clay loam soil texture (35% sand, 30% silt and 35% clay) and flat topography located at Bajgah Agricultural Research Station of Shiraz University (North West of Shiraz city, Iran) was used to carry out the research. A sampled container of farmland soil was collected and dried in a convection oven at 105± 1°C to reach the constant weight. Moisture content of the sampled soil was then determined as mass reduction during drying procedure divided by dry mass of the soil based on Equation (1) (SAA, 1977).
100
w d
d
W W
MC W
−
= × (1)
Where, Ww is mass of initial soil (g); Wd is mass of dried
soil, and MC is moisture content of the sampled soil
(d.b%). To eliminate measurement error, the tests were completed in triplicate for 30 cm topsoil layer and mean value was used. The moisture content of farmland soil was found to be 8.84 d.b%. To perform the tests, total of 27 farm plots with specific determined size (30 m × 15 m) were selected in the farmland.
2.2 Tractor and disk plow implement
board with data collection rate of 10 Hz was mounted on the tractor. Engineering aspects, and theoretical and experimental considerations of the system design are reported by Karparvarfard and Rahmanian-Koushkaki (2015), and Shafaei et al. (2018c). The simple method for draft force measurement of implement during tillage operations officially proposed by Regional Network for Agricultural Machinery (RNAM) (RNAM, 1995) was generally considered in the study.
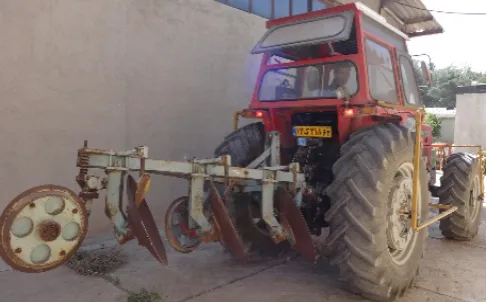
A 120 cm wide mounted-type disk plow implement (model: TAKA 165, manufactured by TAKA, Iran) consisted of three disk bottoms mounted on a toolbar and equipped with a gauge wheel was used for the field trials. Prior to the trials, to minimize parasitic forces on the implement attached to the tractor, it was leveled using top and lift links of the tractor. Initial checkout of the tractor and the implement was also performed at base station (Figure 1).
Figure 1 The disk plow implement attached to the tractor at base station
2.3 Field trials
All field trials were carried out with three replications on a half day on Jun 5, 2016. In the field, before each test plot, a practice area was considered to achieve desired levels of plowing depth and forward speed. Desired plowing depths were practically gained through adjustment of three-point linkage height of the tractor. To obtain desired forward speeds, combination of tractor gears was used while the tractor in 2WD mode was travelling in a practice area. Three experimental levels of plowing depth (10, 20 and 30 cm) and forward speed (2, 4 and 6 km h-1) were examined. Required draft force of the disk plow implement for each combination of plowing depth and forward speed was accurately measured and
recorded by the digital instrumentation system. According to the RNAM method, the unpowered tractor-implement was pulled by an auxiliary tractor (model: 4450, manufactured by John Deere, USA) while, the load cell transducer of the digital instrumentation system was horizontally located between two tractors. Schematic of the method is graphically given by Rahmanian-Koushkaki et al. (2015). The experiments were conducted with the implement at desired plowing depths and forward speeds. Obtained force data was recorded as gross traction forces. The experiments were also repeated at desired forward speed and raised position of the implement. The recorded force data was considered as rolling resistance force of the tractor wheels. Subsequently, required draft force of the disk plow implement was computationally obtained by means of the following Equation (2).
DF=H–R (2)
Where, DF is draft force (kN); H is gross traction force
(kN), and R is rolling resistance force (kN). 2.4 Statistical descriptions
To determine draft force changes as affected by forward speed and plowing depth, obtained draft force data for the disk plow implement was statistically analyzed by applying some statistical parameters (mean, standard deviation, coefficient of variation, and coefficient of non-uniformity). The following equations describe formulation of the statistical parameters (Shafaei and Kamgar, 2017).
1
1 i N i i
M DF
N =
=
=
∑
(3)1/2
1
1
( )
i N i i
SD DF M
N =
=
⎡ ⎤
= ⎢ − ⎥
⎣
∑
⎦ (4)100
SD CV
M
⎛ ⎞
=⎜ ⎟×
⎝ ⎠ (5)
max min 100
DF DF
CNU
M −
⎛ ⎞
=⎜ ⎟×
⎝ ⎠ (6)
Where, M is draft force mean, N is number of used data; DFi is ith sampled draft force (kN); SD is standard
deviation (kN); CV is coefficient of variation (%); CNU is
coefficient of non-uniformity (%); DFmax is maximum of
draft force (kN), and DFmin is minimum of draft force
2.5 Development of the models
2.5.1 Mathematical models
The ASABE and MLR models (Equations (7) and (8), respectively) were developed to predict required draft force of the disk plow implement during tillage operations. The values of experimental forward speed and plowing depth in accordance with specific soil and the implement parameters were fed to the model and corresponding draft force values for each combination of forward speed and plowing depth were obtained. The specific soil and implement parameters were extracted from the ASABE standard (ASABE, 2015).
2
[ ( ) ( ) ]
i
DF=F A+B FS +C FS W×PD (7)
0 1
i n i i i
DF a a x
=
=
= +
∑
(8)Where, Fi is a dimensionless soil texture adjustment
parameter; A, B and C are machine-specific parameters;
FS is forward speed (km.h-1); W is machine width (m);
PD is plowing depth (cm); a0 is the MLR model constant;
xi is the ith MLR model variable, ai is the ith MLR model
coefficient, and n is number of variables. In this study, the MLR model was developed on the basis of two variables (forward speed and plowing depth).
2.5.2 ANN model
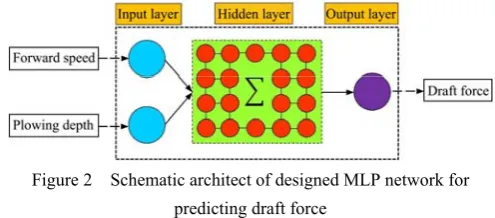
A classic ANN architect (multi-layer perceptron (MLP) network) with three layers of neuron (an input layer, one hidden layer, and output layer) was designed to predict draft force based on two input variables of plowing depth and forward speed. Schematic architect of designed ANN model is presented in Figure 2. The MLP network is the most popular ANN model in engineering problems in term of nonlinear prediction. The MLP network adjusts its biases and weights based on error-back propagation algorithm to diminish prediction error. In this method, input layer is mapped to hidden layer using input transfer function. Hidden layer is similarly mapped to output layer using output transfer function. There are many general transfer functions, namely unit step, linear, gaussian, exponential, sine, logistic, logarithm, and tangent, used in the ANN models.
In the present study, forward speed (3 levels) and plowing depth (3 levels) were chosen as input parameters. The draft force data were selected as target parameter in
output layer. Data set was randomized and partitioned into 70%, 15% and 15%, respectively, for training, validation, and testing the designed network. The different parameters of network (input and output transfer function, number of neurons in hidden layer, and training cycles) were optimized to attain the best structure for developed ANN model using STATISTICA 10 software.
Figure 2 Schematic architect of designed MLP network for predicting draft force
2.6 Statistical assessment of models
Performance of the ASABE, MLR and ANN models developed for prediction of draft force was evaluated based on different statistical criteria. To determine modeling accuracy, regression analysis (coefficient of determination), was conducted between predicted and measured draft force data using Equation 9. Moreover, to determine absolute and relative mean of modeling error, root mean square error (RMSE) and mean absolute percentage error (MAPE), were calculated according to Equations (10) and (11), respectively (Shafaei et al., 2016a; Shafaei et al., 2016b; Shafaei et al., 2017a).
2 , , 2 1 2 , 1 ( ) 1 ( ) i N
meas i pre i
i i N
meas i measave
i DF DF R DF DF = = = = ⎛ − ⎞ ⎜ ⎟ ⎜ ⎟ = − ⎜ − ⎟ ⎜ ⎟ ⎝ ⎠
∑
∑
(9)0.5 2 , , 1 1 ( ) i N
pre i meas i
i
RMSE DF DF
N =
=
⎡ ⎤
=⎢ − ⎥
⎣
∑
⎦ (10), , 1 , | | 100 ( ) i N
pre i meas i
i meas i
DF DF MAPE N DF = = −
=
∑
(11)Where, R2is coefficient of determination; N is number of
used data; DFmeas,iis ith measured draft force (kN); DFpre,i
is ith predicted draft force (kN), and
DFmeasave is average
of measured draft forces (kN).
2.7 Performance comparison of models
proper prediction of draft force, a comparative trend was performed among the statistical performance criteria of developed models. The best model with the highest predictive ability for draft force prediction was found in accordance with the highest coefficient of determination and the lowest values of the RMSE, MAPE, and MVAPRE.
, ,
1
1
| |
i N
pre i meas i
i
MVAPRE DF DF
N =
=
=
∑
− (12)3 Results and discussion
3.1 Statistical descriptions
The calculated statistical parameters for required draft force of the disk plow implement during tillage operations are tabulated in Table 1. According to the table, minimum and maximum draft forces were found in the lowest (FS=2 km h-1 and PD=10 cm) and highest (FS= 6 km h-1 and PD=30 cm) levels of variables, respectively. The high values of coefficient of variation and coefficient of non-uniformity reported in the table indicate that draft force changed considerably as the levels of plowing depth and forward speed varied.
Table 1 Statistical parameters obtained for required draft force of the disk plow during tillage operations
Mean (kN)
Standard deviation (kN)
Minimum (kN)
Maximum (kN)
CV (%)
CNU (%)
11.393 4.220 4.910 22.01 37.041 150.092
3.2 Validation of developed models
3.2.1 Mathematical models
The statistical performance criteria, constant and coefficients of the ASABE and MLR models developed to predict required draft force of the disk plow implement during tillage operations are summarized in Table 2. According to the table, inappropriate values of the statistical performance criteria imply that draft force was poorly predicted by the ASABE and MLR models through the experimental conditions. Figure 3 depicts mismatched relationships between measured and predicted draft forces. In case of the ASABE model, it could be due to mismatch of studied soil properties with the soil parameters which is presented in the ASABE standard (ASABE, 2015). In case of the MLR model, it could be attributed to nonlinear changes of draft force as result of concurrent changes of forward speed and
plowing depth. Although the MLR model could not properly predict draft force, statistical significance of the constant and coefficients of the model indicated that draft force was a function of plowing depth and forward speed.
Table 2 Constant, coefficients and statistical performance criteria of the mathematical models developed to predict draft
force
MVAPRE (kN) MAPE
(%) RMSE
(kN)
R2
a2
a1
a0
Model
1.623 5.267
1.282 0.852
– – –
ASABE
1.552 3.464
1.097 0.897 1.687*
0.369*
–2.144*
MLR
Note: *Significant at 0.01 probability level (P<0.01).
Figure 3 Comparison between measured and predicted draft force by the mathematical models ● the ASABE and ■ MLR model 3.2.2 ANN model
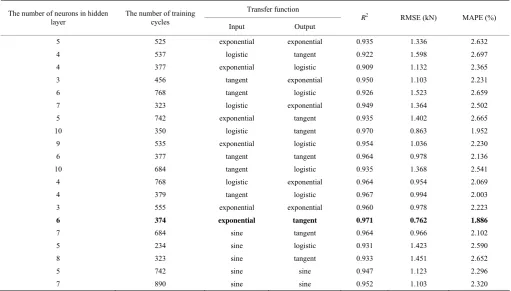
The architecture parameters and values of statistical performance criteria of selected twenty ANN models developed to predict required draft force of the disk plow implement during tillage operations are presented in Table 3. The boldfaced line in the table represents the best model with the highest predictive ability (R2=0.971,
respectively. Therefore, prediction residual error of the best ANN model was not sensitive to measured data.
Comparison between results of this study and previous works (Taghavifar et al., 2013; Taghavifar and
Mardani, 2014c; Taghavifar and Mardani, 2015) indicated excellent predictive ability of the ANN model for estimation of Agricultural and Biosystems Engineering objects.
Table 3 The architecture parameters and statistical performance criteria of selected twenty ANN models developed to predict draft force
Transfer function The number of neurons in hidden
layer
The number of training
cycles Input Output R
2 RMSE (kN) MAPE (%)
5 525 exponential exponential 0.935 1.336 2.632
4 537 logistic tangent 0.922 1.598 2.697
4 377 exponential logistic 0.909 1.132 2.365
3 456 tangent exponential 0.950 1.103 2.231
6 768 tangent logistic 0.926 1.523 2.659
7 323 logistic exponential 0.949 1.364 2.502
5 742 exponential tangent 0.935 1.402 2.665
10 350 logistic tangent 0.970 0.863 1.952
9 535 exponential logistic 0.954 1.036 2.230
6 377 tangent tangent 0.964 0.978 2.136
10 684 tangent logistic 0.935 1.368 2.541
4 768 logistic exponential 0.964 0.954 2.069
4 379 tangent logistic 0.967 0.994 2.003
3 555 exponential exponential 0.960 0.978 2.223
6 374 exponential tangent 0.971 0.762 1.886
7 684 sine tangent 0.964 0.966 2.102
5 234 sine logistic 0.931 1.423 2.590
8 323 sine tangent 0.933 1.451 2.652
5 742 sine sine 0.947 1.123 2.296
7 890 sine sine 0.952 1.103 2.320
Note: The boldfaced line represents the outperforming model
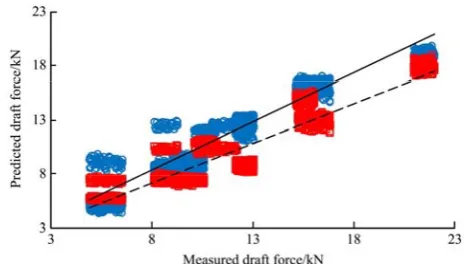
Figure 4 Mapping between predicted and measured values of draft force of the disk plow implement by the best ANN model
Figure 5 Distribution of prediction residual error of draft force modeling by the best ANN model
3.3 Performance comparison of the models
Comparison of the statistical performance criteria of the mathematical models (ASABE and MLR) and the best developed ANN is graphically depicted in Figure 6. According to the figure, the best ANN model with higher value of R2, and lower values of the RMSE, MAPE, and
MVAPRE was better rated than the ASABE and MLR
models for prediction of required draft force of disk plow implement during tillage operations. Therefore, it can be stated that the best ANN model developed in this study was sufficient enough for prediction of draft force directly based on simultaneous changes of forward speed and plowing depth in the experimental range of 2-6 km.h1
Figure 6 Comparison between the statistical performance criteria of assessment of the ASABE, MLR, and ANN models for draft force prediction of the disk plow implement during tillage operations
3.4 Draft force prediction
To study draft force behavior of the disk plow implement during tillage operations, the corresponding ANN surface plot was served to illustrate interrelationship between draft force, and plowing depth and forward speed (Figure 7). As it can be appreciated in the plot, the ANN model nonlinearly responses to input variables. It is also inferred that draft force increased as plowing depth was raised from 10 to 30 cm. Any increment of plowing depth leads to the increase of soil volume cut, dispersed and moved. Accordingly, higher draft force is required to plow higher soil volume (Al-Suhaibani and Ghaly, 2013). It can be also mentioned that increment of forward speed from 2 to 6 km h-1 resulted in draft force growth. Soil particles intend to gain higher acceleration as forward speed rises. The higher acceleration forces result in increase of normal loads acting on the implement disks. When the normal load increases, frictional force and thereby, draft force increases (Kepner et al., 2005).
Figure 7 The ANN prediction of draft force of the disk plow implement during tillage operations
Comparison of the ANN modeling results of the present study with some previous published results reported by Naderloo et al. (2009), Shafaei et al. (2017b), and Shafaei et al. (2018d) for other plow implements, respectively, implied the same trend of the increasing effect of plowing depth on draft force. Meanwhile, the increasing effect of forward speed on draft force obtained in this study for disk plow implement was in agreement with those presented by Cullum et al. (1989) and Novák et al. (2014) for one-way disk with seeder and cultivator, respectively.
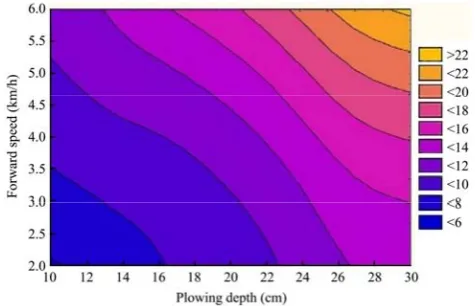
Figure 8 graphically shows results of the ANN modeling for the dual interaction effect of forward speed and plowing depth on draft force of the disk plow implement during tillage operations. According to the figure, it is comprehended that the dual interaction effect of forward speed and plowing depth on draft force was congruent. As it can be seen in the figure, the congruent increasing dual interaction effect of plowing depth in the range of 10-30 cm along with forward speed in the range
Figure 8 The dual interaction effect of forward speed and plowing depth on draft force of the disk plow implement during
of 2-6 km h-1 lead to integrated growth of draft force from
the lowest bound (<6 kN) to the highest bound (>22 kN). The positive dual interaction effect of plowing depth and forward speed on draft force was also reported in previous studies by Al-Suhaibani and Ghaly (2010), and Al-Suhaibani et al. (2010) for medium size and super heavy chisel plow implement, respectively, in a sandy soil.
4 Conclusions and recommendations
This paper was dedicated on the modeling of required draft force of the disk plow implement during tillage operations in clay loam soil as affected by forward speed and plowing depth. Potential of the mathematical models (ASABE and MLR) and the ANN data mining model for high accuracy prediction of draft force was assessed. According to the acceptable statistical performance criteria of R2=0.971, RMSE=0.762 kN, MAPE=1.886%
and MVAPRE=0.968 kN obtained for the well-developed ANN model, it was realized that the ANN model was proper than the mathematical models. The ANN promising results demonstrated that draft force nonlinearly increased as forward speed and plowing depth increased. It is concluded that the proposed ANN model can be used as a powerful tool to better understand draft force behavior as influenced by forward speed and plowing depth. The applicable ANN modeling results obtained in the study are recommended to be practically used by the farmland managers in regions with similar soil texture for proper selection of tractor type for pulling the disk plow in a high-efficiency manner.
References
Aboukarima, A. M. 2007. Draft models of chisel plow based on simulation using artificial neural networks. Misr Journal of Agricultural Engineering, 24(1): 42–61.
Aboukarima, A. M., and A. F. Saad. 2006. Assessment of different indices depicting soil texture for predicting chisel plow draft using neural networks. Alexandria Science Exchange Journal,
27(2): 170–180.
Akbarnia, A., A. Mohammadi, F. Farhani, and F. R. Alimardani. 2014. Simulation of draft force of winged share tillage tool using artificial neural network model. Agricultural Engineering International: the CIGR Journal, 16(4): 57–65.
Alimardani, R., Y. Abbaspour-Gilandeh, A. Khalilian, A. Keyhani, and S. H. Sadati. 2009. Prediction of draft force and energy of
subsoiling operation using ANN model. Journal of Food, Agriculture and Environment, 7(3&4): 537–542.
Al-Suhaibani, S. A., A. Al-Janobi, and A. E. Ghaly. 2010. Determination of kinetic parameters of a super heavy chisel plow under various operating conditions. American Journal of Applied Sciences, 7(8): 1148–1156.
Al-Suhaibani, S. A., and A. E. Ghaly. 2010. Effect of plowing depth of tillage and forward speed on the performance of a medium size chisel plow operating in a sandy soil. American Journal of Agricultural and Biological Sciences, 5(3):
247–255.
Al-Suhaibani, S. A., and A. E. Ghaly. 2013. Comparative study of the kinetic parameters of three chisel plows operating at different depths and forward speed in a sandy soil. The International Journal of Engineering and Science, 2(7): 42–59. Al-Suhaibani, S. A., M. F. Wahby, A. M. Aboukarima, and I. S.
Tabash. 2015. Study on the effect of soil moisture content and plowing speed on draft requirements of a moldboard plow.
Journal of Advances in Agriculture, 4(3): 477–486.
ASABE. 2015. ASAE D497.7 MAR2011 (R2015). Agricultural machinery management data. St. Joseph, Mich.: ASABE. Askari, M., and S. Khalifahamzehghasem. 2013. Draft force inputs
for primary and secondary tillage implements in a clay loam soil. World Applied Sciences Journal, 21(12): 1789–1794.
Choi, Y. S., K. S. Lee, and W. Y. Park. 2000. Application of a neural network to dynamic draft model. Agricultural and Biosystems Engineering, 1(2): 67–72.
Cullum, R. F., W. D. Graham, and L. D. Gaultney. 1989. Tillage energy requirements in interior Alaska. Soil and Tillage Research, 13(3): 317–327.
Harrigan, T. M., and C. A. Rotz. 1995. Draft relationships for tillage and seeding equipment. Applied Engineering in Agriculture, 11(6): 773–783.
Harrison, H. P., and W. B. Reed. 1962. An analysis of draft, depth and speed of tillage equipment. Canadian Agricultural Engineering, 4(1): 20–23.
Ismail, W. I. W., and T. H. Burkhardt. 1993. Draft and fuel requirements measurement using tractor on-board data acquisition system. Pertanika Journal of Science and Technology, 1(1): 51–64.
Karparvarfard, S. H., and H. Rahmanian-Koushkaki. 2015. Development of a fuel consumption equation: test case for a tractor chisel-ploughing in a clay loam soil. Biosystems Engineering, 130(1): 23–33.
Kepner, R. A., R. Bainer, and E. L. Barger. 2005. Principles of Farm Machinery. 3rd ed. Published by, New Delhi, India:
CBS Publishers and Distributors Pvt. Ltd.
Kumar, A. A., V. K. Tewari, and B. Nare. 2016. Embedded digital draft force and wheel slip indicator for tillage research.
Computers and Electronics in Agriculture, 127(1): 38–49.
of model chisel furrowers. Agricultural Engineering International: the CIGR Ejournal, Vol. VII., Manuscript PM
05 003.
Naderloo, L., R. Alimadani, A. Akram, P. Javadikia, and H. Z. Khanghah. 2009. Tillage depth and forward speed effects on draft of three primary tillage implements in clay loam soil.
Journal of Food, Agriculture and Environment, 76(3):
382–385.
Novák, P., J. Chyba, F. Kumhála, and P. Procházka. 2014. Measurement of stubble cultivator draught force under different soil conditions. Agronomy Research, 12(1): 135–142.
Rahmanian-Koushkaki, H., S. H. Karparvarfard, and A. Mortezaei. 2015. The effect of the operational characteristics of the tractor composite electronic measurement system by the standards of emotion on the performance of chisel plows in a clay loam soil. Agricultural Engineering International: CIGR Journal, 17(1): 44–49.
Ranjbarian, S., M. Askari, and J. Jannatkhah. 2017. Performance of tractor and tillage implements in clay soil. Journal of the Saudi Society of Agricultural Sciences, 16(2): 154–162.
RNAM. 1995. RNAM test codes and procedures for farm machinery. In Economic and Social Commission for Asia and the Pacific, Regional Network for Agricultural Machinery.
RNAM technical publications: 12. Bangkok, Thailand. Roul, A. K., H. Raheman, M. S. Pansare, and R. Machavaram.
2009. Predicting the draught requirement of tillage implements in sandy clay loam soil using an artificial neural network. Biosystems Engineering, 104(4): 476–485.
SAA. 1977. Standards Association of Australia. AS 1289.2.1.1. Soil moisture content tests-Determination of the moisture content of a soil-Oven drying method. Sydney, Australia: Standards Australia International Ltd.
Shafaei, S. M., A. A. Masoumi, and H. Roshan. 2016a. Analysis of water absorption of bean and chickpea during soaking using Peleg model. Journal of the Saudi Society of Agricultural Sciences, 15(2): 135–144.
Shafaei, S. M., A. Nourmohamadi-Moghadami, and S. Kamgar. 2016b. Development of artificial intelligence based systems for prediction of hydration characteristics of wheat.
Computers and Electronics in Agriculture, 128(1): 34–45.
Shafaei, S. M., A. Nourmohamadi-Moghadami, and S. Kamgar. 2017a. Experimental analysis and modeling of frictional behavior of lavender flowers (Lavandula stoechas L.). Journal of Applied Research on Medicinal and Aromatic Plants, 4(1): 5–11.
Shafaei, S. M., A. R. Heydari, A. A. Masoumi, and M. Sadeghi. 2015. Determining and modeling of static friction coefficient of some agricultural seeds. Jordan Journal of Agricultural Sciences, 11(4): 1007–1019.
Shafaei, S. M., and S. Kamgar. 2017. A comprehensive investigation on static and dynamic friction coefficients of wheat grain with the adoption of statistical analysis. Journal of Advanced Research, 8(4): 351–361.
Shafaei, S. M., M. Loghavi, and S. Kamgar. 2017b. Appraisal of Takagi-Sugeno-Kang type of adaptive neuro-fuzzy inference system for draft force prediction of chisel plow implement.
Computers and Electronics in Agriculture, 142(1): 406–415.
Shafaei, S. M., M. Loghavi, and S. Kamgar. 2018a. On the neurocomputing based intelligent simulation of tractor fuel efficiency parameters. Information Processing in Agriculture,
5(2): 205–223.
Shafaei, S. M., M. Loghavi, and S. Kamgar. 2018b. Prognostication of energy indices of tractor-implement utilizing soft computing techniques. Information Processing in Agriculture, in Press.
Shafaei, S. M., M. Loghavi, and S. Kamgar. 2018c. Development and implementation of a human machine interface-assisted digital instrumentation system for high precision measurement of tractor performance parameters. Engineering in Agriculture, Environment and Food, in Press.
Shafaei, S. M., M. Loghavi, S. Kamgar, and M. H. Raoufat. 2018d. Potential assessment of neuro-fuzzy strategy in prognostication of draft parameters of primary tillage implement. Annals of Agrarian Science, in Press.
Taghavifar, H., A. Mardani, and L. Taghavifar. 2013. A hybridized artificial neural network and imperialist competitive algorithm optimization approach for prediction of soil compaction in soil bin facility. Measurement, 46(8): 2288–2299.
Taghavifar, H., and A. Mardani. 2014a. Application of artificial neural networks for the prediction of traction performance parameters. Journal of the Saudi Society of Agricultural Sciences, 13(1): 35–43.
Taghavifar, H., and A. Mardani. 2014b. Wavelet neural network applied for prognostication of contact pressure between soil and driving wheel. Information Processing in Agriculture,
1(1): 51–56.
Taghavifar, H., and A. Mardani. 2014c. Applying a supervised ANN (artificial neural network) approach to the prognostication of driven wheel energy efficiency indices.
Energy, 68(1): 651–657.
Taghavifar, H., and A. Mardani. 2015. Prognostication of energy consumption and greenhouse gas (GHG) emissions analysis of apple production in West Azarbayjan of Iran using Artificial Neural Network. Journal of Cleaner Production, 87(1):
159–167.
Taghavifar, H., and A. Mardani. 2017. Off-road Vehicle Dynamics-Analysis Modeling and Optimization. Switzerland: