OCEANOGRAPHIC
Australian Oceanographic Data Centre
Maritime Headquarters
Wylde Street, POTTS POINT N.S.W. 2011 AUSTRALIA
Prepared by
Data Management Group
CHAPTER 1
INTRODUCTION
2
CHAPTER 2
QUANTITIES MEASURED AND INSTRUMENTS USED 3
1 DEPTH 3
2 TEMPERATURE 4
3 SALINITY 8
4 OXYGEN, PHOSPHATE, SILICATE, NITRATE, pH 9 5 WATER CLARITY 10
6 SOUND 11
7 SOUND SPEED 12
8 CURRENTS 13
a Electromagnetic Current Meters 13 b Acoustic Current Meters 14 c Drifting Buoys 15 9 WAVES AND TIDES 17 10 SEABED SAMPLING 18 11 BIOLUMINESCENCE 21
1.
INTRODUCTION
Oceanographic instruments measure or sample various physical, chemical and biological quantities in the water column. There is often more than one way to measure a particular quantity (i.e. temperature, currents) and there are many quantities to measure hence there are many instruments. This course will attempt to cover the more common instruments used by the oceanographer.
We will first start by listing which quantities commonly measured these include:
*Depth (metres)
*Temperature (degree Celsius)
*Salinity (practical salinity units of chlorine, sodium, sulfate, magnesium and potassium) *Oxygen, *Phosphate, *Nitrate, *Silicate, *pH
*Density (kilos per cubic meter)
*Water Clarity (Forel scale to measure colour) *Sound or Ambient Noise (hertz)
*Sound Speed *Bioluminescence *Seabed sediment *Current
*Waves
Some physical properties of seawater are conservative (i.e. temperature and salinity), this means that away from the surface the only way they can change is by mjxing.
All of the above quantities are normally accompanied by a measurement of date, time and position i.e latitude and longitude. Measurement of time and position are made with the Global Positioning System (GPS) and are relative to the GMT time. Accuracy is of the oder of +/- 10-15m.
2.
QUANTITIES MEASURED AND
INSTRUMENTS USED
2.1
DEPTH
The measurement of the depth regards the instrument or the sea-floor and is fundamental to reference the location of the measurement.
The simplest way to measure the depth of the measurement is to mark the wire or rope to which the instrument is attached and measure the length used.
The more accurate way is to measure the water pressure at the instrument level and convert this to a depth.
The simplest way to measure sea-bed depth is to lower a weight with a wire or rope and measure the length used till the weight has reached the bottom.
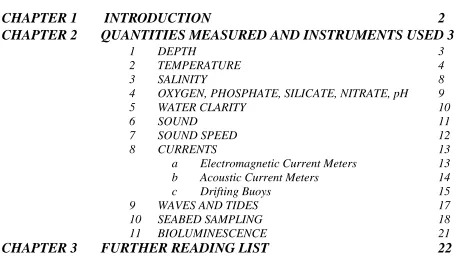
Yet another is to use an ECHO SOUNDER and time how long takes for the sound pulse to echo back. Two instruments are the SONAR (sound navigation and ranging) and the SOFAR (sound fixing and ranging).
Figure 1. Velocimeter, sonic frequency system
2.2
TEMPERATURE
There are several ways of measuring temperature, the simplest being a mercury-in-glass or STEM
THERMOMETER. A stem thermometer is commonly used to measure sea surface temperature by
placing it in a bucket of sea water.
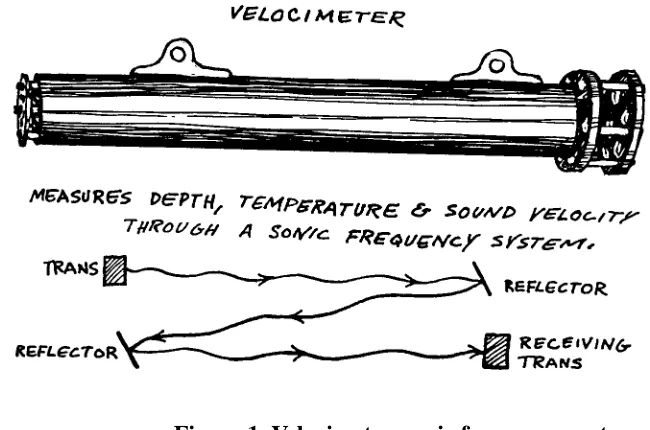
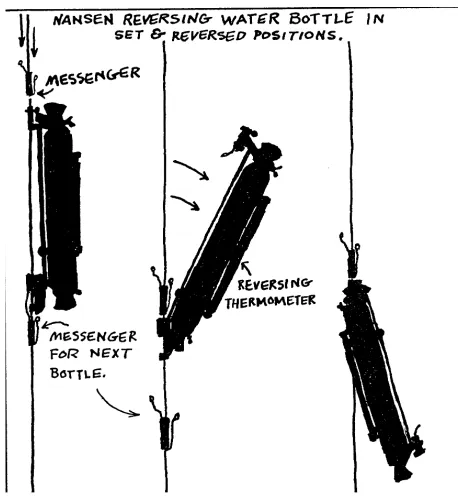
A PROTECTED REVERSING THERMOMETER is special kind of stem thermometer which measures sub-surface temperature [Figure 1]. 'Protected' means that the thermometer is isolated from water pressure. The reversing thermometer is attached to a WATER SAMPLING BOTTLE. When the sampling bottle is closed the thermometer is inverted and, as a result of its construction the mercury 'breaks' at a particular point and runs down the other end of the capillary to record the temperature at the depth of the reversal. After the thermometer has been reversed it becomes almost insensitive to subsequent changes of temperature and it is read when it is bought back on deck. After corrections for scale errors and for the small change in reading due to any difference between the in-situ temperature and that on the deck, the reversing thermometer is accurate to about +/- 0.02 C in routine use.
Figure 2. Nansen reversing water bottle
An UNPROTECTED REVERSING THERMOMETER is as described above except that it is exposed to water pressure. The water pressure compresses the glass in the bulb and causes the thermometer to indicate a higher temperature than the protected thermometer. The difference between the two thermometers is a measure of the compression of the glass which depends on a known compressibility and upon pressure i.e the depth.
Figure 3. Reversing thermometer
Another widely used temperature sensor is the THERMISTOR. The thermistor is usually a small piece of electrically conductive material such as a resistor. The thermistor relies upon measuring electrical resistance which is directly or inversely proportional to temperature.
Thermistors are used on CTD (conductivity, temperature and depth) and EXPENDABLE
BATHYTHERMOGRAPH (XBT) instruments.
Figure 4. CTD (conductivity, temperature and depth)
and a transmissometer. The water samples are used for collection and used for calibration and chemical/nutrient analysis. The instrument provides real-time sections or profiles of temperature, salinity, density, geostrophic currents and dissolved oxygen. The temperature/salinity diagrams are used for water mass identification.
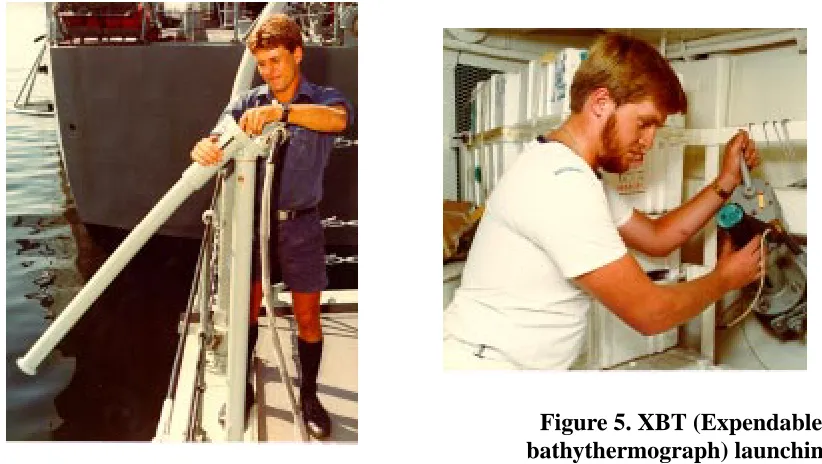
Figure 5. XBT (Expendable bathythermograph) launching
The XBT is composed by a ‘torpedo’-shaped probe which contains a thermistor and a very fine coiled copper wire which is unreeled both from the probe and from the canister from which it is deployed. It is launched from the ship being either hand-held, deck-mounted or hull-mounted. The depth is calculated from the elapsed time and the expected fall rate (~6.5 m/s) and comes into 4 types (T4 ~460m, T7 ~760 m, T10 ~200m, TDeep ~760). This instrument provides actually a large body of data ( global dataset) over many seasons/years for statistical evaluation of climatic changes.
THERMISTOR 'CHAINS' consisting of a cable with a number of thermistor elements at intervals are sometimes moored along with current meters to record temperature at a number of depths. A ‘data logger' samples each thermistor at regular intervals and records temperatures as a function of time.
A SEASOR is an ‘small aeroplane’ looking instrument that is lowered in the water and moored by the ship at a known depth or at the surface, with the aid of a conducting cable the data is real-time monitored and produces typical sections such as virtual CTD profiles. (see picture, slide from jane)
Figure 7. Seasoar
2.3
SALINITY
Salinity is a measure of the quantity of salt in a volume of sea water. It has the standard units of Practical Salinity Units (psu). In very approximate terms a salinity of 35 psu means there are 35 grams of salt in a kilogram of water.
Salinity is an important quantity to measure as salinity in conjunction with temperature and depth/pressure enables calculation of the density of the sea water and also sound speed.
Salinity in combination with temperature also allows the oceanographer to label particular water masses in the ocean and study the movement of these water masses and hence infer ocean currents.
Salinity is obtained by first measuring the electrical conductivity of the sea water at a known temperature and pressure. Using an internationally standard formula the conductivity is then converted to a salinity.
Salinity may be measured from a water bottle sample on the ship using a laboratory
SALINOMETER or in-situ using a conductivity sensor such as on a CTD.
The salinometer measures a conductivity ratio using a conductance cell and conductance bridge which is balanced manually. The ratio measured is between a standard sample of sea water at 35.000 psu and the sample. Salinity is then obtained from the conductivity ratio and temperature using standard tables or formulas.
2.4
OXYGEN, PHOSPHATE, SILICATE, NITRATE, pH
Oxygen content of sea water is commonly measured in conjunction with CTD measurements or water bottle sampling. CTD units sometimes have a oxygen sensor attached enabling an in-situ measurement of oxygen, but these measurements produce noisy results which need to be filtered.
Oxygen content from water samples is determined by chemical titration. The titration method is often more reliable than using an in-situ sensor which may suffer from drift or calibration problems. Figure 8 shows water samples being taken from an array of water bottles attached to a CTD unit.
Figure 8. Wet Laboratory of RV Franklin, Water Bottle Sampling. Oxygen bottle being filled at right, Salinity bottle at left.
2.5
WATER CLARITY
Water clarity may be taken as a measure of the degree of transmission of visible light through the sea so are taken whenever possible during daylight hours. The more 'turbid' the water the less light transmitted. Water clarity has allways been measured to estimate the silt run-off from rivers, monitoring pollution streams ans monitoring algae growth.
The simplest device for measuring water clarity is the SECCHI DISC which consists of a 30 cm in diameter white plate which is lowered into the water (a lead weight is suspended under the disc to ensure that it will sink rapidly and vertically) and depth at which it lost to sight noted. The greater the depth at which the disc is no longer visible the clearer the water. During the procedure the colour of the disc is classified with the Florel-Ule scale. The secchi disc is only a semi-quantitative device but being simple and a low-cost device it is often used.
Figure 9. Secchi Disc
A more quantitative device is the TRANSMISSOMETER which measures the attenuation of the beam of light of known wavelength over a fixed path length. The transmissometer uses a light source and a photo-electric-cell and measures the beam attenuation co-efficient ‘C’ over a direct path from the source to the photo-cell. The beam attenuation co-efficient is a function of the shapes and amount of particulate material in the water.
2.6
SOUND
Sound is measured in the sea to support a number of applications most notably for Naval sonar operations, geophysical studies and also for studying sounds emitted by marine life.
The basic instrument used to measure sound is the HYDROPHONE. A hydrophone is a transducer which converts sound energy (pressure) into electrical energy (current). Some substances such as quartz or certain ceramics when placed under pressure acquire an electrical charge or voltage across the crystal surface. This behaviour is called 'piezo-electricity'. Thus the hydrophone consists of sensor made of a crystalline or ceramic substance.
The basic unit of sound measurement is the 'decibel' which is measure of the pressure exerted by the sound wave or measure of the sound intensity. The other important quantity is the frequency of the wave measured in 'Hertz'.
Sound in the sea may be thought of consisting of many super-imposed waves at varying levels of intensity and frequency resulting in a complex wave arriving at the sensor. Using mathematical techniques the complex wave is decomposed into waves of discrete frequency and intensity. The result of this analysis is a graph of intensity (decibels) versus frequency (Hertz) called a 'spectrum'.
The sound or background noise is frequently referred to as 'ambient noise'.
Many hydrophones consist of more than one sensor element or an 'array'. The advantages of an array over a single hydrophone are several. First the array is more sensitive, since a number of elements will generate more voltage (if connected in series) or more current (if connected in parallel) than a single element exposed to the same sound field. Second, the array possesses directional properties that enable it to discriminate from sounds arriving from different directions. Third, the array has an improved signal-to-noise ratio since it discriminates against isotropic noise in favour of a signal arriving in the direction that an element of the array is pointing.
Sonar domes fixed to the hull of naval vessels have a cylindrical array. A recent development is the 'towed array' which of a flexible line of hydrophone elements towed from a ship.
2.7
SOUND SPEED
Sound speed is a measure of how quickly sound propagates through the ocean. Sound speed is needed for measuring the water depth with ECHO SOUNDERS since the water depth is calculated by multiplying the mean sound speed in the water column by half the time that it takes for the sound to echo back from the sea bed.
The basic means of measuring sound speed is to measure the time it takes for a pulse of sound to travel a known distance. The sensor consists a sound source a metal reflector and receiver.
The sensor may be attached to a probe which is lowered into the water or on an expendable instrument such as the EXPENDABLE SOUND VELOCITY (XSV) probe. The XSV works on simple principle to the XBT.
2.8
CURRENTS
Measurement of ocean current is fundamental to a general understanding the ocean. Ocean currents transport heat and effect climate and weather. Currents transport marine life and sediments. Currents also effect the passage of ships and also the oceanographic instruments themselves.
Current is a vector quantity having both a direction and a speed. Therefore a current instrument must measure both direction and speed.
There are different basic ways of measuring a current, these are:
1. The oldest method of tracing a current is by the use of a DRIFT BOTTLE or CARD. These floating items are designed so that their movement is determined only by surface currents and contain a request to the finder to notify the time and place of recovery
2. A MOORED CURRENT METER in the sea produces measurements of speed and direction at fixed time intervals.
3. Attach the current meter to a moving platform such as a ship and measure the relative cur-rent. The absolute current is then determined by such vector subtracting the motion of the ships over the ground determined by navigation. This method is used with the ACOUSTIC
DOPPLER CURRENT PROFILER (ADCP). An ADCP may also be moored at a fixed
location on the sea-bed.
4. Let an object flow or float with the current and observe its motion i.e the change of position at fixed time intervals. For example a DRIFTING BUOY.
5. A DYNAMIC METHOD recognises that the surface of the sea is not level but has hills and valleys. Therefore countour maps may be drawn of its surface showing these elevations and depressions. Taking into account that in the southern hemisphere ocean currents flow in an anti-clockwise direction around areas of high sea level, a map of sea flow of an area can be drawn from a knowledge of the topography of the surface. These contours are not visible by the naked eye but are correlated to the density of the water, the water below a hill being of lower density than that below a valley. The density of the water instead of being directly measured is computed from the temperature and the salinity of the ocean water.
Owing to turbulence current is a quantity which often fluctuates over short periods of time and usually averaging or smoothing is required to present the data in useful form. This process of averaging is termed 'vector averaging'. Current meters which use vector averaging sample the current at short intervals, say once every 2 seconds, and then compute the average over a longer interval, say 10 minutes. The resulting output of the meter is a time series of current at the averaging interval.
There are 4 common techniques of current measurement as follow
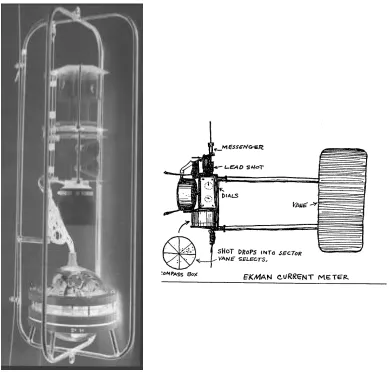
2.8.1 Propellor Type Meters
Current meters such as the Aanderaa frequently incorporate other in-situ sensors such as water temperature and water pressure which allow recording of other data in conjunction with current.
Figure 10. Standard type of current meter and Ekman current meter 2.8.2 Electromagnetic Current Meters
These instruments use the principle that a voltage will be induced by a conductor which moves across a magnetic field. The conductor in this case is sea-water which readily conducts a current due to salt ions.
2.8.3 Acoustic Current Meters
Acoustic current meters utilise the Doppler effect named after the Austrian physicist C. J. Doppler. The Doppler effect is the change in frequency of sound reflected by a stationary object relative to the frequency at which it is moving.
The ACOUSTIC DOPPLER CURRENT PROFILER (ADCP) emits a beam of sound of known frequency which reflects off small particles moving with the water. The beam reflected back to the receiver will have a change in frequency proportional to the speed of the particles and thus the current speed.
One sound beam will give the component of current in the direction of the beam. However three orthogonal components are needed to get the true current vector so the ADCP utilises more than one beam. Four beams are typically used to obtain a redundant velocity measurement for data checking and improved instrument reliability.
ADCP's measure water speed at multiple water depths or 'range cells' along the path of the acoustic beams. This is achieved by periodically transmitting short pulses (typically 1-50 milliseconds) of sound, then making multiple measurements of the frequency of the echoes at discrete time intervals after the initial sound pulse.
In this way a depth profile of the current is assembled after some averaging processes. On a moving platform such as a ship the motion of the ship must be subtracted from the ADCP relative current to get the true current. Usually the motion of ship is determined by using GPS navigation which offers the best means of accurately determining the ships motion at frequent intervals.
The end result of the ADCP data processing is a time series of current versus depth profile along the track of ship. In the case of moored ADCP it is time series at a fixed point.
2.8.4 Drifting Buoys
A drifting buoy is a device which floats on the ocean surface to follow the current. The buoy usually includes a ‘drouge’ which is device such as a parachute or sheet to drag the buoy with current. The drouge is attached to the buoy below the water.
Some method is needed of tracking the buoys position. Position tracking may be done using the following methods:
1. Visual sighting with a bearing compass.
2. Attaching a metal target/reflector to the buoy so it can traced by radar.
3. Using a radio transmitter and tracking the buoy location with a radio receiver such as satellite.
Drifting buoys may have other sensors attached such as thermistors which measure sea surface temperature, a pressure gauge to measure air pressure and an anemometer which measures wind speed and direction.
transponders on the seabed can be located with high precision while sinking and drifting with the currents. This device produces a profile with ‘real’ current components with depth and after each profile, so after it has reached the seabed, it reached the surface again awaiting for collection.
Figure 11. Pegasus velocity recorder
2.9
WAVES AND TIDES
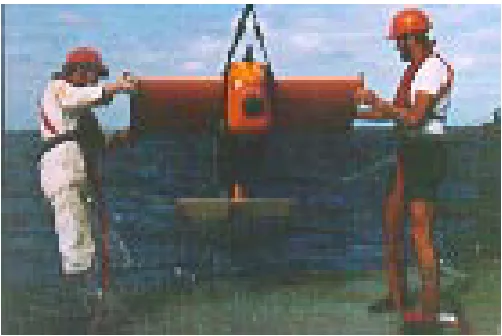
The most common instrument used for measuring waves is the WAVERIDER BUOY (figure 12). A waverider buoy is a buoy which follows the movements of the water surface.
Figure 12. Waverider Buoy
The wave height is measured with an ACCELEROMETER which measures the vertical acceleration of the water. The acceleration is integrated to produce a time series of displacement of the sea surface i.e a time series of wave height. The buoy is typically attached to a flexible mooring line which in turn is attached to heavy weight on the sea bed.
The wave height signal is usually transmitted by radio signal to a ship or shore station from an antenna attached to the buoy.
2.10
SEABED SAMPLING
Seabed information is very usefull to estimate anchorage safety locations, offshore engineering (such as siting of platforms, beacons and sea walls), mineral exploration, fishing, minewarfare, submarine operations and sonar acoustic performance. The classification of the bottom type relies on a geological/scientific classification, and hydrographic classification (description of the most predominant components, the grain size grading), the nature of the sea floor (washed materials, erosion, biological sediments).
Figure 13.
Seabed sampling can be obtained by different means. Leadlines, Grabs, Snappers and Scoops, Corers, Dredges, Divers, and Remotedly Operated Vehicles and Submersibles.
LEADLINES are weights armed with a sticky substance to which the particles adhere and to
GRABS, SNAPPERS AND SCOOPS are used for collecting medium size samples from the
surface and immediate sub-surface layer of the sea floor. They usually comprise a bucket or scoop which is activated on hitting the sea floor. Some are spring-loaded, others close when they are raised off the seabed. The disadvantages of the grabs are that they are not suitable to collect soft or liquid muds as the sample is often washed out of the bucket before it reaches the surface.
Figure 14. Grab samplers
The SHIPEK GRAB consist of two concentric half cilinders that on striking the sea floor rotate through 180 deg. During this rotation the bucket scoops a sample from the seabed and then remains closed whilst the grab is hauled to the surface. This type of grab is most effective on unconsolidated sediments but the impact of the grab on the consolidated and compacted seabed can be liable to make it bounce and to cause only a superficial grab.
CORERS are used to obtain an undisturbed verical sample of the sea floor. They comprise a
Figure 15. Corer
DREDGES are designed to drag along the sea floor collecting loose materials and sediments.
They often incorporate a filter which allows smaller sediments to pass through. Samples are oviously disturbed but do reflect the seabed materials over a reasonable large area.
DIVERS inspection allow a positive identification of the shallow sea floor. Large as well as
2.11
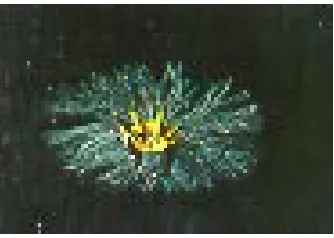
BIOLUMINESCENCE
Bioluminescence is the emission of light by living organisms. The process is such that light is radiated but very little heat is emitted. The process is an animal production and approximately 240 groups of organisms have been identified as bioluminescent, such as dinoflagellates, jellyfishes, copepods, euphausiids, squids and some fishes. Bioluminescence is the result of a substance as Luciferin being oxidized in the presence of a catalitic enzyme, the Luciferase. Bioluminescence is triggered by unexplained internal actions or external actions such as surface and internal waves, ship, fish and whale movements, upwelling.
Bioluminescence can be measured and collected VISUALLY and recorded in coded form from standard tables. Data collected includes information about Stimulus (causes such as light, wave action, rain or fish), Colour, Kind (continuous, patches, bands, blobs, shapes), Duration (seconds or continuous), and Extent (size of patches or continuous) of the Bioluminescence.
Various MESH NETS with preset depth catchers catch larger plankton while the smallest plankton type must be centrifugated because it is too small for the smallest mesh.
3.
FURTHER READING LIST
Pickard G. L. and Emery W. J. 'Descriptive Physical Oceanography', Permagon Press, 4th Edition 1982.
Urick R. J. 'Principles of Underwater Sound', McGraw-Hill Book Company, 3rd Edition 1983.
Captain Long E. J., U.S. Naval Reserve, ‘Ocean Sciences’, United States Naval Institute, 1968
Williams J. and Higginson J. J., ‘Sea and Air, The Marine Environment’, Naval Institute Press, 2nd Edition, 1975