Visual support in assessing listening comprehension: Does
it help?
Latifi, Mehdi
Amin University, Iran ([email protected])
Mirzaee, Akbar
Amin University, Iran ([email protected])
Received: 20 May 2014 Revised: 18 June 2014 Accepted: 19 June 2014
Available Online: 10 July 2014 DOI: 10.5861/ijrset.2014.814
ISSN: 2243-7738 Online ISSN: 2243-7746
OPEN ACCESS
Abstract
The current research was an attempt to determine the effects of implementing visual resources
in assessing the comprehension capability of L2 learners in listening. Forty eight EFL students
in the intermediate and advanced levels of proficiency were chosen to participate in this study.
The subjects were then assigned to four different groups: an Advanced Video Group (AVG),
an Intermediate Video group (IVG), an Advanced Audio Group (AAG) and an Intermediate
Audio Group (IAG). All groups were formed by twelve participants. The subjects went
through a series of multiple choice questions taken from a BBC TV show entitled ‘How to
improve your memory’. The movie was segmented into two parts, based on some
pre-determined criteria, to make the two testing sessions shorter. Having run the test, the
researcher submitted the data to the SPSS software for further analysis. The findings indicated
no meaningful differences among the scores obtained from advance participants, while the
Intermediate Video Group subjects did significantly better on the test compared to the
Intermediate Audio Group leading to the conclusion that visual support can be beneficial to
L2 learners.
Visual support in assessing listening comprehension: Does it help?
1. Introduction
Since the incorporation of videos in language classrooms, visual materials have been considered as an option in language testing, specifically in testing listening comprehension. This was due to the fact that visual materials include the non-verbal components of a spoken text which can be useful for listeners to comprehend the aural input (Baltova, 1994). However, a question may arise at this point as to why to include the visual mode of input in testing. There may be a number of reasons we could put forth as to why this is the case.
First, exploiting video materials helps listeners see more contextual information such as the kinesic behavior of speakers. As Raffler-Engel (1980) asserts, the kinesic behavior is considered as a major source of information which accompanies spoken texts; therefore, it is a form of redundancy of language. “The gestures, facial expressions, and visible stress patterns of the speaker serve to reinforce the linguistic message. When the risk of making speaking errors (and consequently hearing misrepresentations) becomes greater, the number of gestures and other kinesic behaviors increases” (Wanger, 2010). Second, using video materials in test tasks to measure students listening ability might have effects on listeners’ attitudes and affect. Wanger (2002) mentioned that according to research, the investigation of students’ opinions about the use of video materials in listening test tasks has shown that students prefer to be exposed to video over audio-only texts. He attributed this inclination to the fact that the use of video materials is prevalent in teaching listening; hence, learners are comfortable with its utilization. As a result, video input may influence the affective response and performance of the test-takers in a positive manner. Finally, video materials can enhance the input by providing visuals, "thus enabling listeners to have recourse to acoustic and visual working memory which, in turn, may influence their cognitive listening process" (Wanger, 2010).
In the same vein, the Listening Comprehension section of the TOEFL test now uses some visual support for the audio material (Ginther, 2002). However, despite the seemingly general consensus over the beneficial effect of visual support in listening comprehension, different studies have produced conflicting results over the influence of video materials in the listening performance of l2 learners (Ockey, 2007; Wanger, 2010; Latifi, Tavakoli, & Dabbaghi, 2014b). some of which will be discussed below .
Coniam (2001) studied the effect of audio and video materials in testing listening via a case study. Some groups of pre-service and in-service English language teachers participated in the study and were assessed by audio and video versions of a similar test. Following the test, a survey was carried out to ask teachers' opinion about the audio/video mode of measuring listening. The results revealed no meaningful difference between the scores of the audio and video groups. In addition, although some of the teachers in the audio test group pointed out that they would have preferred to have taken the video test, the teachers who were in the video test group were not satisfied with the video test. Therefore, not only did they not feel any advantages, they thought that they would have done better on the audio test, since they were somehow distracted. Coniam concluded that the tests of listening must use audio materials only.
Ginther (2002) examined the effects of visual materials on the performance of test takers on the listening section of Computer-based Test version of TOEFL. The findings of his study indicated that the presence of a visual mode in the test led to the facilitation of performance when the visual support would complement the audio presentation. Therefore, using visuals was found useful in enhancing the performance of the test takers. However, Ockey's (2007) study produced the opposite results. He found out that the six test-takers who participated in his study mentioned very little engagement with the visual support used in the test. They were also different in their attitudes toward the efficacy of the visual support.
takers was in favor of the visual support. Two groups (an audio-only control and a video experimental group) were compared in his study. By using Multi-variate Analysis of Covariance (MANCOVA), he compared the groups’ performances, and it was found that the video (experimental) group scored 6.5% higher than the audio-only (control) group on the test. Wagner concluded that the non-verbal information in the video texts contributed to the video group’s superior performance.
Nonetheless, Similar to Conami (2001) and Ockey (2007) some other researchers take issue with the idea that video materials must be incorporated in language testing. They argue that test-takers are usually so concerned with looking at their test papers and answering questions that they don’t have enough time to look at a monitor or TV screen (Rost, 2002; Brett, 1997). Besides, test takers may be distracted by the video texts (Bejar, Douglas, Jamieson, Nissan, & Turner, 2000; Conami, 2001). MacWilliam (1986) even questions the idea that the use of video materials increases the comprehension ability of the listeners. He asserts that visual supports may lead to reduced comprehension, because the visual components of the videos have the potential to distract the learners’ attention away from the aural input.
As is clear from the literature, the issue of using video texts in (Wanger, 2010) mentioned “there are relatively few studies that directly investigate this notion, and those that do present conflicting evidence about how the visual components of a spoken text affects comprehension of those texts” (p. 3). Some studies (Ginther, 2002; Wanger, 2010) supported the exploitation of visual mode to enhance the comprehension ability of the test takers, while others (Conami, 2001; Ockey, 2007) did not support the use of visuals in test tasks. All in all, the shortage of empirical evidence on this issue gives significance to the present study. More studies can contribute to more valid data in measuring the listening ability of language learners.
2. The study
2.1 Research Questions
Is there any possible difference in the performance of advanced audio and video groups?
Is there any possible difference in the performance of intermediate audio and video groups?
2.2 Participants
The participants were the language learners of Kaj and Gooyesh language centers. Initially, 110 learners enrolled for the fall semesters of the institutes in both intermediate and advanced levels (40 advanced and 70 intermediate). All students sat a placement test (OPT) composed of listening, grammar, reading, writing, and speaking sections to be divided into advanced and intermediate groups. According to the result of OPT, 24 advanced and 24 intermediate participants were selected to take part in the study. They were divided into 4 groups; advanced video group, Intermediate video group, advanced audio group, Intermediate audio group, with each group containing 12 subjects. Meanwhile, all participants were between the age range of 15 to 28.
2.3 The Instrument
avoided and only pieces of information were asked for that could convey a meaningful idea, including the gist of what was said. All in all, there were twenty multiple-choice questions for two episodes, which mean the final score of the participants was calculated out of 20. Besides, the internal consistency reliability estimates was also calculated for the measurement instruments using Cronbach’s alpha α = 0.81. In addition, to divide the
participants into advanced and intermediate groups, a placement test (OPT) composed of listening, grammar, reading, writing, and speaking sections was used in the study.
2.4 The procedure
To carry out the study, first, the participants were divided into advanced and intermediate groups based on an OPT test. According to the outcome of the OPT, 24 advanced and 24 intermediate subjects were randomly assigned into 4 groups: one Advanced video group, one Intermediate video group, one Advanced audio Group, and one Intermediate audio group with each group containing 12 subjects. Thereafter, each group took the test on the same day. Both the visual and aural modes were used to deliver the input to the test-takers. For the video groups, there was a 24 inch TV screen available in the classrooms and the subjects could see the TV screen without any difficulty. For the audio groups, only the aural mode was used to deliver the input, a cover was prepared for the TV set in order to block any visual support; hence, they could only hear the sound. Before playing the sections of the movie, a general theme of the documentary was explained to the subjects in order to avoid any possible confusion and before starting each section, the subjects were instructed to read the questions in 2 minutes to get a hold of what pieces of information they were supposed to look for in the test. Then, the sections were played and the participants answered the questions in an answer sheet provided by the researcher.
2.5 Data analysis
There was a dichotomous way of scoring to compute the scores. One point was assigned to each correct response for each item and 0 point for the wrong response. Lastly, the final score of each participant was calculated out of 20 since there were 20 items in the test. In order to calculate the data and to locate the statistically significant differences between and among the groups, a One-Way ANOVA and a Scheffe post-hoc were conducted. The results of the analysis are summarized in tables 1 and 2. In Figure 1, the mean performance of each group is displayed.
3. Results
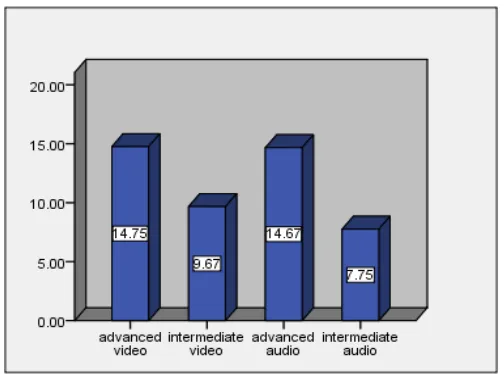
Figure 1. The Means for the Performance of Audio and Video Groups
groups, the Intermediate Video group leads the Intermediate Audio Group with 1.93 higher overall mean score. The mean score of the intermediate Audio Group is noticeably lower than the other groups. Still, to see whether or not the differences are statistically significant, a One-Way ANOVA and a Scheffe post hoc were run.
Table 1
The One-Way ANOVA for the Performance of Audio and Video groups
Sum of Squares Df Mean Square F Sig. Between Groups 454.083 3 151.361 74.136 .000 Within Groups 89.833 44 2.042
Total 543.917 47
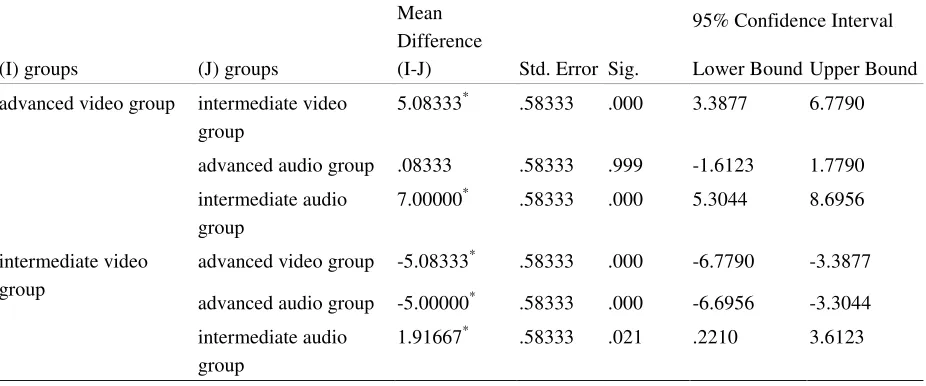
Table 2
Scheffe Post Hoc for the Performance of Intermediate Audio and Video Groups
(I) groups (J) groups
Mean Difference
(I-J) Std. Error Sig.
95% Confidence Interval
Lower Bound Upper Bound advanced video group intermediate video
group
5.08333* .58333 .000 3.3877 6.7790
advanced audio group .08333 .58333 .999 -1.6123 1.7790 intermediate audio
group
7.00000* .58333 .000 5.3044 8.6956
intermediate video group
advanced video group -5.08333* .58333 .000 -6.7790 -3.3877
advanced audio group -5.00000* .58333 .000 -6.6956 -3.3044 intermediate audio
group
1.91667* .58333 .021 .2210 3.6123
Note. *The mean difference is significant at the 0.05 level
Table 1 clearly indicates that there is a meaningful difference between the performance of all the groups (f (3, 44) = 74.136 and p=.000). This means that the utilization of visual input in testing listening comprehension produced a significant result. However, to find where the differences lie, the result of the Scheffe post hoc analysis must be discussed.
According to Table 2, the results of the comparison of the advanced groups indicated no significant differences between the audio and visual Groups (p=.999). Therefore, as the first research question is concerned, the results show no difference in the performance of the advanced groups. However, the comparison of the intermediate audio and video groups which was the focus of the second research question, revealed a significant difference in favor of the video group (p=.021). Therefore, the findings suggest that for intermediate language learners the visual input accompanied by aural input may exercise a positive effect. Moreover, the comparison across the proficiency levels shows that advanced video and audio groups both outperformed the two intermediate groups (p=.000). Besides, the Intermediate Video group was outperformed by Advanced Audio group (p=.000), suggesting that the visual support could not exercise a large effect on improvement of intermediate video group.
4. Discussion and conclusion
and video groups? Do those test-takers in the video condition score higher or lower than the test-takers in the audio-only condition?’, the overall test scores for the two groups presented no evidence supporting the idea that the treatment (the visual support of the video clips) resulted in the increased scores on the listening test. The test-takers who took the test in the video clip format did not achieve higher scores on the test than the group of test-takers who were presented with the audio-only version of the test.
The findings may be attributed to the fact that the participants in the advanced groups were enjoying a high level of language proficiency; therefore, their comprehension did not differ much when there was no visual mode available to them. As it was mentioned, gestures and facial cues play a positive role in comprehension of a listening text when the listener is lagging behind in comprehension (Sueyoshi & Hardison, 2005; Latifi, Tavakoli, & Dabbaghi, 2014). It is probable that the advanced listeners did not have much problem with the listening test in general to compensate for by such cues. Alternatively, the parts that they couldn't understand were too hard to understand; hence, the visual support wouldn't come in useful. This is to some extent in line with Coniam's (2001) findings.
The second research question, which addressed the intermediate listeners, holds that ‘there isn't any possible difference in the performance of intermediate audio and video groups. In other words, to what extent do intermediate test-takers in the video group score higher or lower than the test-takers in the audio-only group’?
To answer this question, the results of the independent sample t-test indicated that the intermediate video group scored significantly higher than the audio-only group on the test. The possible explanation for the findings of our second research question may be due to the fact that intermediate language learners utilized the supporting characteristics of the visual mode more. Being less proficient, the listeners possibly exploited the context to comprehend what they missed by the audio mode only. This is in line with Brown (2000) stating that the more proficient the learners get, the less the use of compensatory strategies would be. One of the reasons of the significant difference between the performances of the intermediate groups and no significant difference between the performances of the advanced groups may be attributed to this fact. This can be in agreement with Wanger (2010) who supported the listening test tasks which use visual mode as well.
Some may argue that the characteristics of the visual mode such as facial cues and gestures, which helped the intermediate participants, are not related to listening comprehension ability, and this poses a threat to the construct validity of the listening tests. However, as Bachman and Palmer (2002) assert, the framework of language task characteristics must include all factors that contribute to the task accomplishment and its purpose. Therefore, it can be argued that facial cues and gesture are the features that a native speaker relies on to get their message conveyed. As a result, it is part of the construct of the task.
All in all, the present study supports the integration of visual listening texts in testing the listening ability of foreign or second language learners. Besides, it is worth mentioning that more studies are required to cast light on the issue of the inclusion of visual mode in testing listening comprehension. Further researches are necessary to investigate the effect of visual mode on the comprehension of different proficiency-level listeners. Moreover, the limited number of participants in the present study can limit the generalizability of the findings which must be taken into account in future studies.
5. Pedagogical Implications
5.1 Implications for EFL Teachers
visual clues provided. Learners should also be taught how to systematically question and double-check their comprehension through the use of context which includes visual support.
This can be achieved by incorporating the new technological advances in classes and using movies as a part of everyday classes for every level. However, the kind of task we expect from them must differ according to learners' proficiency level. If implemented in the classroom context, the visual support will find its way to the language testing system, and will be of benefit to the students who sit hard listening tests.
5.2 Implications for EFL Learners
It is suggested that learners use the context reinforcement to help improve their process of listening comprehension while siting a test. Visual clues which are an inseparable part of real life listening activities should not be taken for granted by learners as it can help them compensate for the lack of verbal comprehension. As a result, it can be a good support for them during the listening comprehension assessment. In this way there will be a more accurate measurement of second language listeners' listening comprehension ability.
Acknowledgement - It is worth mentioning that a shorter version of this paper has been published in Middle-East Journal of Scientific Research (issue 13), and the current research is an extended version.
6. References:
Bachman, L., & Palmer, A. (1996). Language testing in practice. Oxford: Oxford University Press.
Baltova, I. (1994). The impact of video on the comprehension skills of core French students. Canadian Modem Language Review,50, 507-523.
Bejar, I., Douglas, D., Jamieson, J., Nissan, S., & Turner, J. (2000). TOEFL 2000 listening framework: A working paper (TOEFL Monograph Series Report No. 19). Princeton, NJ: Educational Testing Service. Brett, P. (1997). A comparative study of the effects of the use of multimedia on listening comprehension. System,
25(1), 39-53. http://dx.doi.org/10.1016/S0346-251X(96)00059-0
Brown, H. D. (2000). Principles of language learning and teaching (4th ed.). New York: Addison Wesley Longman.
Buck, G. (2001). Assessing listening. Cambridge: Cambridge University Press. http://dx.doi.org/10.1017/CBO9780511732959
Coniam, D. (2001). The use of audio or video comprehension as an assessment instrument in the certification of English language teachers: A case study. System, 29, 1–14.
http://dx.doi.org/10.1016/S0346-251X(00)00057-9
Flowerdew, J., & L. Miller (2005). Second language listening: Theory and practice. New York: Cambridge University Press.
Ginther, A. (2002). Context and content visuals and performance on listening comprehension stimuli. Language Testing, 19, 133–167. http://dx.doi.org/10.1191/0265532202lt225oa
Latifi, M., Tavakoli, M., & Dabbaghi, A. (2014a). The effect of metacognitive instruction on improving listening comprehension ability of Intermediate EFL learners. International Journal of Research Studies in Language Learning, 3(6), 21-33. http://dx.doi.org/10.5861/ijrsll.2014.679
Latifi, M., Tavakoli, M., & Dabbaghi, A. (2014b). The effects of a self-regulatory approach on the listening comprehension achievement of EFL learners, International Journal of Research Studies in Education, 3(3), 67-78. http://dx.doi.org/10.5861/ijrse.2014.714
MacWilliam, I. (1986). Video and language comprehension. ELT Journal, 40, 131–135. http://dx.doi.org/10.1093/elt/40.2.131
Language Testing, 24, 517–537. http://dx.doi.org/10.1177/0265532207080771
Raffler-Engel, W. (1980). Kinesics and paralinguistics: A neglected factor in second language research and teaching. Canadian Modern Language Review, 36, 225–237.
Rost, M. (2002). Teaching and researching listening. London: Pearson Education.
Sueyoshi, A., & Hardison, D. (2005). The role of gestures and facial cues in second language listening
comprehension. Language Learning, 55, 661–699. http://dx.doi.org/10.1111/j.0023-8333.2005.00320.x Wagner, E. (2002). Video listening tests: A pilot study. Working Papers in TESOL & Applied Linguistics,
Teachers College, Columbia University, 2(1), 119-135.