in the population sciences published by the Max Planck Institute for Demographic Research Konrad-Zuse Str. 1, D-18057 Rostock · GERMANY www.demographic-research.org
DEMOGRAPHIC RESEARCH
VOLUME 20, ARTICLE 8, PAGES 129-168
PUBLISHED 17 FEBRUARY 2009
http://www.demographic-research.org/Volumes/Vol20/8/ DOI: 10.4054/DemRes.2009.20.8
Research Article
Mortality in Catalonia in the context of the
third, fourth and future phases of the
epidemiological transition theory
Jeroen Spijker
Amand Blanes Llorens
© 2009 Spijker & Blanes.
This open-access work is published under the terms of the Creative Commons Attribution NonCommercial License 2.0 Germany, which permits use, reproduction & distribution in any medium for non-commercial purposes, provided the original author(s) and source are given credit.
1 Introduction 130
2 Data and methods 135
3 Results 140
3.1 Life expectancy at birth, age 40 and 65 in Catalonia between 1960-61 and 2000-01
140
3.2 Changes in life expectancy at birth in Catalonia between 1960-61 and 2000-01, broken down by age
141
3.3 Cause-of-death contributions to the changes in life expectancy at birth in Catalonia between 1980-81 and 2000-01
143
3.4 Sex differences in life expectancy at birth by age and cause of death in Catalonia
145
3.5 Changes in life expectancy at birth in Catalonia between 1960-61 and 2000-01 within the national and international context
148
4 Discussion 153
5 Acknowledgements 161
References 162
Mortality in Catalonia in the context of the third, fourth
and future phases of the epidemiological transition theory
Jeroen Spijker 1
Amand Blanes Llorens 2
Abstract
In the period 1960-2000, male and female life expectancy in Spain’s Autonomous Region of Catalonia increased by 8.2 and 10.5 years, respectively, thus raising it to among one of the highest in the world. Initially, most gains were due to lower infant mortality, but as cardiovascular diseases declined, this later shifted to advanced ages. Between the mid-1980s and early 1990s life expectancy improvements stagnated as the mortality risk from traffic accidents and HIV/AIDS in young adults increased. Both the age-delay in old age mortality and the simultaneous influence of behavior and lifestyle reflect distinct aspects of the fourth stage of the epidemiological transition. This analysis quantifies the age and cause-of-death contributions to changes and sex-differences in life expectancy in Catalonia. We then compare the most recent life table for women with the Duchene-Wunsch limited life table to estimate the potential gain in life expectancy if all deaths were aging-related and in which ages these improvements would fall.
1 Centre d’Estudis Demogràfics and the Department of Geography, Universitat Autònoma de Barcelona,
08193 Bellaterra (Barcelona), Spain. E-mail: [email protected].
2 Centre d’Estudis Demogràfics, Universitat Autònoma de Barcelona, 08193 Bellaterra (Barcelona), Spain.
1. Introduction
The decline of mortality constitutes one of the basic, perhaps most fundamental, aspects of demographic change in the 20th century. Its history shows a large heterogeneity between countries, with a variety of traditional models that have been defined in function of its timing, intensity, extent, and underlying causes. Catalonia is one of Spain’s Autonomous Regions, but with a larger population than for example Denmark, and is an example of the accelerated transition within the western model, as changes were similar but occurred over a shorter period of time (and later). During the last century, male and female life expectancy increased by 40 and 45 years, respectively, during which time Catalonia consistently enjoyed a higher life expectancy than Spain as a whole. While their current levels are among the highest in the world, the impact of HIV/AIDS and an increased number of motor vehicle accidents caused male life expectancy to actually drop in Catalonia during the second half of the 1980s. This did not occur in Spain as a whole, hence the accelerated mortality transition and the influence of behavior and lifestyle on the mortality trends of young adults merit studying Catalonia on its own.
The objective of this article is to describe and analyze mortality trends in Catalonia during the last four decades, starting with the beginning of the 1960s. At that time life expectancy at birth was still slightly lower than the average for the 15 Western European countries of the European Union (former EU15): 68.0 vs. 68.3 years for men and 72.8 vs. 73.8 years for women. Analysis is set within the conceptual framework of the epidemiological transition, whereby the evolution of Catalonian survival and mortality patterns is analyzed based on the features that define the last phases of the transition. Our study therefore links up well with similar studies on the evolution of Canadian mortality during the latter half of the 20th century (e.g. Bah and Rajulton 1991; Lussier et al. 2008). In order to attain our objective, life tables have been reconstructed, making it possible to analyze mortality by age and sex. First, the effects of changes in the age- and sex-specific mortality risk on the change in life expectancy over time are quantified. Subsequently, from 1980, causes of death are introduced. This permits a more detailed study of the characteristics of the current pattern of mortality in Catalonia, and can therefore be seen as an extension of recent research by Gómez-Redondo and Boe (2005) on the contributions of age and sex to changes in life expectancy at birth in Spain.
already begun the process of transition with the reduction in infectious and parasitic diseases, as improved hygienic and living conditions, medical advances, and public health measures especially benefitted infants, children, and women of reproductive age. Changes experienced during the so-called “age of receding pandemics” (second phase) formed the principal factor in the rise in average life expectancy from about 30 to 50 years. From the 1930s, chronic and degenerative diseases gradually replaced communicable diseases, forming a mortality pattern dominated by heart disease, strokes, and cancer (third phase). By the mid-20th century mortality rates at young and middle ages had fallen to very low levels, but as the relative reduction of mortality at old ages was modest, it led to the belief that the biological limit to life was being approached (Fries 1980).
Towards the end of the 1960s, however, some developed countries, including the United States, began to experience unexpected rapid declines in degenerative diseases. This new phenomenon was described by Olshansky and Ault (1986) as the “age of delayed degenerative diseases”. Its general characteristics are:
a) rapidly declining death rates that are mainly concentrated in advanced ages and occur at a similar pace for males and females;
b) the age distribution of deaths from degenerative causes is shifted progressively toward older ages; and
c) relatively rapid improvements in survival are concentrated among the population at advanced ages.
From another point of view, Rogers and Hackenberg (1987) considered the defining aspect of this new stage, coined the “hybristic” stage, to be the increasing influence of individual behaviors and lifestyles on mortality patterns. This owed to the adoption of risk behavior resulting from individuals’ overconfidence in their capabilities and belief that it would not affect their health – a feeling of invincibility. The authors emphasize the importance of various aspects differing from previous stages, including:
a) the interaction between infectious and chronic diseases;
b) the influence of social pathologies, particularly accidents, alcohol-related diseases, suicide and homicides;
c) the critical role of individual health-related behavior, both health-promoting (through more healthy lifestyles) and health-damaging (e.g. cigarette smoking); and
These two versions are complementary, reflecting different aspects of a new stage in the epidemiological transition, namely micro-level determinants such as the lifestyle and behavior of social groups and macro-level determinants, including public health measures and new medical technologies.
From a wider perspective, there are also those who argue that it was the successful fight against cardiovascular diseases, which essentially caused the new major advance in life expectancy since the end of the 1960s (Vallin and Meslé, 2005). Rather than interpreting this boost as a fourth “age” of Omran’s epidemiological theory, Vallin and Meslé see it as an entirely new process occurring in industrialized countries; after completing Omran’s initial three epidemiological transitions, which they consider to be the first of three “health transitions”. Their second stage, which is thus called the “cardiovascular revolution”, is based on a completely new approach to health; the success of which depends very much on society’s current capacity to fit in with it
(ibid:94). For us, however, Omran’s third stage, the “age of delayed degenerative diseases” by Olshansky and Ault (1986) and the “hybristic stage” by Rogers and Hackenberg (1987), addresses the age- and cause-of-death trend for Catalonia over the last 40 years in an interpretable context. Indeed, recently Salomon and Murray (2002) supported the notion of a fourth stage of the transition proposed by Olshansky and Ault (1986); their analysis of 58 countries for the years 1950-1998 corroborated that “the cause composition of mortality remained stable but deaths shifted to older ages”. Moreover, since the end of Omran’s third stage the health transition actually pays little attention to the age-delay of death, nor to the role of non-cardiovascular degenerative diseases or the rise and subsequent fall in mortality from social pathological causes, particularly accidents and AIDS. These, as we shall demonstrate, were responsible for both the mortality changes over time and gender differences observed in Catalonia. It should be acknowledged, though, that we only studied one western region, while the more general health transition may relate more to the historical development of epidemiological characteristics from an international, inter-regional, social, or gender inequality perspective. When applying this theory to a specific context one may also consider divergence-convergence sub-processes in mortality trends, overlapping stages and counter transitions, health determinants, and the interaction with the health care system (Frenk et al. 1991; Vallin and Meslé, 2005).
Finally, it should be mentioned why the authors consider that Catalonia deserves to be studied in its own right3. Although regional demographic trends in Spain have been marked by a process of convergence since the 1960s, in the context of the first and second demographic transitions (DT), the timing of most social and demographic transformations in Catalonia throughout the 20th century has generally been ahead of
the national mean. Successive declines in mortality and fertility occurred in Catalonia before most other Spanish regions (i.e. the first DT). In addition, until the 1960s, life expectancy was consistently higher and until the 1990s fertility was structurally lower there than the national average. Moreover, the decline in fertility after the baby boom occurred in Catalonia slightly before most other Spanish regions. Similar patterns can be observed for other socio-demographic phenomena associated with the second DT, such as the age at marriage, proportion of extramarital births, and divorce rate; all began to increase before and/or are higher in Catalonia than in Spain as a whole. A second reason is that immigration has had, historically, an exceptional weight in Catalonian demographic changes (including those related to mortality), while the Spanish state was not considered to be a receiving country until the late 1990s. Thirdly, there was a clear difference between Catalonia and the rest of Spain in terms of social and economic development during most of the 20th century, which, in turn, may have affected demographic behavior. For instance, while infant mortality was substantially lower in Catalonia throughout the last century, behavior-related causes of death such as cancer, liver cirrhosis, circulatory system diseases, and more recently HIV/AIDS, tended to be higher, particularly in the province of Barcelona (Blanes 2007). Instead of providing a detailed account of these differences, as this is not the object of our study, Table 1 provides a comparison of several of the aforementioned socio demographic and economic indicators for the period 1960-2007, between Catalonia and Spain.
Table 1: Trends of several socio demographic and economic indicators. Catalonia and Spain. 1960-2007
1960 1970 1980
CAT SPAIN CAT SPAIN CAT SPAIN
Data Source
TFR 2.23 2.76 2.71 2.88 1.90 2.22 1, 2
Average age at marriage (women)
24.22 25.09 22.92 23.84 23.77 24.15 1, 2
Divorces/100 marriages - - - - 19.91 a 11.68 a 2, 3, 4
% Births outside of marriage 1.85 b 2.29 b 1.39 c 1.36 c 6.03 3.93 2, 5 IMR (per 1000 live births) 23.28 b 36.45 b 14.33 c 19.82 c 10.29 12.34 5, 2
e0 Men 68.08 b 67.88 b 69.65 c 70.01 c 72.65 e 72.41 e 6, 2
e0 Women 72.87 b 72.39 b 75.03 c 75.45 c 78.54 e 78.56 e 6, 2
Net migration 719993 h -513463 h 259018 i 46663 i -53854 j -161742 j 7, 5 Disposable income (pesetas) 28027 20070 80189 64355 395760 m 336788 m 8
% Illiterate 7.45 13.48 7.07 9.82 5.50 m 7.04 m 7
% Agricultural sector 16.18 41.63 8.42 25.16 6.03 m 15.80 m 7
% Industrial sector 50.98 33.19 53.55 40.78 48.62 m 41.07 m 7
Houses without running water (%)
21.40 51.67 5.95 21.43 0.25 m 2.26 m 7
1990 2000 2007
CAT SPAIN CAT SPAIN CAT SPAIN Data Source
TFR 1.25 1.36 1.21 1.23 1.49 1.39 1, 2
Average age at marriage (women)
26.64 26.18 29.21 28.91 31.78 30.83 1, 2
Divorces/100 marriages 16.33 10.52 25.35 17.44 78.26 61.75 2, 3, 4
% Births outside of marriage 11.13 9.61 20.24 17.74 31.15 d 28.38 d 2, 5
IMR (per 1000 live births) 7.09 7.60 3.48 4.38 3.06 3.67 5, 2
e0 Men 73.64 f 73.49 f 76.34 g 76.13 g 77.21 76.96 6, 2
e0 Women 80.92 f 80.67 f 83.39 g 83.16 g 83.76 83.48 6, 2
Net Migration 272700 k 1481000 k 702452 l 4030033 l 7, 5
Disposable income (pesetas) 1224826 n 1024897 n 2140203 o 1789030 o 8
% Illiterate 2.47 n 3.54 n 2.33 o 2.57 o 7
% Agricultural sector 3.73 n 9.71 n 2.13 o 5.79 o 7
% Industrial sector 38.13 n 33.64 n 33.09 o 31.57 o 7
Houses without running water (%)
Table 1: (Continued) Notes
a. Data refer to 1982 as divorce has only been legal in Spain since 1981 (apart from a six-year period during the Second Republic between 1932 and 1938); b. 1960-1; c. 1970-1; d. 2006; e. 1980-1; f. 1990-1; g. 2000-1; h. 1961-70; i. 1971-80; j. 1981-90; k. 1991-2000; l. 2001-06; m 1981; n 1991; o 2001.
Data sources:
1. Cabré, A. (1999), El sistema catalá de reproducción. Barcelona: Proa.
2. Instituto Nacional de Estadística. Indicadores Demográficos Básicos. www.ine.es [accessed 23/10/2008].
3. Instituto Nacional de Estadística. Estadística de nulidades, separaciones y divorcios. www.ine.es [accessed 23/10/2008]. 4. Consejo General del Poder Judicial (various years), Memoria del Consejo General del Poder Judicial. Madrid: CGPJ. 5. Instituto Nacional de Estadística (various years). Movimiento Natural de la Población. Madrid: INE.
6. See Section 2 of this paper.
7. Instituto Nacional de Estadística (1969; 79), Censo de la población y de las viviendas en España según la inscripción realizada el 31 de diciembre de 1960; 1979. Madrid: Artes Graficas.
Instituto Nacional de Estadística (1985), Censo de la población de 1981. Madrid: Artes Graficas. Instituto Nacional de Estadística (1994) Censo de población y viviendas 1991. Madrid: Artes Graficas.
Instituto Nacional de Estadística (2004a). Censos de Población y Viviendas 2001. Resultados definitivos. www.ine.es. [accessed : 18-10 2007].
8. Alcaide Inchausti, J. (2003), Evolución económica de las regiones y provincias Españoles en el siglo XX. Madrid: BBVA.
2. Data and methods
The analysis of the epidemiological transition is partly limited and conditioned by the quality and quantity of available data. In spite of improvements in statistical information, changes in the concepts, definitions and classifications, as well as coverage problems, a series of preliminary operations is necessary in order to obtain a homogeneous series of mortality and population data by sex and single ages.
For the period until 1974, mortality data come from the publication Movimiento Natural de la Población (MNP) from the Spanish Statistics Office (INE, various years), while for the subsequent period death records have been directly obtained from the INE. The latter made it possible to perform specific tabulations from individual records. In 1975, two basic changes in the vital statistics were brought into effect. First, births, deaths, and marriages previously registered in the municipality where the event occurred switched to being registered in the municipality of residence. While previously only deaths registered in Catalonia were considered, from 1975 these were complemented by deaths of Catalan residents that occurred in other Autonomous Regions4. Secondly, until 1975 the MNP defined births in function of a legal criterion only considering live births as those surviving the first 24 hours, and those that did not
4
survive, as miscarriages. While this produced a small underestimation of both births and deaths, live births that did not survive the first day of life were added to other tables on births and infant deaths that were published by the MNP. Aside from these two data issues, the latter of which could be resolved, the age- and sex-specific deaths between 1960 and 1974 appear to be of good quality.
A more problematic aspect, however, is that, in spite of improved statistical bulletins and data processing in the late 1970s and early 1980s, there were deficiencies in MNP coverage. An INE survey (1987) revealed the under-registration of vital events and concluded that the problem was more important for deaths than for births, especially in 1983 when Spain as a whole recorded an under-registration of 4%, with substantial errors in adjacent years as well. One study conducted by the Centre d’Estudis Demogràfics showed that under-registration in Catalonia was highest, covered the longest period, and displayed large intra regional variability (Ajenjo and Blanes 1994). For reasons that are unknown, the biggest discrepancies occurred in the early 1980s where under-coverage was estimated to be between 10% and 12% of deaths and 7% and 10% of births. As this sub-registration caused an underestimation of the mortality risk in the early 1980s and produced a trend-break in the mortality indicators5, the number of deaths recorded in the MNP was re-estimated using the weights established by Ajenjo and Blanes. The authors considered the under-registration to be independent of sex and age and the proceeding cause of death. The re-estimation was done for the number of deaths between 1977 and 1984, and despite limitations in the employed procedure, the mortality indicators showed a more sustained and coherent trend during the 1970s and 1980s.6
5 This is affirmed when we consider a publication on regional differences in mortality in Spain by Valkonen
(2001). The author did not suspect the data coverage problems when he stated that Catalonia was “an interesting case”, because “male life expectancy increased very rapidly from 1969/72 to 1980 and was the highest in Spain in 1980, but Catalonia was the only region in which life expectancy decreased during the 1980s“.
6 Ajenjo and Blanes (1994) first re-estimated the number of deaths for each Catalan municipality with more
than 5000 inhabitants and the remaining population for each county before aggregating them to the Autonomous Region level. The corrected number of deaths of each unit is derived from its mortality ratio with Catalonia that was determined from an estimated ratio based on earlier and later time points when the vital statistics were considered reliable. An iterative procedure was applied until the corrected mortality ratio equaled the estimated one. From here the missing deaths could be estimated and be added to the published ones. Appendix Table 1 shows the number of deaths as published by the MNP, the new estimates, and the proportion of under-registered deaths.
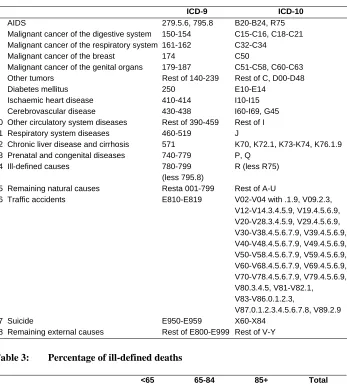
Until 1975, Spanish statistical sources did not provide cause-specific mortality data specified by age, sex, and region, except for the periods 1902-07 and 1931-40. This lack of information impedes the study of key aspects of the third phase of the epidemiological transition and limits analysis to the last two decades of the 20th century. For instance, we cannot conduct a detailed study on the stagnation in the trend of rising life expectancy that occurred in the 1960s after two decades of rapid post-war improvements. A preliminary analysis of 40 groups on causes of death isolated the most relevant ones in terms of total mortality and/or the largest impact on life expectancy: 15 specific groups, a category of ill-defined causes and rest-categories for both natural and external causes were eventually retained (Table 2). The study period coincides with the ninth and tenth revisions of the International Classification of Diseases (9, ICD-10), and homogeneity between the two classifications was optimized using an INE correspondence table (2005).
Table 2: Correspondence between ICD-9 and ICD-10
ICD-9 ICD-10
1 AIDS 279.5.6, 795.8 B20-B24, R75
2 Malignant cancer of the digestive system 150-154 C15-C16, C18-C21
3 Malignant cancer of the respiratory system 161-162 C32-C34
4 Malignant cancer of the breast 174 C50
5 Malignant cancer of the genital organs 179-187 C51-C58, C60-C63
6 Other tumors Rest of 140-239 Rest of C, D00-D48
7 Diabetes mellitus 250 E10-E14
8 Ischaemic heart disease 410-414 I10-I15
9 Cerebrovascular disease 430-438 I60-I69, G45
10 Other circulatory system diseases Rest of 390-459 Rest of I
11 Respiratory system diseases 460-519 J
12 Chronic liver disease and cirrhosis 571 K70, K72.1, K73-K74, K76.1.9
13 Prenatal and congenital diseases 740-779 P, Q
14 Ill-defined causes 780-799
(less 795.8)
R (less R75)
15 Remaining natural causes Resta 001-799 Rest of A-U
16 Traffic accidents E810-E819 V02-V04 with .1.9, V09.2.3,
V12-V14.3.4.5.9, V19.4.5.6.9, V20-V28.3.4.5.9, V29.4.5.6.9, V30-V38.4.5.6.7.9, V39.4.5.6.9, V40-V48.4.5.6.7.9, V49.4.5.6.9, V50-V58.4.5.6.7.9, V59.4.5.6.9, V60-V68.4.5.6.7.9, V69.4.5.6.9, V70-V78.4.5.6.7.9, V79.4.5.6.9, V80.3.4.5, V81-V82.1, V83-V86.0.1.2.3,
V87.0.1.2.3.4.5.6.7.8, V89.2.9
17 Suicide E950-E959 X60-X84
18 Remaining external causes Rest of E800-E999 Rest of V-Y
Table 3: Percentage of ill-defined deaths
<65 65-84 85+ Total
1980-1981 Catalonia 2.3% 2.6% 6.8% 3.2%
Rest of Spain 3.7% 5.2% 14.1% 6.2%
2000-2001 Catalonia 2.4% 1.4% 3.5% 2.2%
Rest of Spain 2.6% 1.7% 5.0% 2.9%
The 1960 to 2001 Censuses were used to estimate the population on January 1 of each corresponding year, with corrections for those under 5 years of age7, and served as a pivot to estimate the intercensal populations. In the calculations, births and deaths by cohort8 were employed, for which migration data from the Estadística de Variacions Residencials (INE, various years) were also incorporated after 1991. The populations on January 1, 2002 and 2003 are post censal estimates.9
Life tables were constructed for single ages until the age of 85, using deaths over two years as the numerator and the period-average population as the denominator. Up to 1979 the transformation to probability rates is based on the uniform distribution of deaths at each single-age interval. Starting in 1980 it is based on the corresponding fraction of the years lived for the deaths at each age, calculated from individual death registers. To estimate the probability of death in the first year of life, the tables of day-, week-, and month-specific infant deaths have also been used.
To assess the effect of changes in the mortality pattern on the average life expectancy of the population, the method by Pollard (1988) has been used. This permits analysis of the differences in life expectancy both cross-sectionally and over time, in function of changes or differences in the structure of mortality by age and cause. For example, what has been the effect of the reduction in infant mortality on the gain in life expectancy? Or, which impact has a particular cause of death on the differences in life expectancy between men and women? The result is a double-entry decomposition life table where one margin shows the effect of mortality by age and the other by cause of death, with the cells in the middle showing the effect of each cause at each age. The results are presented in large age groups reflecting diverse phases of the life cycle and subject to different conditions and risk factors.
7
Until the 1981 census, the population aged 0-4 was estimated using births of the prior five-year period and the corresponding deaths by age and cohort, under the assumption that there was no net migration in these ages. For the more recent years (1991 and 2001) the effect of migration was considered, for which the Estadística de Variaciones Residenciales (INE, various years) was used.
8 Up to 1975 no vital events could be obtained that adhered to the triple classification year-age-cohort.
Instead, the age-specific deaths have been disaggregated by generation, taking into account an estimation of the actual flow of each of the two generations that includes single ages.
9 Data from the municipal population register (Padrons Municipals d’Habitants) of 1975, 1986 and 1996, and
3. Results
3.1 Life expectancy at birth, age 40 and 65 in Catalonia between 1960-61 and 2000-01
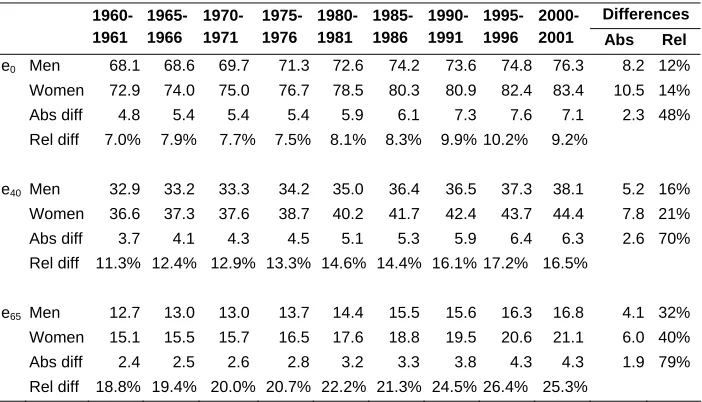
In the last 40 years, life expectancy at birth increased by 8.2 years among men and 10.5 years among women (Table 4). Significant improvements were made in each decade, though greatest advances were observed in the 1970s and first half of the ‘80s, when life expectancy increased annually by an average of 0.30 years for men and 0.35 years for women. This resulted from both the continued reduction in the mortality risk in the first years of life and the start of the mortality decline at middle and older ages. Among men this trend came to a sudden halt during the second half of the 1980s where life expectancy at birth dropped 0.6 years. This was partly due to an increase in adverse behavior among young adults. Earlier declines in the mortality rate among middle and advanced ages also stagnated, as gains in life expectancy at ages 40 and 65 did not exceed 0.1 years during this five-year period.10 With regard to the female population, the same period was characterized by a slowed increase in life expectancy rather than a reversal; in contrast with earlier improvements of 1.5-1.8 years per quinquennium, it still managed to rise 0.7 years, while life expectancy at higher ages increased at only a slightly slower pace than before.
In the 1990s, the pace of improvement in life expectancy at birth recovered, increasing at annual averages of 0.28 and 0.26 years among men and women, respectively, though it appears that improvement in life expectancy at older ages slowed. For instance, male and female life expectancy at age 65 increased just 0.5 years during the second half of the 1990s, while the five-year average between 1970-71 and 1995-96 was 0.7 years for men and 1 year for women11.
Below follows a more detailed description of the age- and cause-of-death components of the changes in mortality, changing sex differences and a comparison between Catalonia, the rest of Spain, and several other countries.
10 In fact, when considering the age-standardized mortality rates in five-year age groups and single years for
the population aged 40 and over we see that between 1985 and 1990 all age groups either observed a slight increase in mortality or stagnation in the downward trend.
11 As demonstrated by Appendix Table 2, this happens while mortality rates among 65-84 year-olds continue
Table 4: Evolution of life expectancy at different ages. Catalonia
Differences
1960-1961 1965-1966
1970-1971
1975-1976
1980-1981
1985-1986
1990-1991
1995-1996
2000-2001 Abs Rel
e0 Men 68.1 68.6 69.7 71.3 72.6 74.2 73.6 74.8 76.3 8.2 12%
Women 72.9 74.0 75.0 76.7 78.5 80.3 80.9 82.4 83.4 10.5 14%
Abs diff 4.8 5.4 5.4 5.4 5.9 6.1 7.3 7.6 7.1 2.3 48%
Rel diff 7.0% 7.9% 7.7% 7.5% 8.1% 8.3% 9.9% 10.2% 9.2%
e40 Men 32.9 33.2 33.3 34.2 35.0 36.4 36.5 37.3 38.1 5.2 16%
Women 36.6 37.3 37.6 38.7 40.2 41.7 42.4 43.7 44.4 7.8 21%
Abs diff 3.7 4.1 4.3 4.5 5.1 5.3 5.9 6.4 6.3 2.6 70%
Rel diff 11.3% 12.4% 12.9% 13.3% 14.6% 14.4% 16.1% 17.2% 16.5%
e65 Men 12.7 13.0 13.0 13.7 14.4 15.5 15.6 16.3 16.8 4.1 32%
Women 15.1 15.5 15.7 16.5 17.6 18.8 19.5 20.6 21.1 6.0 40%
Abs diff 2.4 2.5 2.6 2.8 3.2 3.3 3.8 4.3 4.3 1.9 79%
Rel diff 18.8% 19.4% 20.0% 20.7% 22.2% 21.3% 24.5% 26.4% 25.3%
Data source: see Section 2; Authors’ calculations.
3.2 Changes in life expectancy at birth in Catalonia between 1960-61 and 2000-01, broken down by age
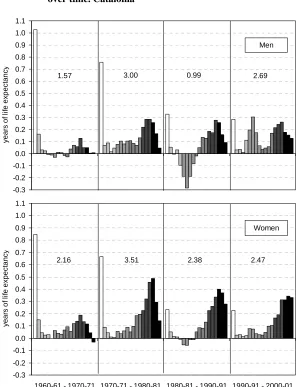
Figure 1: Contribution of age groups to the change in life expectancy over time. Catalonia
-0.3 -0.2 -0.1 0.0 0.1 0.2 0.3 0.4 0.5 0.6 0.7 0.8 0.9 1.0 1.1 y ea rs of l if e ex pec ta nc y Men
1.57 3.00 0.99 2.69
-0.3 -0.2 -0.1 0.0 0.1 0.2 0.3 0.4 0.5 0.6 0.7 0.8 0.9 1.0 1.1 196061 -1970-71 197071 -1980-81 198081 -1990-91 199091 -2000-01 y e ar s o f l if e ex pe c tan c y
0 1-19 20-39 40-59 60-74 75+
-0.3 -0.2 -0.1 0.0 0.1 0.2 0.3 0.4 0.5 0.6 0.7 0.8 0.9 1.0 1.1
1960-61 - 1970-71 1970-71 - 1980-81 1980-81 - 1990-91 1990-91 - 2000-01
y e ar s of l if e ex p ec tan c y Women
2.16 3.51 2.38 2.47
The 1960s still showed a pattern of improvement in life expectancy that is typical of the third stage of the epidemiological transition. The decline in infant mortality contributed about 1 year of the 1.57-year increase among males and 0.85 years of the 2.16-year increase among females, and improved survival among 1-4 year-olds contributed 0.15 years in both sexes. There were also significant mortality declines among middle-aged women, but few outstanding improvements in their male counterparts, while neither experienced substantial improvements in survival among the elderly. We mark the 1970s as the beginning of the fourth stage of the epidemiological transition, because even though infant mortality continued to be important, changes in survival rates among the elderly (60+) began to have a larger contribution to the increase in life expectancy. This period also highlighted the beginning of the decline in male adult mortality, which had occurred among women a decade earlier. As a result of significant gains that were made in different life phases, this decade observed the largest increase in life expectancy at birth in the period under study: 2.9 years for men and 3.5 years for women.
In the two last decades of the 20th century the characteristics of the fourth stage of the epidemiological transition definitely took hold, as the improvements were concentrated at progressively higher ages. This is best observed for women, who showed a clear age displacement in life expectancy gains. In the 1970s the main improvements were made from the age of 50, in the 1980s from the age of 60, and in the 1990s from the age of 70, thus increasing the weight of the most advanced ages over time. In the last decade, each 5-year age group from the age of 70 contributed equally to the improvement in life expectancy at birth, which amounted to half of the total for all ages. With regard to men, there was also clear evidence of the so-called “hybristic” stage in this period, in particular during the 1980s and early 1990s, when losses in life expectancy were observed in the younger adult population mainly due to an increase in behavior-related causes of death (see below). By the end of the 1990s, mortality rates among these age groups had recuperated their levels from 1980.
3.3 Cause-of-death contributions to the changes in life expectancy at birth in Catalonia between 1980-81 and 2000-01
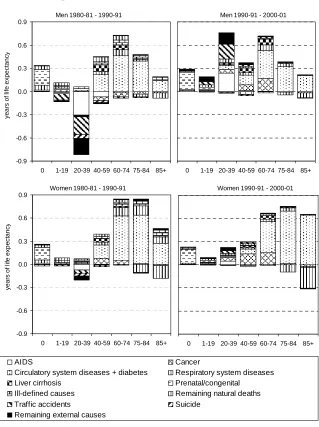
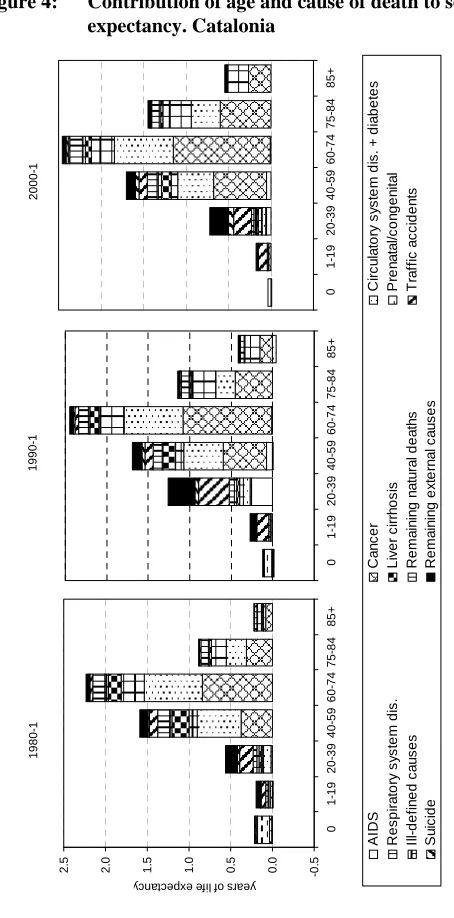
expectancy, especially among 15-19 year-olds, had been recuperated by the year 2000-01. A similar pattern was observed for men aged 20-39, although they additionally experienced first rising and then falling levels of mortality from HIV/AIDS. Women followed a comparable trend, though with less pronounced changes.12 Among ages 40-59 in the 1980s, the largest gain in life expectancy came from circulatory system diseases (especially ischaemic heart disease and cerebrovascular disease), while cancer became a more important contributor in the 1990s13. In addition, in the 1980s, HIV/AIDS played a small negative and cirrhosis of the liver a small positive role in the improvement of male life expectancy.
As mentioned earlier, an important part of the improvement in life expectancy during the last two decades came from the reduction in mortality from the population aged 60 and over. If we consider the causes of death responsible for this decline, we observe that by far the largest share came from the decline in circulatory system diseases, with respiratory system diseases, cancer and remaining natural causes making minor contributions. Cancer’s contribution to the increase in life expectancy has been most evident since the 1990s, mainly coming from middle and early old ages (40-74). This is possibly explained as the result of improved diagnostic methods and medical treatment. In the 1980s cancer still contributed a net loss among men, mainly due to smoking-related types. The smoking epidemic has yet to cause a substantial effect on female life expectancy, as they were later than men to start smoking in large numbers. When this does occur, it is yet unclear if the negative effect of smoking will instigate an overall increase in cancer deaths.
By the year 2000-01, circulatory system disease mortality had already reached very low levels among the middle-aged population, and so contributions to improved life expectancy from this cause of death now emanate from the elderly population. Between 1980-81 and 2000-01 circulatory system disease mortality was reduced by half, for both men and women aged 75 and over, contributing more to the improvement in life expectancy than the total net increase. The 75+ age group gained an additional 1.06 years from lower circulatory system diseases, while the net gain from all causes
12
In terms of the standardized death rate of traffic accident mortality in Catalonia, it rose from 22.5/5.9 deaths per population of 100,000 for men/women aged 20-39 in 1980-81 to 25.9/6.4 in 2000-01, with a peak of 45.6/9.8 deaths occurring in 1990-91. With regard to HIV/AIDS mortality, levels rose from no deaths in 1980-81 to 36,5/7.3 per 100,000 in 1990-91, peaking in 1995/96 with 64.4/17.9 deaths before declining to 9.5/3.2 deaths in 2000-01.
13
was just 0.97 years. The figures for women were, respectively, 2.22 and 2.02 years for the same period.
Figure 2 also shows that a part of the gains were obscured by a substantial increase in the category “remaining natural causes of death”. These diseases which include mental disorders (ICD-10 F00-F99) and nervous system diseases (ICD-10 G00-H95, excl. G45) are, in fact, related to the aging process. The population most affected by these diseases, women aged 85+, represented just 1% of total mortality in 1980-81, but by the year 2000-01 this had increased to 15%.14 Part of the increase is likely due to an improvement in cause-of-death registration given the decline in the proportion of deaths from ill-defined causes in the 1980s. Also important is the process of aging within the old-age population as they are cured of or less subjected to the risk factors of other diseases.
3.4 Sex differences in life expectancy at birth by age and cause of death in Catalonia
As noted in Table 4, average sex differences in life expectancy increased by 2.3 years, from 4.8 years in 1960-61 to 7.1 in 2000-01, with a maximum of 7.6 years recorded during the mid-1990s. Today, the sex difference in mortality is most accentuated at ages where female rates are very low, due both to high rates of reduction and to the progressive concentration of mortality at older ages. In the course of the four decades, inequalities in life expectancy at birth increased by 48%, but by 70% at age 45 and 79% at age 65.
Looking at the contribution of specific age groups (Figure 3), a number of important changes have taken place. The decline in infant mortality has reduced the male-female difference by more than half a year, especially during the first two decades, to a point where this age group plays almost no part. Age groups 1-19 showed few sex differences throughout the period, with the exception of late adolescents (15-19 years) during the 1980s. During this time the increase in excess male mortality provoked a doubling in this group’s contribution to the sex difference to 0.20 years. A similar pattern was observed among young adults (20-39 years), as their contribution to sex differences increased from 0.59 years in 1980-81 to 1.26 years in 1990-91, i.e. almost half of the 1.39-year increase in sex differences that was recorded in this decade.
14 In absolute terms, the combined mortality rate for women aged 85 and over of mental disorders and
Figure 2: Contribution of age and cause of death to the variation in life expectancy at birth. Catalonia
Men 1990-91 - 2000-01
0 1-19 20-39 40-59 60-74 75-84 85+
Men 1980-81 - 1990-91
-0.9 -0.6 -0.3 0.0 0.3 0.6 0.9
0 1-19 20-39 40-59 60-74 75-84 85+
y e ar s of l if e ex p ec tanc y
Men 1980-1 - 1990-1
-0.9 -0.6 -0.30.0 0.3 0.6 0.9
0 1-19
20-39 40-59 60-74 75-84 85+ AIDS Cancer
Circulatory system diseases + diabetes Respiratory system diseases
Liver cirrhosis Prenatal/congenital
Ill-defined causes Remaining natural deaths
Traffic accidents Suicide
Remaining external causes
Women 1980-81 - 1990-91
-0.9 -0.6 -0.3 0.0 0.3 0.6 0.9
0 1-19 20-39 40-59 60-74 75-84 85+
y e ar s of l if e e x pe c ta nc y
Women 1990-91 - 2000-01
0 1-19 20-39 40-59 60-74 75-84 85+
Figure 3: Contribution of age to sex differences in life expectancy. Catalonia
0.0 0.1 0.2 0.3 0.4 0.5 0.6 0.7 0.8 0.9
1960-61 1970-71 1980-81 1990-91 2000-01
year
s
of
l
if
e ex
p
ec
tanc
y
0 1-19 20-39 40-59 60-74 75+
0.0 0.1 0.2 0.3 0.4 0.5 0.6 0.7 0.8 0.9
1960-61 1970-71 1980-81 1990-91 2000-01
y
e
ar
s of
l
if
e expect
a
nc
y
4.79 5.38 5.89 7.28 7.06
Data source: see Section 2; Authors’ calculations.
By the year 2000-01, sex differences in mortality among late adolescents and young adults had declined again to slightly above the 1980-81 level. Ages 40-59 were responsible for about a quarter of the total sex difference in life expectancy throughout the whole period, and thus closely followed the overall trend. In absolute terms, this amounted to 1.09 years in 1960-61, increasing to 1.67 years in 1990-91, after which time it stabilized (the difference in 2000-01 was 1.70 years). A similar pattern was observed for ages 60-74, contributing 1.72 years in 1960-61 (36% of the total), 2.45 years in 1990-91 (34% of the total) and 2.44 years in 2000-01 (35% of the total) to the total sex difference. As mentioned earlier, sex differences have concentrated increasingly more in the most advanced ages: while the contribution of age group 75+ was just 0.75 years in 1960-61 (14% of the total), by 1990-91 this had increased to 1.53 years (21% of the total) and 2.01 years in 2000-01 (28% of the total).
observation period sex differences in infant mortality have almost disappeared. On the other hand, external causes of death were the most important discriminatory factor for children and young adults (ages 1-39) during the last two decades (especially traffic accidents), while AIDS could be added for the period around 1990 for the 20-39 age group. For middle and older ages (40+), the causes of death explaining the majority of sex differences were cancer, with breast cancer contributing negatively, circulatory system diseases (mainly ischaemic heart disease) up to age 75, and respiratory system diseases from ages 60+. Minor contributions came from traffic accidents and liver cirrhosis for ages 40-64.
3.5 Changes in life expectancy at birth in Catalonia between 1960-61 and 2000-01 within the national and international context
Figure 4: Contribution of age and cause of death to sex differences in life
expectancy. Catalonia
Figure 5: Trend in life expectancy at birth in Catalonia, the rest of Spain, EU15, Sweden and Japan
Dones 70 71 72 73 74 75 76 77 78 79 80 81 82 83 84 85 86 1960-61 1965-66 1970-71 1975-76 1980-81 1985-86 1990-91 1995-96 2000-01
Catalonia Spain excl. Catalonia Sweden Japan EU-15
Men 65 66 67 68 69 70 71 72 73 74 75 76 77 78 1960-61 1965-66 1970-71 1975-76 1980-81 1985-86 1990-91 1995-96 2000-01 Li fe ex pec tanc y a t bi rt h Women 70 71 72 73 74 75 76 77 78 79 80 81 82 83 84 85 86 1960-61 1965-66 1970-71 1975-76 1980-81 1985-86 1990-91 1995-96 2000-01
Data sources: Catalonia, see Section 2; Spain, INE; Sweden, Japan and the former EU15, WHO Mortality Database (www.who.int). Authors’ calculations.
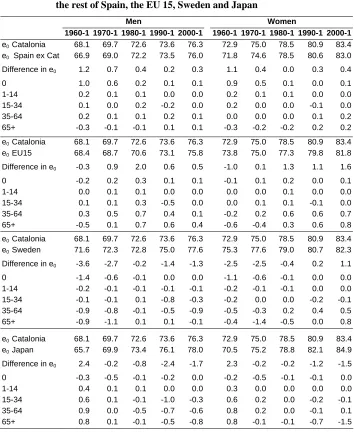
even observed a 2.5-year lower life expectancy at birth than Sweden, by 1990-91 Catalan women enjoyed a 1.1-year higher life expectancy than the EU15 and displayed a small advantage over Sweden, a country that for many years led the trend in life expectancy in Europe (Oeppen and Vaupel 2002). Although 10 years later these gaps had increased to +1.6 and +1.1 years, respectively, Catalan women still lagged 1.5 years behind the world leader, Japan, which had shown even faster improvements.
Regarding age contributions, Catalonia performed better than the rest of Spain in infant mortality, but still lagged behind most western and northern European countries. Sweden, for instance, already observed a rate of 16 deaths per 1000 live births in 1960-61, i.e. slightly less than half that in Catalonia (this difference contributed more than one year to the higher Swedish life expectancy). However, in Catalonia (and in the rest of Spain) the decline in infant mortality intensified during the 1960s and 1970s. This emanated from a combination of social and economic factors: information began to be disseminated both formally (in hospitals) and informally (through women’s movements) to mothers on infant health; medical knowledge improved; and a system of maternity care was gradually introduced in the larger cities. As a result, in the beginning of the 1980s Catalonia had an infant mortality rate that was already lower than most of Western Europe, though still higher than that of Scandinavia or Japan. More recently, the extension of prenatal care, pediatric services, and scientific advances have increased the probability of survival in the first days of life and decreased infant mortality to a rate of 3.5 per 1000, i.e. one of the lowest in the EU15. This age group has thus lost its importance in the analysis of age-specific contributions to differences in life expectancy between countries with low mortality.
Table 5: Difference in life expectancy at birth by age between Catalonia and the rest of Spain, the EU 15, Sweden and Japan
Men Women
1960-1 1970-1 1980-1 1990-1 2000-1 1960-1 1970-1 1980-1 1990-1 2000-1
e0 Catalonia 68.1 69.7 72.6 73.6 76.3 72.9 75.0 78.5 80.9 83.4
e0 Spain ex Cat 66.9 69.0 72.2 73.5 76.0 71.8 74.6 78.5 80.6 83.0
Difference in e0 1.2 0.7 0.4 0.2 0.3 1.1 0.4 0.0 0.3 0.4
0 1.0 0.6 0.2 0.1 0.1 0.9 0.5 0.1 0.0 0.1
1-14 0.2 0.1 0.1 0.0 0.0 0.2 0.1 0.1 0.0 0.0
15-34 0.1 0.0 0.2 -0.2 0.0 0.2 0.0 0.0 -0.1 0.0
35-64 0.2 0.1 0.1 0.2 0.1 0.0 0.0 0.0 0.1 0.2
65+ -0.3 -0.1 -0.1 0.1 0.1 -0.3 -0.2 -0.2 0.2 0.2
e0 Catalonia 68.1 69.7 72.6 73.6 76.3 72.9 75.0 78.5 80.9 83.4
e0 EU15 68.4 68.7 70.6 73.1 75.8 73.8 75.0 77.3 79.8 81.8
Difference in e0 -0.3 0.9 2.0 0.6 0.5 -1.0 0.1 1.3 1.1 1.6
0 -0.2 0.2 0.3 0.1 0.1 -0.1 0.1 0.2 0.0 0.1
1-14 0.0 0.1 0.1 0.0 0.0 0.0 0.0 0.1 0.0 0.0
15-34 0.1 0.1 0.3 -0.5 0.0 0.0 0.1 0.1 -0.1 0.0
35-64 0.3 0.5 0.7 0.4 0.1 -0.2 0.2 0.6 0.6 0.7
65+ -0.5 0.1 0.7 0.6 0.4 -0.6 -0.4 0.3 0.6 0.8
e0 Catalonia 68.1 69.7 72.6 73.6 76.3 72.9 75.0 78.5 80.9 83.4
e0 Sweden 71.6 72.3 72.8 75.0 77.6 75.3 77.6 79.0 80.7 82.3
Difference in e0 -3.6 -2.7 -0.2 -1.4 -1.3 -2.5 -2.5 -0.4 0.2 1.1
0 -1.4 -0.6 -0.1 0.0 0.0 -1.1 -0.6 -0.1 0.0 0.0
1-14 -0.2 -0.1 -0.1 -0.1 -0.1 -0.2 -0.1 -0.1 0.0 0.0
15-34 -0.1 -0.1 0.1 -0.8 -0.3 -0.2 0.0 0.0 -0.2 -0.1
35-64 -0.9 -0.8 -0.1 -0.5 -0.9 -0.5 -0.3 0.2 0.4 0.5
65+ -0.9 -1.1 0.1 0.1 -0.1 -0.4 -1.4 -0.5 0.0 0.8
e0 Catalonia 68.1 69.7 72.6 73.6 76.3 72.9 75.0 78.5 80.9 83.4
e0 Japan 65.7 69.9 73.4 76.1 78.0 70.5 75.2 78.8 82.1 84.9
Difference in e0 2.4 -0.2 -0.8 -2.4 -1.7 2.3 -0.2 -0.2 -1.2 -1.5
0 -0.3 -0.5 -0.1 -0.2 0.0 -0.2 -0.5 -0.1 -0.1 0.0
1-14 0.4 0.1 0.1 0.0 0.0 0.3 0.0 0.0 0.0 0.0
15-34 0.6 0.1 -0.1 -1.0 -0.3 0.6 0.2 0.0 -0.2 -0.1
35-64 0.9 0.0 -0.5 -0.7 -0.6 0.8 0.2 0.0 -0.1 0.1
65+ 0.8 0.1 -0.1 -0.5 -0.8 0.8 -0.1 -0.1 -0.7 -1.5
Most international differences, however, are found among age groups 35-64 and 65+. In comparison with the EU15, Catalan middle-aged men observed lower mortality levels throughout the four decades, as have the elderly since 1970-71. In 1980-81 contributions were equal for both age groups (+0.7 years), but today total differences are much less and mainly come from the oldest age group (+0.1 and +0.4 years, respectively). Among women, mortality within these age groups has been lower than the EU15 average only since 1980-81. In 2000-01 these two age categories contributed more to overall life expectancy differences than that established for men: +0.7 years for the middle-aged and +0.8 years for the elderly population. With regard to the difference with Sweden, middle- and old-age mortality was much less favorable in Catalonia both in 1960-61 and 1970-71, with an estimated total deficit in life expectancy of between one and two years for each sex. Regarding men, there were no longer substantial differences in 1980-81 (i.e. the life expectancy gap declined by 1.8 years in 10 years), but by 1990-91 mortality in the 35-64 age group was again higher, contributing half a year to the lower overall life expectancy. This increased to almost a year in 2000-01. At the same time, middle-aged female mortality has been consistently more favorable compared to Sweden since 1980-81, contributing 0.5 years in 2000-01. Moreover, the 65+ age group changed from contributing negatively (-0.5 years in 1980-81) to being the most important contributor to higher life expectancy in 2000-01 (+0.8 years). Finally, comparing Catalonia with Japan, we observe that while the life expectancy differences from the two oldest age groups in 1960-61 were strongly in favor of Catalonia (about +1.6 years for both sexes), by 1970-71 these differences had evaporated. In 1980-81 the middle-aged male population was responsible for a half-year lower life expectancy. While the latter remained quite constant during the next two decades, negative contributions to the difference in life expectancy from the elderly male population increased from 0.1 to 0.8 years. Few mortality differences among Japanese and Catalan middle-aged women have been observed since 1970-71. On the other hand, differences among the retiree-age population increased from –0.1 years to – 1.5 years.
4. Discussion
fourth stage, such as the reduction in mortality at advanced ages. The net result was that this decade produced the largest increases in the life expectancy at birth during the last four decades, with men gaining 2.9 years and women 3.5 years. During the second half of the 1980s and early 1990s, there was a temporary break in the upward trend in life expectancy. This was due to an increase in adverse behavior among young adults and stagnation in the decline in the mortality rate among middle and advanced ages. Although the 1990s were typified by the return to rising life expectancy, the rate of increase in life expectancy slowed down, with men and women gaining 2.8 and 2.6 years, respectively, during this decade. It would seem, however, that even this rate of improvement would be difficult to maintain in the future. This is partly because a concentration of gains at progressively older ages lessens the effect that the reduction in the mortality rates has on life expectancy. As well, a large component of the increase in the average length of life during the 1990s came from the decline in behavior-related mortality among young (male) adults that had reached its peak in the early 1990s. Moreover, as the mortality rate among infants, children and adolescents is currently very low, there remains little room for improvement in these young age groups.15
The effect that certain habits and lifestyles have on the health of the population is clearly visible in the 1980s, with a substantial increase in excess mortality among young adults, particularly men. This period, that also includes the early 1990s, could therefore be considered the pinnacle of Rogers and Hackenberg’s “hybristic stage” in Catalonia. HIV/AIDS, traffic accidents, and to a lesser extent suicide, deducted 0.8 and 0.2 years, respectively, from male and female life expectancy between 1980 and 1990. However, a rise in homicide was not observed during this period, while lower liver cirrhosis mortality actually contributed positively to the change in life expectancy (+0.16 years in the case of men and +0.07 years in the case of women).
In response to the “epidemic” of traffic accidents, certain measures were adopted to eradicate risky behavior, such as speeding, alcohol consumption, while motorists were required to use safety belts and motorcyclists helmets. Public awareness campaigns and financial measures designed to renovate the car fleet and improve the road network were also undertaken. These measures caused a 43% reduction in traffic accident deaths among men and 34% among women, although this continues to be the
15 During the 40-year period, infant mortality among both sexes decreased by about 90% to a level of just 3.5
principal cause of death in 20-29 year-olds. HIV/AIDS prevention campaigns aided by better knowledge about transmission mechanisms and medical advances with new treatments have caused a decline in both new cases16 and reported deaths. Despite this recovery, individual behavior remains predisposed to certain risk factors during this stage of the life course. In this sense, there has not been significant progress: the present death rate among 20-39 year-olds is situated at a level similar to that of the beginning of the 1980s.
The defining aspect of this stage is the mortality decline among the adult and elderly population; a process that began in the 1970s and was consolidated during the last two decades. This reduction constitutes the main force behind the advances in life expectancy. Although the relative weight of older age groups increased in each of the last three decades, the mortality decline in the population above 70 contributed a similar amount to the increase in average lifespan each time, i.e. 0.75 years among men and 1.35 years among women. This was especially the case among women, where in the 1970s two-thirds of the total gain from the age of 70 was provided by the ages 70-79; this was reduced to less than half in the 1990s, displacing the bulk of improvements to even more advanced ages.
As a result, sex differences in life expectancy at advanced ages have progressively increased, suggesting that women find themselves in a more advanced stage of the epidemiological transition. As to why female health (in terms of life expectancy) at advanced ages has improved more than that for men, we have shown in this paper that fewer women die from behavior-related diseases. Aside from lifestyle differences, it is also known that women seek medical assistance sooner than men, even after controlling for sex-specific conditions such as pregnancy and childbearing (David and Kaplan 1995). This may of course be important for early diagnosis and subsequent effective disease treatment, but is counteracted by the fact that women are disadvantaged when it comes to in-hospital diagnostic and therapeutic interventions (see e.g. Martínez-Sellés et al. (2005)) in the event of acute inferior or posterior myocardial infarction.
The pattern of mortality by cause of death shows a displacement of degenerative diseases to more advanced ages. The reduction in circulatory system diseases has contributed to the increase in the life expectancy at birth by 2.34 years for men and 3.34 years for women in the last 20 years, placing it within the “cardiovascular revolution” that occurred in western countries (Vallin and Meslé 2001). Factors contributing to this are related to a series of new health technologies and practices including heart surgery, beta blocking and thrombolytic medicines, re-organization of emergency services, monitoring and treatment of hypercholesterolemia, new types of medicines, and the
16 According to the AIDS register of the Spanish Health Department the maximum number of registrations
reduction of smoking. The decline in circulatory system disease mortality modified the structure of mortality: there was a relative increase in the weight of cancer in the middle ages and a larger contribution from respiratory system diseases, mental disorders, and diseases of the nervous system in advanced ages.
The decline in mortality has become key in the recent population dynamics of western countries, as improved survival rates have been one factor in population aging. In 1960-61, 58% of Catalan women reached the age of 75, with a further 8.7 years of life remaining. Forty years later 83% survived to this age with an additional life expectancy of 12.9 years17. This is to say that these improvements produced both a significant increase in the number of survivals to advanced ages as well as in the number of years remaining to live.
While the difference in life expectancy at birth between Catalonia and the rest of Spain almost disappeared over the last four decades, the mortality advantage in Catalonia at older ages increased. While it is difficult to say why this is so without a detailed study of important mortality determinants (especially since smoking prevalence rates have been consistently higher in Catalonia than in Spain (confer, respectively, Fernandez et al. 1998 and WHO 2002), cause-specific analyses revealed that most observed differences were due to diabetes, circulatory, and respiratory system diseases (results not shown). One important factor deserving further exploration is the role of the so-called “healthy worker’s effect” on geographic mortality differences in Spain, as Catalonia received many migrants throughout the 20th century, mostly from other Spanish regions. In fact, in 1985-89 between half and three-quarters of the population aged 40-64 (depending on the exact 5-year age group) living in Catalonia were born elsewhere, particularly in Andalusia (Cabré 1999). Another possibly important factor is that health care appears to be more effective in Catalonia than in the rest of Spain; an analysis on medically avoidable deaths that we performed showed small but consistently lower rates (i.e. a standardized death ratio between Catalonia and Spain of 0.90 in 1980-81, 0.97 in 1990-91, and 0.93 in 2000-01).
Looking toward the future, the main interest centers on the development of those diseases that have dominated mortality at advanced ages, since their evolution determines future improvements of both the quantity and quality of life. In this sense, Horiuchi (1999) stated that advances in life expectancy are the products of reductions in successive causes of death. As we have seen, the last decades were dominated by the decline of circulatory system diseases at older ages. According to Horiuchi, the reduction in cancer between the ages 50 and 80 will be the main driving force during
17 Another way to establish the effect on the elderly contingent is to compare the 45000 female deaths at age
the next stage. Although some types of cancer, especially that of the stomach, have declined as a result of improved hygiene and medical technology, others associated with risk factors like smoking, alcohol or diet have increased, though this does not apply ubiquitously. Lung cancer is an example of how differences in behavior, in this case the consumption of tobacco, between different generations and between men and women can result in distinct disease trends. In the majority of western and northern European countries, male mortality rates present a time trend in the form of an inverted “U”, whereas they continue to augment among the female population, with some exceptions (e.g. the United Kingdom). In Catalonia, male rates have increased until very recently, reproducing a pattern of development similar to that of England & Wales, but with a 40-year delay. It appears that women are only at the beginning of the lung cancer epidemic (López-Abente et al. 2002). In the last decade the mortality development for all cancers in Catalonia only contributed 0.26 years to the improvement in the life expectancy at birth. As in other western countries, cancer reached its maximum impact in the beginning of the 1990s. The question that is raised is up to which point the downward trend in female cancer in Catalonia has slowed down as a result of the increase in tobacco-related cancers. For men, a more favorable development is predicted because they have already obtained maximum levels in the most important smoking-related cancers. Currently, between ages 35 and 74, 44% of male and 46% of female mortality is due to cancer, which implies that there still remains a potential improvement in the life expectancy. However, in order to attain this, individual behaviors associated with certain determinants of cancer need to be changed, and breakthroughs must take place in research on cancer mechanisms at the cellular and molecular levels.
If mortality rates from cardiovascular disease and cancer reach low levels, a mortality structure at older ages will emerge that is dominated by respiratory system diseases (especially pneumonia, bronchitis, and influenza), diseases of the mental and nervous systems, as well as ill-defined causes due to deaths from multiple factors or deaths without a clear manifestation of causes. Some of these changes are already taking place in Catalonia. While in 1990-91, 5% of male deaths and 6% of female deaths in the population aged 90 and over were due to mental disorders and diseases of the nervous system, ten years later these respective percentages were 10 and 15. The question thus arises whether it is possible to slow down the aging process to delay the age of death. According to Horiuchi (1999), this would constitute a new future phase called the “slowing of senescence”, whereby the mortality structure only contains aging-related causes, and deaths are displaced to very advanced ages.
demographers (Oeppen and Vaupel 2002). A classic work has been that of Olshansky, Carnes, and Cassel (1990), who quantified the reductions that would be necessary in certain causes of death in order to achieve significant increases in life expectancy. The elimination of circulatory system diseases, diabetes, and cancer from the age of 50 would elevate the average life span of the population in the United States to 90 years. In their opinion, this supposition was quite improbable with the existing medical technology, and it would therefore be difficult for life expectancy at birth to reach 85 years, or 35 years at the age of 50, without significant advances in the reduction of the aging process of the human organism. However, already in 2000 Japanese women had surpassed this supposed threshold, enjoying a life expectancy of 36 years at age 50 (and 84.6 years at birth). This has provoked a profound reworking of future hypotheses, as is for example evident by the projections of the United Nations who in their last revision calculated an estimated life expectancy at birth for Japan for the period 2045-2050 of 83.7 years for men and 92.5 years for women (United Nations 2005). For Spain, the UN projections for 2030 are 79.4 years for men and 86.4 years for women, while INE (2004b) predicts 80.9 and 86.9 years, respectively. Also for the year 2030, the Catalan statistical office foresees a life expectancy in Catalonia of 84.0 years for men and 88.2 years for women (IDESCAT 2004), i.e. a substantial reduction in the sex differences in life expectancy within a context of important improvements in the longevity of the population.
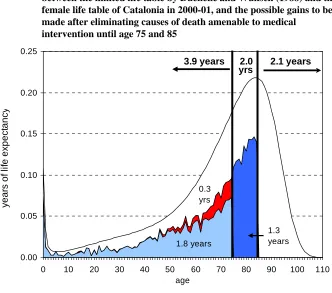
Figure 6: Age-contribution in years of life to the differences in life expectancy between the limited life table by Duchêne and Wunsch (1988) and the female life table of Catalonia in 2000-01, and the possible gains to be made after eliminating causes of death amenable to medical
intervention until age 75 and 85
0.00 0.05 0.10 0.15 0.20 0.25
0 10 20 30 40 50 60 70 80 90 100 110
age
y
ear
s of
l
if
e ex
p
ec
tanc
y
1.8 years 0.3 yrs
1.3 years
3.9 years 2.1 years
yrs 2.0
Note: The female life table for Catalonia of 2000-2001 has been adjusted by means of the third function of Heligman and Pollard (1980) that permits the exploration of the force of mortality at advanced ages; light blue: possible gains if mortality up to ages 75 is reduced from causes amenable to medical intervention; red: additional reduction up to ages 75 if the reduction in ischaemic heart disease is increased from 50% to 75%; dark blue: the maximum age of possible life expectancy gains is increased to 85 (see also Footnote 16)
Data source: see Section 2; Authors’ calculations.
and McKee 2003). If under an optimistic assumption these causes were eliminated18, female life expectancy in Catalonia would increase by 1.8 years to 85.2 years. Most of this gain would be attributed to middle and older ages, as the suppression of avoidable
18 Appendix Table 3 is the list of the specific causes of death considered avoidable causes or amenable to
causes between ages 0 and 49 would contribute just 0.7 years, while ages 50-74 would add the remaining amount. A large part of this gain would be due to the reduction of cancer and ischaemic heart disease. Given the current observed declines in mortality among the elderly, the maximum age of 75 appears too low to be the cut-off for potential for further increases in life expectancy as a result of new medical technologies and changes in behavior. We therefore repeated the exercise by increasing the maximum age to 85 and increasing the reduction in ischaemic heart disease from 50% to 75%. Results showed that Catalonian women would obtain a theoretical life expectancy of 86.8 years at birth and 37.6 years at age 50, adding in each case 1.6 years to the previous estimate, most of which would come from the 75-84 age group.
Nevertheless, we still fall about 1.5 years short of the proposed level of female life expectancy at birth in 2030 by the Catalan statistical office. Further decreases in the mortality rate would therefore have to come from the most advanced ages, meaning that current declines must be maintained or intensified and behavior-related mortality must be kept at an absolute minimum. However, it seems that oldest old mortality rates, easily influenced by temporary occurrences, have failed to show a substantial decline since the mid-1980s (see Figure 7). Perhaps more importantly, the health consequences of the diffusion of the smoking epidemic in Southern Europe are only just beginning to be observed (Schiaffino et al. 2003). We are therefore reluctant to believe that under the current situation, female life expectancy at birth will increase by more than two or three years in the next couple of decades.
Figure 7: Death rates of the oldest old in Catalonia between 1985-86 to 2001-02
0.05 0.10 0.15 0.20 0.25 0.30
1985-86 1990-91 1995-96 2000-01
a
ge-speci
fi
c
dea
th
r
a
te
(
m
-t
yp
e)
men, 80-84 men, 85-89 men, 90+
women, 80-84 women, 85-89 women, 90+
flu epidemic
Data source: see Section 2; Authors’ calculations.
5. Acknowledgements
References
Alcaide Inchausti, J. (2003). Evolución económica de las regiones y provincias Españoles en el siglo XX. Madrid: BBVA.
Ajenjo, M. and Blanes, A. (1994). “Estimació i correcció del subregistre del Movimient Natural de la Població al període 1975-1984”. Centre d’Estudis Demogràfics, Autonomous University of Barcelona. Internal memo.
Bah, S. and Rajulton, F. (1991). Has Canadian Mortality Entered the Fourth Stage of the Epidemiologic Transition? Canadian Studies in Population 18 (2): 18-41. Cabré, A. (1999). El sistema catalá de reproducción. Barcelona: Proa.
Consejo General del Poder Judicial (various years). Memoria del Consejo General del Poder Judicial. Madrid: CGPJ.
David, J. and Kaplan, H.B. (1995). Gender, social roles and health care utilization.
Applied Behavioral Science Review 3(1): 39-64.
doi:10.1016/S1068-8595(95)80012-3.
Departament de Sanitat i Seguretat Social (2000). Evolució de la mortalitat a Catalunya, 1983-1997. Barcelona: Departament de Sanitat i Seguretat Social.
Duchêne, J. and Wunsch, G. (1988). From the demographer's cauldron: single decrement life tables and the span of life. Genus 44 (3-4): 1-17.
Fernandez, E., Saltó, E. Pardell, H. Tresserras, R., Juncà, S., Segura, A., and Salleras, Ll. (1998). Smoking prevalence decreases in males but not in females: The case of Catalonia (Spain). European Journal of Epidemiology 14 (6): 629-30.
doi:10.1023/A:1007494220096.
Fries, J.F. (1980). Aging, natural death, and the compression of morbidity. New England Journal of Medicine 303 (3): 130-135.
Gómez-Redondo R. and Boe, C. (2005). Decomposition analysis of Spanish life expectancy at birth: Evolution and changes in the components by sex and age.
Demographic Research 13(20): 521-546.
http://www.demographic-research.org/volumes/vol13/20. doi:10.4054/DemRes.2005.13.20.
Heligman, L. and Pollard, J.N. (1980). The age pattern of mortality. Journal of the Institute of Actuaries 107: 49-80.
of the symposium on health and mortality. Brussels, 19-22 November, 1997, pp.54-71. Brussels: Centrum voor Bevolkings- en Gezinsstudiën/New York: UN Department of Economic and Social Affairs.
IDESCAT (Institut d'Estadística de Catalunya) (2004). Projeccions de Població de Catalunya (base 2002). Barcelona: IDESCAT.
INE (Instituto Nacional de Estadística) (various years). Movimiento Natural de la Población. Madrid: INE.
INE (Instituto Nacional de Estadística) (various years). Estadística de Variaciones Residenciales. Microdata files.
INE (Instituto Nacional de Estadística) (1969; 1979). Censo de la población y de las viviendas en España según la inscripción realizada el 31 de diciembre de 1960; 1979. Madrid: Artes Graficas.
INE (Instituto Nacional de Estadística) (1985). Censo de la población de 1981. Madrid: Artes Graficas.
INE (Instituto Nacional de Estadística) (1987). Informe sobre la encuesta de validación del Movimiento Natural de la Población. Madrid. Internal memo.
INE (Instituto Nacional de Estadística) (1994). Censo de población y viviendas 1991. Madrid: Artes Graficas.
INE (Instituto Nacional de Estadística) (2004a). Censos de Población y Viviendas 2001. Resultados definitivos. http://www.ine.es [accessed: 18/10/2007].
INE (Instituto Nacional de Estadística) (2004b). Proyección de la esperanza de vida al nacimiento. http://www.ine.es/daco/daco42/demogra/hipotesis.xls [accessed 23/10/2008].
INE (Instituto Nacional de Estadística) (2005). Equivalencia de la lista reducida de causas de muerte CIE-10 con la CIE-9. http://www.ine.es/daco/daco42/
sanitarias/listas_02.doc
INE (Instituto Nacional de Estadística). Indicadores Demográficos Básicos.
http://www.ine.es [accessed 23/10/2008].
INE (Instituto Nacional de Estadística). Estadística de nulidades, separaciones y divorcios. http://www.ine.es [accessed 23/10/2008].