ORIGINAL ARTICLE
Multicolor imaging in choroidal osteomas
Ramesh Venkatesh
1*, Bharathi Bavaharan
1, Naresh Kumar Yadav
1, Kumar Saurabh
2, Priya Srinivasan
1,
Padmalini Mahendradas
1, Vishma Prabhu
1and Rupak Roy
2Abstract
Background: To describe the multicolour (MC) imaging characteristics associated with choroidal osteomas (CO) and
their secondary complications.
Methods: Retrospective descriptive case series of eleven eyes of ten patients with CO. Findings of multicolour
imaging were correlated with visual acuity, clinical features, lesion characteristics and findings from other imaging modalities.
Results: Infrared reflectance (IR) images showed calcified CO lesions as hyporeflectance (dark) areas while decalcified
lesions were seen as iso reflectance (normal) areas. Overlying RPE atrophy on IR were seen as white areas. MC images showed color variations depending upon the reflectivity of the tumour material tumour and retinal pigment epithelial (RPE) atrophy. Green color was noted in calcified CO tumour while decalcified CO tumour showed no color change. RPE atrophy were seen as bright orange areas. Green and blue reflectance images were not able to pick the choroidal osteoma lesion. Other changes secondary to CO like presence of choroidal neovascular membrane, hemorrhage and/ or fluid in the retinal layers were identified on green and blue reflectance images.
Conclusion: MC imaging is a useful tool in our arsenal of existing imaging modalities in the assessment of CO and its
secondary changes. Change in reflectance of the IR and MC images can be used as an indicator to assess the extent of tumour decalcification and its secondary changes and therefore, can aid in prognostication in the same. It has the potential to replace color fundus photography in documentation and follow up of patients with CO.
Keywords: Choroidal osteoma, Multicolour, Imaging, Optical coherence tomography, Fundus autofluoroscence
© The Author(s) 2018. This article is distributed under the terms of the Creative Commons Attribution 4.0 International License (http://creat iveco mmons .org/licen ses/by/4.0/), which permits unrestricted use, distribution, and reproduction in any medium, provided you give appropriate credit to the original author(s) and the source, provide a link to the Creative Commons license, and indicate if changes were made. The Creative Commons Public Domain Dedication waiver (http://creat iveco mmons .org/ publi cdoma in/zero/1.0/) applies to the data made available in this article, unless otherwise stated.
Background
Choroidal osteoma (CO) was first described by Gass et al. [1] in 1978 as a rare benign ossifying tumour of the choroid. It is typically unilateral in 80% of cases and is seen in young healthy females. It arises in late child-hood or early adultchild-hood and its most common symp-toms are blurred vision, metamorphopsia and presence of a scotoma [2]. The CO tends to be located in the juxta or peri papillary area and may extend into the macular region. The clinical appearance of the tumour may vary from well-defined, white-cream or yellow-grey to orange lesion which corresponds to the grade of ossification (orange pigmentation is present in areas with more ossifi-cation) [3]. Varying degrees of clumping of orange, yellow
and brown pigment can be identified on the tumour surface. Multiple retinal imaging modalities have been used for studying CO and its secondary ocular findings. Over time, ocular ultrasound (US), fluorescein angiogra-phy (FA) and optical coherence tomograangiogra-phy (OCT) have been widely used for diagnosis and follow-up of eyes with CO. Enhanced-depth imaging OCT (EDI-OCT) is a recent addition of OCT, that has been able to reveal the presence of bone lamella, tubular lamella with optically empty centre, vascular channels and trabecular bone in patients with CO [4, 5]. Multicolor (MC) scanning laser imaging is a recently introduced innovative technology developed for Spectralis SD-OCT (Heidelberg Engi-neering, Heidelberg, Germany). It has been widely used to describe the findings in various retinal pathologies [6]. MC imaging is a novel, non-invasive retinal imaging modality that simultaneously acquires three reflectance images of the retina using light of 3 different wavelengths
Open Access
*Correspondence: [email protected]
and then producing a composite image, thereby allowing analysis of changes at various levels within the retina [7]. MC imaging findings in eyes with CO have not yet been described.
The aim of the study is to describe the MC imaging fea-tures in CO in conjunction with color fundus photogra-phy (CFP), fundus autofluoroscence (FAF) and OCT.
Methods
In this retrospective study, CO cases who had undergone multimodal fundus imaging were collected from 2 ter-tiary retina referral centres (Narayana Nethralaya, Ban-galore and Sankara Nethralaya, Kolkata). The diagnosis was based on the presence of a yellow-white to orange-red mass deep to the retinal pigment epithelium (RPE) and bone density on ultrasonography. All patients had undergone CFP, FAF, OCT and MC imaging in the study. Institutional review board approval was obtained for this retrospective study.
The clinical details of each patient were collected ret-rospectively by review of records, including age, gender, laterality and ocular symptoms. Each patient underwent complete ocular examination including best-corrected visual acuity, slit-lamp examination, and indirect oph-thalmoscopy. Lesion characteristics recorded for each eye included lesion location within the fundus, extent of cal-cification or decalcal-cification, and the presence or absence of sub retinal fluid (SRF) or intraretinal fluid (IRF) with/ without choroidal neovascular membrane (CNV).
Color fundus photography was done using either Optos Daytona ultra-wide field color fundus camera (Optos Daytona; Optos PLC, United Kingdom) or Zeiss 450 Fundus camera. Data included foveal involvement by the tumour (foveal, extrafoveal), tumour color (yellow, orange, white) and presence of calcification or decalcifi-cation. Calcification was defined as an orange lesion in the fundus located deep underneath the intact RPE and no visible choroidal vessels. Decalcification (complete, partial) was defined as pale areas within the osteoma, with overlying RPE thinning and visibility of underlying choroidal vessels.
All patients had OCT, FAF and MC imaging performed by confocal scanning laser ophthalmoscope using a Hei-delberg Spectralis HRA-OCT (HeiHei-delberg Engineering, Dossenheim, Germany). OCT data included tumour sur-face configuration (flat or depressed), effects of tumour on overlying retina (RPE, photoreceptor and inner ret-ina status), presence of SRF/IRF with/without CNV. Tumour depth was measured using the calliper function through the epicentre of the tumour. The findings of FAF were described as iso, hypo or hyper AF. The patterns
described on MC imaging with infrared reflectance (IR), green reflectance (GR) and blue reflectance (BR) were described as dark areas (hypo) or white areas (hyper) or no changes. On MC images, the color of the lesion varied from greenish to yellowish orange to orange depending upon the state of tumour calcification and RPE atrophy. The scanning field was 30° in most cases. 55° field images were obtained in eyes with large sized lesions. In addi-tion, FA, ICGA and OCT-A were performed in select patients only when a suspicion of CNV was present.
We analysed the MC imaging features in CO and core-lated it with that of CFP, FAF and OCT using the HRA-OCT unit.
Results
There were 11 eyes of 10 Asian patients included in the study. The clinical and demographic features are men-tioned in Table 1. There were equal number of males and females in the study (5 each). The mean age of patients was 30.63 years (range 16–44 years). Right eye and left eye were involved in 5 and 6 eyes respectively. One patient had bilateral CO while the remaining 9 patients had unilateral CO. Initial symptoms included blurred vision in 7 patients, metamorphopsia in 1 patient and 2 patients were asymptomatic. Visual acuity was between 20/20 and 20/200 in 8 eyes and < 20/200 in 3 eyes. Poor visual acuity (20/200 or worse) was related to foveal pho-toreceptor layer loss overlying the decalcified tumour in one eye and subfoveal CNV in 2 eyes. On examination, the tumour looked completely calcified in 4 eyes, partly decalcified in 4 eyes and totally decalcified in 3 eyes. Features of CO on CFP, OCT, FAF and MC imaging are described in detail in Table 2. On CFP, the color of the
tumour varied from orange (n = 3) to yellowish orange
(n = 5) to greyish white (n = 3) depending upon the extent of ossification (orange indicating complete ossification, yellowish orange indicating incomplete decalcification and greyish white indicating incomplete decalcification). The tumour involved the fovea in 9 eyes and was extrafo-veal in location in 2 eyes only.
Fundus autofluorescence findings varied depend-ing on the ophthalmoscopic appearance of each lesion. Heterogeneous lesions exhibited multiple FAF patterns that depended on the characteristics of those corre-sponding portions of the lesions. Of the 11 eyes with lesions, 5 eyes had areas of iso AF while the remaining 6 eyes had a combination of hyper and hypo AF areas. The findings on FAF depended on the tumour char-acteristics like the extent of calcification and also on associated retinal findings like presence of CNV, hem-orrhage, SRF/IRF and RPE atrophy.
MC imaging was performed in all eyes using the cSLO Heidelberg Spectralis HRA-OCT (Heidelberg Engi-neering, Dossenheim, Germany) with a scanning field of 30° and sometimes 55°. IR images were the most effi-cient in identifying CO. The IR images identified ossi-fied portions of the tumour as dark (hypo reflectance) areas while deossified portions showed iso-reflectance (no change) areas. White (hyper reflectance) areas were seen in RPE atrophy. The GR and BR images showed either no change or white areas depending upon the presence of hemorrhage and/or fluid in the retinal lay-ers. On MC images, the color of the lesion varied from being green to no change to bright orange depending upon the tumour content and RPE atrophy. Green color was noted in calcified tumour while decalcified tumour showed no change on multicolour images. Orange areas
were noted in eyes with areas of decalcified tumour with overlying RPE atrophy (Figs. 1, 2, 3, 4).
Seven eyes with SRF/IRF and clinical suspicion of choroidal CNV were imaged further with FA and ICGA and OCT- angiography in some cases. CNV was iden-tified in 5 eyes and treatment were administered with anti-VEGF therapy in 4 eyes. One eye had scarred CNV; hence, it was observed.
Discussion
Multi color scanning laser imaging is a recently intro-duced non-invasive innovative technology developed for Spectralis SD-OCT (Heidelberg Engineering, Heidelberg, Germany). In scanning laser ophthalmoscopy, a single point of laser light of a specified wavelength is scanned across the retina in a series of parallel lines and enabling an alternative method of capturing fundus images [8, 9]. It uses three laser colours, blue (488 nm), green (515 nm) and infrared (820 nm) that penetrate the tissue to differ-ent depths and simultaneously captures the reflectance strengths from different retinal structures and represents the information as en-face images. The infrared reflec-tance (IR) image visualizes structures at the level of the outer retina, RPE and choroid. Thus, the higher wave-length infrared light is useful in depicting and charac-terizing the CO lesion. The GR image allows imaging of retinal blood vessels, haemorrhages and exudates. The Table 1 Demographic and clinical findings in patients with choroidal osteoma
VA visual acuity, RE right eye, LE left eye, M male, F female, BOV blurring of vision, SRH sub retinal hemorrhage, C calcified, PD partly decalcified, DC decalcified, MNF myelinated nerve fibre, FCE focal choroidal excavation, CNV choroidal neovascular membrane, VEGF vascular endothelial growth factor
Patient Involved eye Age Symptoms VA Clinical examination Treatment
Tumour color Foveal
involvement Type Associated ocular findings
1 RE 23/M None 20/20 Orange Yes C MNF Observation
2 LE 22/M BOV 20/400 Orange Yes C FCE Observation
3 LE 16/M BOV 20/30 Yellow Yes DC Nil Observation
4 RE 41/F BOV 20/20 Yellowish orange Yes C Nil Observation
LE 41/F BOV 20/400 Greyish white Yes DC FCE, CNV IV Anti-VEGF
5 RE 40/M Metamorphosia 20/80 Greyish white Yes DC FCE, CNV IV Anti-VEGF
6 RE 37/F BOV 20/60 Yellowish orange with white areas
in the macula Yes PD CNV IV Anti-VEGF
7 LE 36/M None 20/20 Orange No C Nil Observation
8 LE 18/F BOV < 20/400 Yellowish orange with fresh SRH No PD CNV IV Anti-VEGF
9 RE 19/F BOV 20/60 Greyish-white with yellowish
pig-mentation noted at the macula Yes PD FCE Observation
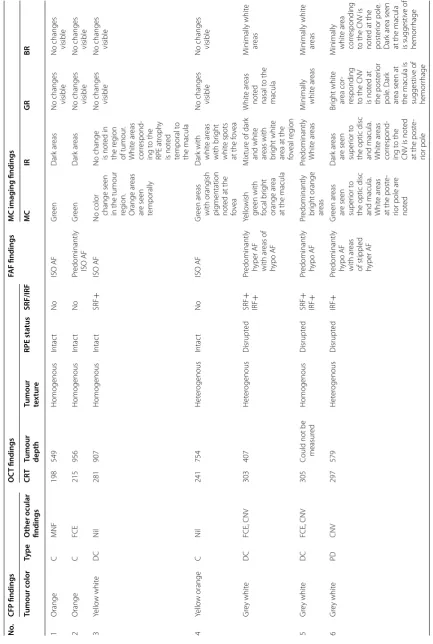
Table 2 C orr ela tion of c olor fundus , OC
T, fundus aut
ofluor
osc
enc
e and multi c
olor imaging findings in pa
tien ts with chor oidal ost eoma N o. CFP findings OC T findings FAF findings MC imag ing findings Tumour c olor Type O ther ocular findings CR T
Tumour depth Tumour textur
e RPE sta tus SRF/IRF MC IR GR BR 1 Orange C MNF 198 549 Homogenous Intac t No ISO AF Gr een Dar k ar eas
No changes visible No changes visible
2 Orange C FCE 215 956 Homogenous Intac t No Pr
edominantly ISO AF
Gr
een
Dar
k ar
eas
No changes visible No changes visible
3 Yello w whit e DC N il 281 907 Homogenous Intac t SRF + ISO AF
No color change seen in
the tumour reg ion. Orange ar eas ar e seen temporally
No change is not
ed in the r eg ion of tumour . Whit e ar eas cor respond -ing t o the RPE atr oph y is not ed temporal t o the macula
No changes visible No changes visible
4 Yello w orange C N il 241 754 Het er ogenous Intac t No ISO AF Gr een ar eas with orang ish pig mentation not
ed at the
fo
ve
a
Dar
k with white ar
eas
with br
ight
whit
e spots
at the f
ov
ea
No changes visible No changes visible
Gr ey whit e DC FCE, CNV 303 407 Het er ogenous Disrupt ed SRF + IRF + Pr
edominantly hyper AF with ar
eas of hypo AF Yello wish gr een with focal br ight orange ar ea
at the macula
M
ix
tur
e of dar
k and whit e ar eas with br ight whit e ar
ea at the
fo veal r eg ion Whit e ar eas not ed nasal t o the macula M inimally whit e ar eas 5 Gr ey whit e DC FCE, CNV 305
Could not be measur
ed Homogenous Disrupt ed SRF + IRF + Pr
edominantly hypo AF
Pr
edominantly bright orange areas
Pr
edominantly Whit
e ar
eas
M
inimally whit
e ar eas M inimally whit e ar eas 6 Gr ey whit e PD CNV 297 579 Het er ogenous Disrupt ed IRF + Pr
edominantly hypo AF with ar
eas
of stippled hyper AF
Gr een ar eas ar e seen super ior t o
the optic disc and macula. Whit
e ar
eas
at the post
e-rior pole ar
e not ed Dar k ar eas ar e seen super ior t o
the optic disc and macula. Whit
e ar eas cor respond -ing t o the
CNV is not
ed
at the post
e-rior pole Br ight whit e ar ea cor
-responding to the CNV is not
ed at the post er ior pole . Dar k ar
ea seen at
the macula is suggestiv
e of
hemor
rhage
M
inimally whit
e ar
ea
cor
responding
to the CNV is not
ed at the
post er ior pole . Dar k ar ea seen
at the macula is suggestiv
e of
hemor
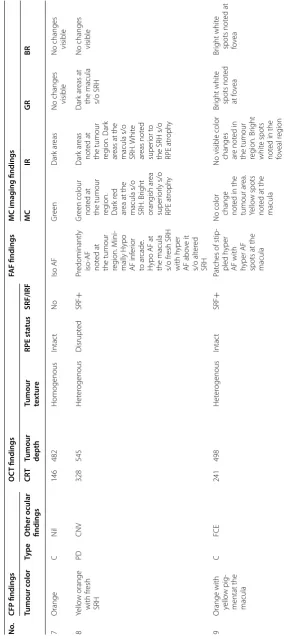
Table 2 (c on tinued) N o. CFP findings OC T findings FAF findings MC imag ing findings Tumour c olor Type O ther ocular findings CR T
Tumour depth Tumour textur
e RPE sta tus SRF/IRF MC IR GR BR 7 Orange C N il 146 482 Homogenous Intac t No Iso AF Gr een Dar k ar eas
No changes visible No changes visible
8 Yello w orange with fr esh SRH PD CNV 328 545 Het er ogenous Disrupt ed SRF + Pr
edominantly iso-AF not
ed at
the tumour reg
ion. M ini -mally H ypo AF inf er ior to ar cade . H
ypo AF at
the macula s/o fr
esh SRH with h yper AF abo ve it s/o alt er ed SRH Gr
een colour not
ed at
the tumour reg
ion.
Dar
k r
ed
ar
ea at the
macula s/o SRH. Br
ight orang ish ar ea super ior ly s/o RPE atr oph y Dar k ar eas not ed at
the tumour reg
ion. Dar
k
ar
eas at the
macula s/o SRH. Whit
e ar eas not ed super ior t o
the SRH s/o RPE atr
oph
y
Dar
k ar
eas at
the macula s/o SRH No changes visible
9
Orange with yello
w pig
-mentat the macula
C FCE 241 498 Het er ogenous Intac t SRF + Pat
ches of stip
-pled h
yper
AF with hyper AF spots at the macula No color change not
ed in the
tumour ar
ea.
Yello
w spots
not
ed at the
macula
No visible color changes ar
e not
ed in
the tumour reg
ion. Br
ight
whit
e spots
not
ed in the
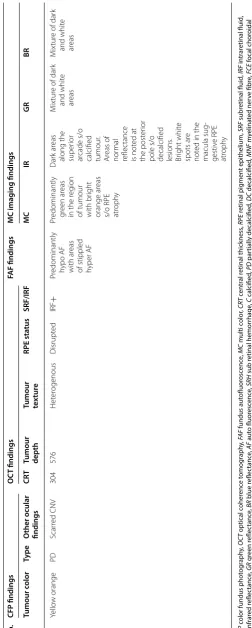
Table 2 (c on tinued) N o. CFP findings OC T findings FAF findings MC imag ing findings Tumour c olor Type O ther ocular findings CR T
Tumour depth Tumour textur
e RPE sta tus SRF/IRF MC IR GR BR 10 Yello w orange PD Scar red CNV 304 576 Het er ogenous Disrupt ed IRF + Pr
edominantly hypo AF with ar
eas
of stippled hyper AF
Pr
edominantly green ar
eas
in the r
eg
ion
of tumour with br
ight
orange ar
eas
s/o RPE atroph
y
Dar
k ar
eas
along the super
ior
ar
cade s/o
calcified tumour
. Ar eas of nor mal reflec tance is not ed at the post er ior
pole s/o decalcified lesions
. Br ight whit e spots ar e not
ed in the
macula sug -gestiv e RPE atr oph y M ix tur
e of dar
k and whit e ar eas M ix tur
e of dar
k and whit e ar eas CFP c
olor fundus phot
BR particularly provides details of the inner retina and the vitreoretinal interface such as epiretinal membranes, retinal nerve fibre layer (RNFL) thinning and macular pigment changes. Thus, secondary retinal findings like presence of intraretinal/subretinal hemorrhage, fluid or pigments are picked up with GR and BR images. The information from these 3 images are integrated to form a composite MC image [7]. In this study, we describe the features of CO on MC imaging and corelate them with that of CFP, FAF and OCT.
CO is a rare benign ossifying tumour of the choroid characterised by the presence of mature, spongy can-cellous bone. On histopathology, dense bony trabecu-lae with marrow spaces traversed by pathognomonic dilated thin-walled blood vessels, termed spider or feeder vessels are seen. These vessels connect the cho-riocapillaris to the underlying larger choroidal vessels [1]. Choroidal imaging using the EDI-OCT has revealed the presence of bone lamella, tubular lamella with opti-cally empty centre, vascular channels and trabecular bone in patients with CO [4, 5]. Because of its deeper location, CO are best picked up on IR images. The IR image shows hypo reflectance (dark) areas in an ossi-fied tumour. This is probably because the 820 nm infra-red light gets absorbed by the spongy bony trabeculae present in CO. As a result, very less quantity of light gets reflected back and hence, the lesion appears as a dark area. In decalcifying tumours, there is absence of spongy, bony trabeculae resulting in an iso-reflectance
pattern of the tumour. Areas of RPE atrophy are iden-tified as hyper reflectance (white) areas on IR image. In the BR and GR images, the CO lesion is not visible. This is due to the inability of the shorter blue and green wavelength light to reach the CO lesion. However, in the presence of secondary changes like pigmentary deposition and presence of intraretinal fluid and hem-orrhage due to CNV, areas of abnormal reflectance are identified on BR and GR images.
Fundus autofluoroscence images does not show the osteoma lesion when the overlying RPE is intact. How-ever, in areas of atrophic RPE, hypo AF (dark) areas are seen.
The MC image in CO shows color variations due to the variable reflectance produced by the tumour. The green colour on MC images are seen in eyes with calcified tumour while decalcified choroidal osteoma shows no colour change. Areas of RPE atrophy are seen as bright-orange areas. Pigment clumping over the tumour surface is usually difficult to identify ophthalmoscopically against the orange intrinsic tumour color. On MC images, pig-ment clumps are identified as yellow or orange spots while on IR images, they are seen as bright white spots.
Poor visual acuity in eyes with CO is usually seen when the decalcification with overlying atrophy of RPE and photoreceptors is located underneath the fovea. Thus, presence of bright orange areas on MC image and white areas on IR image at the sub foveal region can predict
(See figure on next page.)
Fig. 2 Case 3—Multimodal imaging in a patient with predominantly decalcified choroidal osteoma in the LE. a CF showing yellowish choroidal osteoma lesion at the peripapillary region with retinal pigment epithelial alterations noted temporal to the macula. b Ocular ultrasound showed hyperechoic area with shadowing confirming CO. c Horizontal line OCT scan passing through the fovea shows subtle elevation by the tumour temporal to the ONH and presence of sub foveal SRF. d MC image shows minimal orangish discoloration in the peripapillary area and temporal to the macula suggestive of overlying RPE atrophy. The decalcified tumour is not seen on MC image. e Infrared reflectance shows white areas corresponding to the orange areas in MC image suggestive of atrophied RPE. f, g Blue and green reflectance images do not show the osteoma lesion
Fig. 1 Case 1—Multimodal imaging with color fundus (CF), fundus autofluoroscence (FAF), optical coherence tomography (OCT), ultrasonography (USG) and multicolour (MC) imaging in a patient with RE calcified choroidal osteoma. a CF showing RE orange coloured lesion underneath the retinal pigment epithelium (RPE) at the posterior pole. b FAF showing iso autofluoroscence in the region of interest. c High bone density noted on USG b-scan. d Radial OCT scan passing thru’ the lesion shows retinal elevation with overlying normal retinal contour. e MC image showing the green colouration at the posterior pole. f Infrared reflectance showing dark areas corresponding to the tumour lesion. g, h Green and blue reflectance images do not show any changes due to CO at the posterior pole
poor visual acuity. Hence, MC imaging can be considered as a useful tool in disease prognostication.
MC imaging has some advantages over CFP [10]. It is: (1) less photophobic to the patient; (2) can be used in undilated pupil; (3) 55° images gives a larger view of the periphery (4) can be combined with SD-OCT in a single device to allow simultaneous fundus and cross-sectional imaging and (5) provides images with high contrast and enables imaging through hazy media like cataract. MC imaging also seems to be superior to FAF in identify-ing the tumour and secondary changes produced by it. In comparison to FA and ICGA, MC imaging is non-invasive, less time consuming, cheaper, and has no side effects due to dye injection.
Our study has the advantage of having sufficient num-ber of eyes with MC images in a rare disease like CO. We also had the multicolour image findings of the disease in its different stages; thus, helping us to understand better
the role of MC imaging in CO. Our study had several lim-itations as well. Absent follow-up images meant inability to describe MC imaging changes over time. All ancillary imaging studies were not used in each patient, and raster scans on SD-OCT may have missed pertinent portions of the lesions. Larger series with longer follow-ups and comparison with other imaging modalities will elucidate greater utility of MC imaging for choroidal osteomas. Present study illustrates multicolour imaging features of CO lesion, which is hitherto not described in English lan-guage published literature.
Conclusion
MC imaging is a useful tool in our arsenal of exist-ing imagexist-ing modalities in the assessment of CO and its secondary changes. Changes in IR reflectance and MC images can be used as an indicator to assess the extent Fig. 3 Multimodal imaging in case 5 with total decalcified choroidal osteoma. a CF showing a greyish white area inferotemporal to the optic nerve head (ONH) with RPE atrophy and prominent visible underlying choroidal vessels. b FAF showing areas of hypo AF suggestive of total RPE atrophy. c High bone density noted on USG b-scan. d Radial OCT scan passing vertically through the lesion shows disrupted RPE inferotemporal to the ONH with intraretinal fluid. e MC image shows orange discoloration at the posterior pole with bright orange area noted inferotemporal to the ONH suggestive of RPE atrophy overlying the choroidal osteoma. f Infrared reflectance shows white areas at the posterior pole and bright white area corresponding to the bright orange area noted on MC image suggestive of RPE atrophy. g, h Minimally white areas are noted in both green and blue reflectance images
(See figure on previous page.)
(See figure on next page.)
•fast, convenient online submission
•
thorough peer review by experienced researchers in your field
• rapid publication on acceptance
• support for research data, including large and complex data types
•
gold Open Access which fosters wider collaboration and increased citations maximum visibility for your research: over 100M website views per year
•
At BMC, research is always in progress.
Learn more biomedcentral.com/submissions
Ready to submit your research? Choose BMC and benefit from:
of tumour decalcification and its secondary changes and therefore, can aid in prognostication in the same. It has the potential to replace CFP in documentation and follow up of patients with CO.
Abbreviations
CO: choroidal osteoma; US: ultrasound; FA: fluorescein angiography; OCT: optical coherence tomography; OCTA : optical coherence tomography angi-ography; EDI: enhanced depth imaging; MC: multicolour; CFP: colour fundus photography; FAF: fundus autofluoroscence; RPE: retinal pigment epithe-lium; SRF: subretinal fluid; IRF: intra retinal fluid; CNV: choroidal neovascular membrane; IR: infrared reflectance; GR: green reflectance; BR: blue reflectance; VEGF: vascular endothelial growth factor; SRH: subretinal hemorrhage.
Authors’ contributions
RV—conceptualising the study, data acquisition, analysing the data, interpret-ing the findinterpret-ings, writinterpret-ing & reviewinterpret-ing the manuscript. BHA—Data acquisition and analysing the data. NKY—reviewing the manuscript. KS, VP, PS & MPA— Data acquisition. RKR—data acquisition, analysing the data, interpreting the findings, reviewing the manuscript. All authors read and approved the final manuscript.
Author details
1 Department of Retina and Vitreous, Narayana Nethralaya, #121/C, 1st R Block, Chord Road, Rajaji Nagar, Bengaluru, Karnataka 560010, India. 2 Department of Retina and Vitreous, Aditya Birla Sankara Nethralaya, No. 147, Mukundapur EM By Pass, Near Purva Jadavpur Thana, Kolkata, West Bengal 700099, India.
Acknowledgements None.
Competing interests
The authors declare that they have no competing interests.
Availability of data and materials
The datasets used and/or analysed during the current study are available from the corresponding author on reasonable request.
Consent for publication
The authors certify that they have obtained all appropriate patient consent forms. In the form, the patient has given his consent for his/her images and other clinical information to be reported in the journal. The patients under-stand that their names and initials will not be published and due efforts will be made to conceal their identity, but anonymity cannot be guaranteed.
Ethics approval and consent to participate Not applicable.
Funding None.
Publisher’s Note
Springer Nature remains neutral with regard to jurisdictional claims in pub-lished maps and institutional affiliations.
Received: 5 October 2018 Accepted: 10 December 2018
References
1. Gass JD, Guerry RK, Jack RL, Harris G. Choroidal osteoma. Arch Ophthal-mol. 1978;96:428–35.
2. Shields CL, Shields JA, Augsburger JJ. Choroidal osteoma. Surv Ophthal-mol. 1988;33:17–27.
3. Shields CL, Sun H, Demirci H, Shields JA. Factors predictive of tumour growth, tumour decalcification, choroidal neovascularization, and visual outcome in 74 eyes with choroidal osteoma. Arch Ophthalmol. 2005;123(12):1658–66.
4. Erol MK, Coban DT, Ceran BB, Bulut M. Enhanced depth imaging optical coherence tomography and fundus autofluorescence findings in bilateral choroidal osteoma: a case report. Arq Bras Oftalmol. 2013;76(3):189–91. 5. Shields CL, Arepalli S, Atalay HT, Ferenczy SR, Fulco E, Shields JA. Choroi-dal osteoma shows bone lamella and vascular channels on enhanced depth imaging optical coherence tomography in 15 eyes. Retina. 2015;35(4):750–7.
6. Feng HL, Sharma S, Stinnett S, Asrani S, Mruthyunjaya P. Identification of posterior segment pathology with en face retinal imaging using mc confocal scanning laser ophthalmoscopy. Retina. 2018. https ://doi.
org/10.1097/iae.00000 00000 00211 1(Epub ahead of print).
7. Tan AC, Fleckenstein M, Schmitz-Valckenberg S, Holz FG. Clinical applica-tion of MC imaging technology. Ophthalmologica. 2016;236:8–18. 8. Keane PA, Sadda SR. Retinal imaging in the twenty-first century: state of
the art and future directions. Ophthalmology. 2014;121:2489–500. 9. Manivannan A, Van der Hoek J, Vieira P, Farrow A, Olson J, Sharp PF,
For-rester JV. Clinical investigation of a true color scanning laser ophthalmo-scope. Arch Ophthalmol. 2001;119:819–24.