R E S E A R C H
Open Access
Efficacy of a compulsory homework programme
for increasing physical activity and healthy eating
in children: the healthy homework pilot study
Scott Duncan
1*, Julia C McPhee
1, Philip J Schluter
2,3,4, Caryn Zinn
1, Richard Smith
5and Grant Schofield
1Abstract
Background:Most physical activity and nutrition interventions in children focus on the school setting; however, evidence suggests that children are less active and have greater access to unhealthy food at home. The aim of this pilot study was to examine the efficacy of a compulsory homework programme for increasing physical activity and healthy eating in children.
Methods:The six-week‘Healthy Homework’ programme and complementary teaching resource was developed under the guidance of an intersectoral steering group. Eight senior classes (year levels 5-6) from two diverse Auckland primary schools were randomly assigned into intervention and control groups. A total of 97 children (57 intervention, 40 control) aged 9-11 years participated in the evaluation of the intervention. Daily step counts were monitored immediately before and after the intervention using sealed multiday memory pedometers. Screen time, sports participation, active transport to and from school, and the consumption of fruits, vegetables, unhealthy foods and drinks were recorded concurrently in a 4-day food and activity diary.
Results:Healthy Homework resulted in a significant intervention effect of 2,830 steps.day-1(95% CI: 560, 5,300, P = 0.013). This effect was consistent between sexes, schools, and day types (weekdays and weekend days). In addition, significant intervention effects were observed for vegetable consumption (0.83 servings.day-1, 95% CI: 0.24, 1.43, P = 0.007) and unhealthy food consumption (-0.56 servings.day-1, 95% CI: -1.05, -0.07, P = 0.027) on weekends but not weekdays, with no interactions with sex or school. Effects for all other variables were not statistically significant regardless of day type.
Conclusions:Compulsory health-related homework appears to be an effective approach for increasing physical activity and improving vegetable and unhealthy food consumption in children. Further research in a larger study is required to confirm these initial results.
Background
Insufficient physical activity is a leading risk factor for numerous health disorders such as obesity and type 2 diabetes [1]. While methodological differences make it difficult to compare secular trends in children’s free-liv-ing physical activity, there is evidence that organised physical activity is declining in many countries [2]. Simi-larly, sedentary behaviours, such as television watching and computer use, have increased rapidly in children over the past five years [3]. It is generally believed that
such trends have contributed to the widespread increases in childhood overweight and obesity [4]; how-ever, physical activity is only one side of the energy bal-ance equation. Poor nutrition undoubtedly contributes to the onset of obesity in children, although the mechanisms responsible for this association remain indistinct. Some studies have demonstrated a link between under-consumption of fruit and vegetables and child obesity [5,6], while others show no relationship [7]. Likewise, the over-consumption of energy-dense foods and drinks has been associated with child obesity in some [8-10] but not all studies [11-13]. Regardless of the specific pathways to chronic disease, physical activity and dietary patterns tend to track across the lifespan
* Correspondence: [email protected]
1Centre for Physical Activity and Nutrition, AUT University, New Zealand
Full list of author information is available at the end of the article
[14-19]; therefore, it makes sense to correct unhealthy habits before they have a lasting impact. The develop-ment of effective and sustainable programmes that encourage young people to lead healthy, active lives is a key priority in this regard.
The majority of lifestyle interventions for children have focused on the promotion of healthy behaviours while children are at school; however, there is a grow-ing body of evidence suggestgrow-ing that children are more likely to be inactive and consume unhealthy foods when at home. Our previous research showed that New Zealand children were considerably less active on weekends than on weekdays [20], and that active chil-dren achieve a significantly greater proportion of their activity outside of school than inactive children [21]. This is consistent with international data that support the promotion of physical activity in the home envir-onment [22-24]. Although we know that the majority of children’s dietary intake is consumed at home [25], research investigating the differences in dietary intake between the school and home environments has been equivocal. A recent study reported that New Zealand children are more likely to consume high cholesterol foods and soft drinks on non-school days than on school days [26]. Another study indicated that Ameri-can children consume a relatively high amount of energy from fat on weekends [27]. Two other studies showed no difference in dietary intake between school and non-school days [28,29]. In any case, reviews of interventions to promote physical activity [30,31] and correlates of dietary behaviour [32] in children and adolescents concluded that programmes that involve families are more likely to be effective than those that do not. Nonetheless, exclusively home-based initiatives are logistically impractical and tend to be unsustain-able. A more feasible approach is to use schools to access children for the purpose of encouraging healthy behaviour in the home environment.
Several studies have endeavoured to promote physical activity and/or healthy eating outside of school by incor-porating homework components into school-based interventions. Results have been mixed, with some showing positive effects [33-40] and others showing no effect [41-46]. However, it is difficult to determine the contributions of homework given that all studies employed multiple approaches, and many were limited by low statistical power [33], self- or proxy-reporting of physical activity [33-35,41,43,45], or relatively minor homework components [33,34,36,37,39,40,44,45]. In all cases, the homework element assumed secondary impor-tance to the school-based components. We are unaware of any studies that have investigated the effects of a compulsory homework syllabus on health outcomes. The aim of this pilot study was to examine the efficacy
of a compulsory homework programme for increasing physical activity and healthy eating in children.
Methods
Intervention
Healthy Homework was developed between August and December 2008 under the guidance of an advisory com-mittee comprised of experienced health and education professionals. The primary aim of the intervention was to improve physical activity and dietary behaviours in participating children. Ten key sub-behaviours were identified for intervention: (1) walking frequency, (2) tel-evision usage, (3) participation in sport, (4) participation in informal games, (5) participation in fitness activities, (6) fruit and vegetable consumption, (7) breakfast con-sumption, (8) fluid intake, (9) food labelling knowledge, and (10) food preparation knowledge. Table 1 describes the behaviour change techniques used to modify the key determinants (adapted from Abraham and Michie [47]).
a given week. Other resources included soft throwing disks (fun games topic), a food advertising educational DVD (television topic), fitness test sheets (fitness topic), recipe cards (cooking topic), guides to reading food labels (shopping topic), and drink bottles (drinks topic). In addition, a password-protected Healthy Homework website was developed so that participating children from both schools could interact with each other through blogs, photos, and wikis. The Healthy Home-work teaching resource was designed to complement the homework activities by providing sufficient educa-tional content and in-class exercises for three 1.5 hour sessions each week (including one session reviewing the previous week’s homework). Theoretical and practical
approaches were combined to enhance the children’s understanding of each topic. Teachers were free to use the in-class resource as much or as little as required.
Participants
Two Auckland primary schools participated in the pilot study: School A had a socioeconomic status (SES) rating in the lowest decile of New Zealand primary schools, whereas School B was in the highest SES decile. Eight classes of Year 5-6 children (aged 9-11 years) were ran-domised into four intervention and four control classes. All children in the intervention classes completed the Healthy Homework module as part of school policy; however, parental consent was required before children
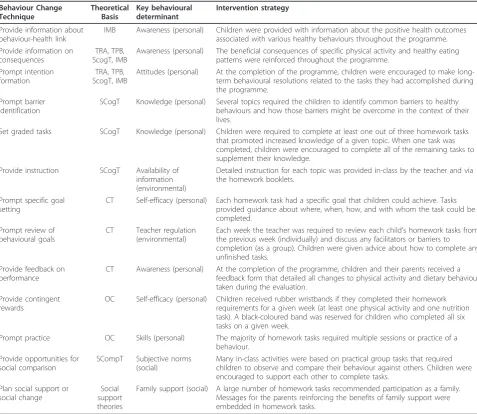
Table 1 Description of behaviour change techniques and strategies implemented in the Healthy Homework Pilot Study
Behaviour Change Technique
Theoretical Basis
Key behavioural determinant
Intervention strategy
Provide information about behaviour-health link
IMB Awareness (personal) Children were provided with information about the positive health outcomes associated with various healthy behaviours throughout the programme. Provide information on
consequences
TRA, TPB, ScogT, IMB
Awareness (personal) The beneficial consequences of specific physical activity and healthy eating patterns were reinforced throughout the programme.
Prompt intention formation
TRA, TPB, ScogT, IMB
Attitudes (personal) At the completion of the programme, children were encouraged to make long-term behavioural resolutions related to the tasks they had accomplished during the programme.
Prompt barrier identification
SCogT Knowledge (personal) Several topics required the children to identify common barriers to healthy behaviours and how those barriers might be overcome in the context of their lives.
Set graded tasks SCogT Knowledge (personal) Children were required to complete at least one out of three homework tasks that promoted increased knowledge of a given topic. When one task was completed, children were encouraged to complete all of the remaining tasks to supplement their knowledge.
Provide instruction SCogT Availability of information (environmental)
Detailed instruction for each topic was provided in-class by the teacher and via the homework booklets.
Prompt specific goal setting
CT Self-efficacy (personal) Each homework task had a specific goal that children could achieve. Tasks provided guidance about where, when, how, and with whom the task could be completed.
Prompt review of behavioural goals
CT Teacher regulation (environmental)
Each week the teacher was required to review each child’s homework tasks from the previous week (individually) and discuss any facilitators or barriers to completion (as a group). Children were given advice about how to complete any unfinished tasks.
Provide feedback on performance
CT Awareness (personal) At the completion of the programme, children and their parents received a feedback form that detailed all changes to physical activity and dietary behaviour taken during the evaluation.
Provide contingent rewards
OC Self-efficacy (personal) Children received rubber wristbands if they completed their homework requirements for a given week (at least one physical activity and one nutrition task). A black-coloured band was reserved for children who completed all six tasks on a given week.
Prompt practice OC Skills (personal) The majority of homework tasks required multiple sessions or practice of a behaviour.
Provide opportunities for social comparison
SCompT Subjective norms (social)
Many in-class activities were based on practical group tasks that required children to observe and compare their behaviour against others. Children were encouraged to support each other to complete tasks.
Plan social support or social change
Social support theories
Family support (social) A large number of homework tasks recommended participation as a family. Messages for the parents reinforcing the benefits of family support were embedded in homework tasks.
were able to participate in the evaluation of the inter-vention. Consent was obtained for 100 of the 216 chil-dren initially selected (46.3%). Three chilchil-dren were excluded due to incomplete data, resulting in a final sample size of 97 (intervention: 22 boys, 35 girls; con-trol: 13 boys, 27 girls). The ethnic composition of the sample was 48.5% European, 32.0% Pacific Island, 8.2% Māori, 6.2% Asian, and 5.2% from other ethnicities. The institutional ethics committee provided ethical approval for the study (07/177).
Instruments and Procedures
Daily physical activity levels were measured with sealed pedometers over four consecutive days (two weekdays and two weekend days). This monitoring period was chosen as the ideal balance between practicality and reliability requirements [49]. Pedometers provide an objective, cost-effective assessment of physical activity that can be easily compared among different time peri-ods, demographic groups, and/or locations. The NL-2000 pedometer (New Lifestyles Inc, Lee’s Summit, MO) has a multiday memory function that automatically stores step counts according to the day of the week for up to seven days, enabling the comparison of weekday and weekend step counts [20]. Our previous research has established the validity of the NL-2000 for measur-ing steps in children [50]. Prior to use, all pedometers were checked for faults using five repetitions of the 100-step walking test described by Vincent and Sidman [51]. Instrumental error did not exceed 3% in any of the ped-ometers. Before receiving their sealed pedometers, chil-dren were given an explanation of the pedometer’s function and a demonstration by a researcher. Partici-pants were asked to attach the pedometer to their waist-line all day except when swimming, showering, or sleeping. To assess participant compliance outside of the school environment, children maintained a 4-day diary in which they were asked to note how many hours they did not wear the pedometer each day. Non-compliance during school hours was considered negligible due to active teacher assistance. Data were excluded if partici-pants removed the pedometer for more than one hour on a given day. Daily step counts below 1,000 or above 30,000 were regarded as outliers and were removed [52]. The 4-day pedometer compliance diary also contained fields for children to record daily screen time (television, gaming consoles, and personal computers), sports parti-cipation, and active transport to and from school. In addition, a food diary was issued for children to record the type and quantity of all foods and drinks consumed over the four-day period. A food diary is a daily record of all the food and fluid consumed over a specified time; a blank template for the required days is provided. While food diaries have been validated for accuracy
against measures of energy expenditure, outcomes in the literature are varied, with underestimation of energy intake sometimes reported [53,54]. Despite this, we chose to use food diaries so that we could compare both the quality and quantity of food and fluid intake on weekdays and weekend days. Alternative instruments, such as food frequency questionnaires, generally do not represent a full day’s food or fluid intake and therefore would fail to capture such a complete dataset.
All participants were given a detailed explanation about how to correctly fill in the diaries, and parents were given written instructions to assist their child in completing the diaries accurately and to a sufficient level of detail. Dietary information from the diaries was extracted and grouped into four categories: fruit sumption, vegetable consumption, unhealthy food con-sumption, and unhealthy drink consumption. Food and drinks were defined as unhealthy in accordance with the
‘occasional foods’ tier of the three-tiered New Zealand Food and Beverage classification system. Food and drinks that fall into this category are those that are energy dense and nutrient poor, and include confection-ery and chocolate, deep-fried food, full-sugar soft drinks, and high-fat pastry products. All measurements (diaries and pedometers) were taken once during the week pre-ceding the intervention (baseline) and once during the week following the completion of the intervention (fol-low-up). Both schools were assessed over the same time period (May-June 2009).
Statistical Analyses
performed using Stata version 11.0 (StataCorp, College Station, TX, USA), anda= 0.05 defined statistical sig-nificance for all tests.
Results
Preliminary analyses
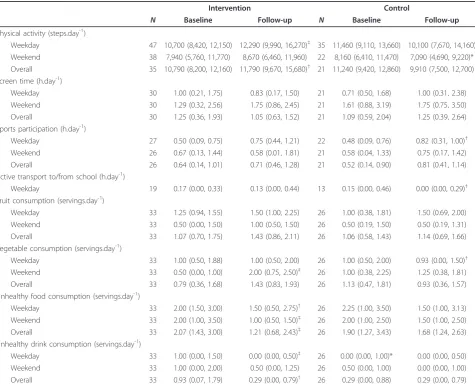
Table 2 shows the physical activity and dietary patterns of the intervention and control groups at baseline and follow-up. The only significant differences between intervention and control groups were for weekend steps at follow-up (P = 0.016) and unhealthy drink consump-tion at baseline (P = 0.037). In the intervenconsump-tion group, significant increases between baseline and follow-up were observed for weekday steps (P = 0.001), overall steps (P = 0.020), and weekend vegetable consumption (P < 0.001), whereas decreases were observed for unhealthy food consumption on weekdays (P = 0.017),
weekends (P < 0.001), and overall (P = 0.001), and for unhealthy drink consumption on weekdays (P = 0.006) and overall (P = 0.010). In the control group, significant pre-post increases were observed for weekday sports participation (P = 0.010), with vegetable consumption and active transport time decreasing on weekdays (P = 0.035 and P = 0.028, respectively).
Pedometer analyses
The distribution of raw step counts departed from nor-mality (Shapiro-Wilk’s test; P < 0.001), which was cor-rected with square-root transformed step count data (Shapiro-Wilk’s test; P = 0.261). GEE model analyses of transformed step count data showed no significant effects of school (P = 0.328), school year (P = 0.970), class (P = 0.973), or ethnicity (P = 0.541), and these variables were not considered further. The final adjusted
Table 2 Median and interquartile range of the physical activity and dietary variables for the intervention and control groups
Intervention Control
N Baseline Follow-up N Baseline Follow-up
Physical activity (steps.day-1)
Weekday 47 10,700 (8,420, 12,150) 12,290 (9,990, 16,270)‡ 35 11,460 (9,110, 13,660) 10,100 (7,670, 14,160) Weekend 38 7,940 (5,760, 11,770) 8,670 (6,460, 11,960) 22 8,160 (6,410, 11,470) 7,090 (4,690, 9,220)* Overall 35 10,790 (8,200, 12,160) 11,790 (9,670, 15,680)† 21 11,240 (9,420, 12,860) 9,910 (7,500, 12,700) Screen time (h.day-1)
Weekday 30 1.00 (0.21, 1.75) 0.83 (0.17, 1.50) 21 0.71 (0.50, 1.68) 1.00 (0.31, 2.38) Weekend 30 1.29 (0.32, 2.56) 1.75 (0.86, 2.45) 21 1.61 (0.88, 3.19) 1.75 (0.75, 3.50) Overall 30 1.25 (0.36, 1.93) 1.05 (0.63, 1.52) 21 1.09 (0.59, 2.04) 1.25 (0.39, 2.64) Sports participation (h.day-1)
Weekday 27 0.50 (0.09, 0.75) 0.75 (0.44, 1.21) 22 0.48 (0.09, 0.76) 0.82 (0.31, 1.00)† Weekend 26 0.67 (0.13, 1.44) 0.58 (0.01, 1.81) 21 0.58 (0.04, 1.33) 0.75 (0.17, 1.42) Overall 26 0.64 (0.14, 1.01) 0.71 (0.46, 1.28) 21 0.52 (0.14, 0.90) 0.81 (0.41, 1.14) Active transport to/from school (h.day-1)
Weekday 19 0.17 (0.00, 0.33) 0.13 (0.00, 0.44) 13 0.15 (0.00, 0.46) 0.00 (0.00, 0.29)† Fruit consumption (servings.day-1)
Weekday 33 1.25 (0.94, 1.55) 1.50 (1.00, 2.25) 26 1.00 (0.38, 1.81) 1.50 (0.69, 2.00) Weekend 33 0.50 (0.00, 1.50) 1.00 (0.50, 1.50) 26 0.50 (0.19, 1.50) 0.50 (0.19, 1.31) Overall 33 1.07 (0.70, 1.75) 1.43 (0.86, 2.11) 26 1.06 (0.58, 1.43) 1.14 (0.69, 1.66) Vegetable consumption (servings.day-1)
Weekday 33 1.00 (0.50, 1.88) 1.00 (0.50, 2.00) 26 1.00 (0.50, 2.00) 0.93 (0.00, 1.50)† Weekend 33 0.50 (0.00, 1.00) 2.00 (0.75, 2.50)‡ 26 1.00 (0.38, 2.25) 1.25 (0.38, 1.81) Overall 33 0.79 (0.36, 1.68) 1.43 (0.83, 1.93) 26 1.13 (0.47, 1.81) 0.93 (0.36, 1.57) Unhealthy food consumption (servings.day-1)
Weekday 33 2.00 (1.50, 3.00) 1.50 (0.50, 2.75)† 26 2.25 (1.00, 3.50) 1.50 (1.00, 3.13) Weekend 33 2.00 (1.00, 3.50) 1.00 (0.50, 1.50)‡ 26 2.00 (1.00, 2.50) 1.50 (1.00, 2.50) Overall 33 2.07 (1.43, 3.00) 1.21 (0.68, 2.43)‡ 26 1.90 (1.27, 3.43) 1.68 (1.24, 2.63) Unhealthy drink consumption (servings.day-1)
Weekday 33 1.00 (0.00, 1.50) 0.00 (0.00, 0.50)‡ 26 0.00 (0.00, 1.00)* 0.00 (0.00, 0.50) Weekend 33 1.00 (0.00, 2.00) 0.50 (0.00, 1.25) 26 0.50 (0.00, 1.00) 0.00 (0.00, 1.00) Overall 33 0.93 (0.07, 1.79) 0.29 (0.00, 0.79)† 26 0.29 (0.00, 0.88) 0.29 (0.00, 0.79)
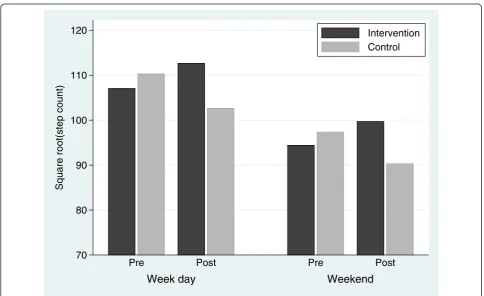
multivariable model included group (intervention/con-trol), period (pre/post), sex (male/female), and day type (weekday/weekend) variables (Figure 1). While the ana-lyses were performed on square-root step counts, the estimates presented below were first transformed back into raw step counts for easier interpretation. Results showed that the mean step count in the control group non-significantly declined from 10,990 (95% CI: 9,860, 12,190) pre-intervention to 9,510 (7,860, 11,330) post-intervention (P = 0.062), whereas the mean step count in the intervention group non-significantly increased from 10,350 (9,340, 11,410) pre-intervention to 11,480 (10,090, 12,960) post-intervention (P = 0.113). Overall, these differences corresponded to a significant interven-tion effect of 2,830 (560, 5,300) steps.day-1(P = 0.013). Our results also indicated that (1) there was an indepen-dent sex effect with boys averaging 2,500 (95% CI: 740, 4,390) more steps.day-1than girls over the duration of the study (P = 0.005), and (2) there was an independent day effect with 2,530 (1,580, 3,420) fewer steps on week-end days compared with weekdays over the duration of the study (P < 0.001). However, there were no signifi-cant interactions between day × sex (P = 0.310), group × sex (P = 0.851), period × sex (P = 0.150), period × day (P = 0.102), group × period × day (P = 0.763), or group × period × sex (P = 0.811). The Shapiro-Wilk test
showed that the residuals did not depart from normality (P = 0.877).
Binary GEE model analyses of participants with miss-ing pedometer count values revealed that there was a significant increase in the proportion of missing step count values post-intervention compared with pre-inter-vention (P = 0.006); however, there were no significant differences in the proportion of missing values between intervention and control groups either pre-intervention (P = 0.905) or post-intervention (P = 0.481). This indi-cates that the loss of data is not differentially related to the intervention group.
Activity and food diary analyses
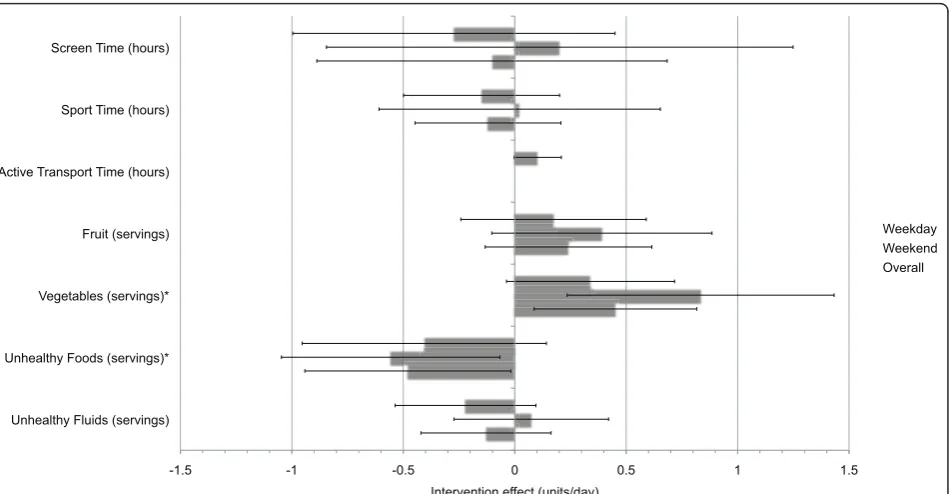
Figure 2 shows the intervention effects derived from multiple analysis of covariance procedures after adjust-ment for regression to the mean. Positive effects were detected for vegetable consumption on weekends (0.83 servings.day-1, 95% CI: 0.24, 1.43, P = 0.007) and overall (0.45 servings.day-1; P = 0.016; 95% CI: 0.09, 0.82), with no significant effect on weekdays. In addition, negative effects were detected for unhealthy food consumption on the weekends (-0.56 servings.day-1, 95% CI: -1.05, -0.07, P = 0.027) and overall (-0.48 servings.day-1; P = 0.042; 95% CI: -0.94, -0.02), but not on weekdays. No significant interactions with sex or school were observed
70 80 90 100 110 120
Square root(step count)
Week day
Weekend
Pre Post Pre Post
Intervention Control
for either vegetable or unhealthy food consumption. Further, no significant intervention effects or interac-tions were observed for screen time, active transporta-tion to and from school, sports participatransporta-tion, fruit consumption, and unhealthy fluid consumption on weekdays, weekends, or overall.
Discussion
In this study, we developed, implemented, and evaluated the first compulsory homework syllabus for promoting children’s physical activity outside of school. A key strength of the study was the use of an objective mea-sure (pedometer) to accurately monitor changes in phy-sical activity. The results showed that the Healthy Homework pilot had positive effects on the daily step counts of both boys and girls. The intervention effect of 2,830 steps.day-1corresponds to over 25% more activity each day (based on the sample mean pre-intervention). This effect was driven by both an increase of 1,100 steps.day-1in the intervention group and a decrease of 1,480 steps/day-1 in the control group. While the rea-sons for the decrease in the control group are unknown, it appears the programme had a protective effect that precluded a similar decrease in the intervention group. Furthermore, the proportion of children achieving step count targets directly related to the prevention of excess body fat (16,000 steps.day-1for boys, 13,000 steps.day-1 for girls [55]) increased from 8.6% to 31.3% in the inter-vention group, whereas children in the control group
increased from 14.3% to 16.7%. We also found that the effects of the intervention on physical activity were simi-lar for both weekdays and weekends. This is a note-worthy finding given that children’s activity levels tend to diminish during the weekend [20,22-24]. Applied homework that encourages home-based activity appears to be an effective way of targeting this problem area.
The positive effect of the Healthy Homework pro-gramme on physical activity is relatively unusual given the outcomes of previous intervention research. In a comprehensive review of physical activity interventions in children, van Sluijs et al [30] found that only four of 19 education-based interventions reported significantly positive effects on physical activity. In a similar review, Salmon et al [31] noted that only one of five‘curriculum only’interventions successfully increased physical activ-ity. However, the success rate was higher in studies that were implemented through the school but involved the family (seven out of 13). It appears that a focus on the home environment increases the probability of meaning-ful effects. Our promising results may have been due to the emphasis that was placed on increasing physical activity outside of school, including on the weekends.
Only two other behaviours showed significantly differ-ent pre-post changes between intervdiffer-ention and control participants. On weekends, vegetable consumption increased by 0.83 servings.day-1 and unhealthy food con-sumption decreased by 0.56 servings.day-1as a result of programme participation. The increase in vegetable
-1.5 -1 -0.5 0 0.5 1 1.5 Screen Time (hours)
Sport Time (hours)
Active Transport Time (hours)
Fruit (servings)
Vegetables (servings)*
Unhealthy Foods (servings)*
Unhealthy Fluids (servings)
Intervention effect (units/day)
Weekday Weekend Overall
consumption is noteworthy as it is equivalent to approximately 28% of the daily vegetable recommenda-tion of three servings a day. In addirecommenda-tion, an increase of 0.83 servings.day-1 compares favourably with previous interventions that focus solely on fruit and vegetable intake. Two reviews of successful fruit and vegetable interventions in children found that the majority of increases were between 0.2 and 0.6 daily servings [56,57]. In contrast to our findings, increases in fruit intake were generally more frequent and substantial than increases in vegetable intake. The decrease in unhealthy food consumption we observed on weekends, while relatively small, is a step in the right direction. Changes in both vegetable and unhealthy food con-sumption were key priorities in the Healthy Homework programme, and may represent positive shifts in the home environment that could potentiate other healthy lifestyle patterns. Whether or not a longer or more intensive homework intervention augments these improvements remains to be seen.
Non-significant effects in the remaining variables tar-geted in the intervention (screen time, sports participa-tion, active transport to and from school, fruit consumption, and unhealthy drink consumption) sug-gest that the materials or approaches for these topics may have been insufficient. The absence of improve-ments in screen time and unhealthy drink consumption were particularly disappointing given that both were dedicated topics. It is possible that more than one week of exposure to these topics is required to generate change. Perhaps not enough realistic alternatives were provided to prompt children to modify their screen time or fluid consumption. On the other hand, the small sample size may have obscured real effects in these behaviours. Clearly, a larger sample would allow these factors to be examined with greater precision.
Another important discovery was that the intervention yielded benefits for boys and girls from a range of socio-economic backgrounds. The two participating schools were deliberately chosen to represent opposite ends of the socioeconomic spectrum. The similarity of the inter-vention effects in both schools suggests that it is likely to be beneficial for other primary-level schools, regard-less of the socioeconomic rating. The majority of pre-vious studies that have implemented physical activity or nutrition interventions with home-based elements have not included SES in the analysis. Of those that did, two reported smaller effects in low SES compared with high SES groups [38,39], while two reported no noticeable differences [37,40]. Nonetheless, it is possible that in the latter studies (and the present one) the similar overall effects on physical activity and/or dietary patterns between SES groups were generated through different pathways. Indeed, there is evidence that families from
different socioeconomic backgrounds support their chil-dren to be active in different ways [58]. A qualitative comparison of the preferences of homework activities and resources among children and parents from diverse socioeconomic regions could be beneficial in this regard. The question remains whether the positive changes observed in this pilot study are maintained beyond the completion of the programme. A potential criticism of the programme was the use of wristbands as rewards to increase compliance: a viewpoint common among educa-tors is that the desired behaviour will cease once the reward is removed. We contend that the rewards, in this instance, were used to engage children for the purpose of learning how to be active on their own. While this approach leans towards constructivism - the theory that individuals will generate their own knowledge and understanding from experience - it maintains enough structure that children with little or no understanding of the selected topics are guided towards discovery. The programme aims to create functional knowledge that is taken with the child beyond the completion of the programme, resulting in greater opportunities to be active and promoting lifelong healthy behaviour. Clearly, we cannot comment on the success of this ambition in the present pilot study; however, future studies should consider taking long-term follow-up mea-sures to assess the sustainability of any positive outcomes. Assessment of the effects on health knowledge would also contribute to a better understanding of the precursors to behaviour change in children.
approval from their parents, and report back to their teacher. This approach was chosen to maximise the level of engagement in the programme, which may explain why significant effects on physical activity and diet were observed in a relatively small sample. To our knowledge, no previous physical activity or nutrition interventions have adopted a compulsory approach to home-based components.
The primary limitation of this study was the small sam-ple size. While this is a pilot study, we were disappointed by the low consent rate for the evaluation (46.3%). Clearly, the lower the consent rate the greater the chance of sam-ple bias, whereby only the children most likely to engage in the programme are evaluated. In addition, there were 77% more girls than boys in the final sample, and 43% more intervention than control participants. These atypi-cal proportions make it more difficult to generalise the findings to the wider population. Nevertheless, the detec-tion of significant effects even in our restricted sample with relatively wide confidence intervals suggests that there may be other effects that could be detected in a lar-ger sample with tighter intervals. Another limitation was the necessity to randomise at the class level. It is probable that a certain amount of class contamination occurred, such that the behaviour of the control participants was affected by the experiences of the intervention participants as they progressed through the programme. Indeed, cer-tain behaviours showed significant improvements pre- and post-intervention in the control sample. While the prob-ability of class contamination does not negate the observed effects of the programme (true effects would be dampened rather than enhanced), it would be preferable for future studies to randomise at the school level. Also, we decided not to request the return of the children’s booklets at the completion of the study (in case they were used in future), and consequently we had no record of homework compli-ance. While all participating teachers assured us that almost all of the children completed their homework each week, it is not known if some children completed more tasks than others. Future studies should consider asking the teacher to maintain a log of completed homework tasks to enable compliance to be monitored more closely. Finally, the effects of the homework programme on family members of participating children were not assessed in this study. Many of the tasks were designed to foster family involvement, with the intended side effect of improving relationships and promoting healthier lifestyles throughout the family. Further research is needed to eluci-date these factors.
Conclusions
Compared with the control group, the Healthy Homework pilot study resulted approximately 25% more physical activ-ity each day in both boys and girls, and was effective at
encouraging activity on both weekdays and weekends. Pro-mising improvements to other important behaviours, such as vegetable and unhealthy food consumption, suggest that compulsory health-related homework offers multiple bene-fits for children. Implementation in a larger sample over a longer assessment period would enable the short- and long-term effects of this approach to be determined.
Acknowledgements
This study was funded by the Health Research Council of New Zealand (08/ 384). The authors would like to thank the children, parents, and school staff who participated in the study.
Author details
1Centre for Physical Activity and Nutrition, AUT University, New Zealand. 2
Department of Public Health and General Practice, University of Otago, Christchurch, New Zealand.3School of Public Health and Psychosocial
Studies, AUT University, New Zealand.4School of Nursing and Midwifery, University of Queensland, Australia.5National Institute of Education,
Singapore.
Authors’contributions
SD conceived and designed the study, developed the intervention, contributed to the statistical analysis, and drafted the manuscript. JCM collected and entered the data and helped to draft the manuscript. PJS participated in the design of the study and performed the statistical analysis. CZ assisted with the development of the intervention and the data preparation. RS participated in the development of the intervention. GS helped design the study and develop the intervention. All authors reviewed and approved the final manuscript.
Competing interests
The authors declare that they have no competing interests.
Received: 10 December 2010 Accepted: 15 November 2011 Published: 15 November 2011
References
1. Boreham C, Riddoch C:The physical activity, fitness and health of children.J Sports Sci2001,19:915-929.
2. Dollman J, Norton K, Norton L:Evidence for secular trends in children’s physical activity behaviour.Br J Sports Med2005,39:892-897, discussion 897.
3. Rideout VJ, Foehr UG, Roberts DF:Generation M2: Media in the Lives of 8- to 18-Year-OldsMenlo Park, CA: Kaiser Family Foundation; 2010.
4. World Health Organization:Controlling the Global Obesity EpidemicWorld Health Organization; 2003.
5. Yannakoulia M, Ntalla I, Papoutsakis C, Farmaki AE, Dedoussis GV:
Consumption of vegetables, cooked meals, and eating dinner is negatively associated with overweight status in children.J Pediatr2010,
157:815-820.
6. Angelopoulos PD, Milionis HJ, Grammatikaki E, Moschonis G, Manios Y:
Changes in BMI and blood pressure after a school based intervention: the CHILDREN study.Eur J Public Health2009,19:319-325.
7. Downs SM, Arnold A, Marshall D, McCargar LJ, Raine KD, Willows ND:
Associations among the food environment, diet quality and weight status in Cree children in Quebec.Public Health Nutr2009,12:1504-1511. 8. Utter J, Scragg R, Schaaf D, Fitzgerald E, Wilson N:Correlates of body mass
index among a nationally representative sample of New Zealand children.Int J Pediatr Obes2007,2:104-113.
9. Nicklas TA, Yang SJ, Baranowski T, Zakeri I, Berenson G:Eating patterns and obesity in children. The Bogalusa Heart Study.Am J Prev Med2003,
25:9-16.
10. Duncan JS, Schofield G, Duncan EK, Rush EC:Risk factors for excess body fatness in New Zealand children.Asia Pac J Clin Nutr2008,17:138-147. 11. Dorsey KB, Mauldon M, Magraw R, Yu S, Krumholz HM:Do self- or
12. Craig LC, McNeill G, Macdiarmid JI, Masson LF, Holmes BA:Dietary patterns of school-age children in Scotland: association with socio-economic indicators, physical activity and obesity.Br J Nutr2010,103:319-334. 13. Parnell W,et al:Exploring the relationship between sugars and obesity.
Public Health Nutr2008,11:860-866.
14. Herman KM, Craig CL, Gauvin L, Katzmarzyk PT:Tracking of obesity and physical activity from childhood to adulthood: the Physical Activity Longitudinal Study.Int J Pediatr Obes2009,4:281-288.
15. Kjonniksen L, Torsheim T, Wold B:Tracking of leisure-time physical activity during adolescence and young adulthood: a 10-year longitudinal study.
Int J Behav Nutr Phys Act2008,5:69.
16. Telama R, Yang X, Viikari J, Valimaki I, Wanne O, Raitakari O:Physical activity from childhood to adulthood: a 21-year tracking study.Am J Prev Med2005,28:267-273.
17. Boreham C, Robson PJ, Gallagher AM, Cran GW, Savage JM, Murray LJ:
Tracking of physical activity, fitness, body composition and diet from adolescence to young adulthood: The Young Hearts Project, Northern Ireland.Int J Behav Nutr Phys Act2004,1:14.
18. Patterson E, Warnberg J, Kearney J, Sjostrom M:The tracking of dietary intakes of children and adolescents in Sweden over six years: the European Youth Heart Study.Int J Behav Nutr Phys Act2009,6:91. 19. Singer MR, Moore LL, Garrahie EJ, Ellison RC:The tracking of nutrient
intake in young children: the Framingham Children’s Study.Am J Public Health1995,85:1673-1677.
20. Duncan JS, Schofield G, Duncan EK:Pedometer-determined physical activity and body composition in New Zealand children.Med Sci Sports Exerc2006,38:1402-1409.
21. Cox M, Schofield G, Greasley N, Kolt GS:Pedometer steps in primary school-aged children: A comparison of school-based and out-of-school activity.J Sci Med Sport2006.
22. Gavarry O, Giacomoni M, Bernard T, Seymat M, Falgairette G:Habitual physical activity in children and adolescents during school and free days.Med Sci Sports Exerc2003,35:525-531.
23. Jago R, Anderson CB, Baranowski T, Watson K:Adolescent patterns of physical activity differences by gender, day, and time of day.Am J Prev Med2005,28:447-452.
24. Hardman CA, Horne PJ, Rowlands AV:Children’s pedometer-determined physical activity during school-time and leisure-time.J Exerc Sci Fit2009,
7:129-134.
25. Regan A, Parnell W, Gray A, Wilson N:New Zealand children’s dietary intakes during school hours.Nutr Diet2008,65:205-210.
26. Rockell JE, Parnell WR, Wilson NC, Skidmore PM, Regan A:Nutrients and foods consumed by New Zealand children on schooldays and non-schooldays.Public Health Nutr20101-6.
27. Cullen KW, Lara KM, de Moor C:Children’s dietary fat intake and fat practices vary by meal and day.J Am Diet Assoc2002,102:1773-1778. 28. Haines PS, Hama MY, Guilkey DK, Popkin BM:Weekend eating in the
United States is linked with greater energy, fat, and alcohol intake.Obes Res2003,11:945-949.
29. Cameron JE, Macdiarmid JI, Craig LCA, McNeill G, Masson LF, Sheehy C:
Frequency of meal and snack consumption and nutrient intake in schoolchildren in Scotland: term-time v. holidays and weekdays v. weekends.Proc Nutr Soc2008,67:E219.
30. van Sluijs EM, McMinn AM, Griffin SJ:Effectiveness of interventions to promote physical activity in children and adolescents: systematic review of controlled trials.BMJ2007,335:703.
31. Salmon J, Booth ML, Phongsavan P, Murphy N, Timperio A:Promoting physical activity participation among children and adolescents.Epidemiol Rev2007,29:144-159.
32. Pearson N, Biddle SJ, Gorely T:Family correlates of fruit and vegetable consumption in children and adolescents: a systematic review.Public Health Nutr2009,12:267-283.
33. Christodoulos AD, Douda HT, Polykratis M, Tokmakidis SP:Attitudes towards exercise and physical activity behaviours in Greek schoolchildren after a year long health education intervention.Br J Sports Med2006,40:367-371.
34. Manios Y, Kafatos I, Kafatos A:Ten-year follow-up of the Cretan Health and Nutrition Education Program on children’s physical activity levels.
Prev Med2006,43:442-446.
35. Fitzgibbon ML, Stolley MR, Schiffer L, Van Horn L, KauferChristoffel K, Dyer A:Two-year follow-up results for Hip-Hop to Health Jr.: a
randomized controlled trial for overweight prevention in preschool minority children.J Pediatr2005,146:618-625.
36. McKenzie TL,et al:School physical education: effect of the Child and Adolescent Trial for Cardiovascular Health.Prev Med1996,25:423-431. 37. Kriemler S,et al:Effect of school based physical activity programme
(KISS) on fitness and adiposity in primary schoolchildren: cluster randomised controlled trial.Br Med J2010,340:c785.
38. Friel S, Kelleher C, Campbell P, Nolan G:Evaluation of the Nutrition Education at Primary School (NEAPS) programme.Public Health Nutr
1999,2:549-555.
39. Marcus C, Nyberg G, Nordenfelt A, Karpmyr M, Kowalski J, Ekelund U:A 4-year, cluster-randomized, controlled childhood obesity prevention study: STOPP.Int J Obes (Lond)2009,33:408-417.
40. Luepker RV,et al:Outcomes of a field trial to improve children’s dietary patterns and physical activity. The Child and Adolescent Trial for Cardiovascular Health. CATCH collaborative group.JAMA1996,
275:768-776.
41. Fitzgibbon ML, Stolley MR, Schiffer L, Van Horn L, KauferChristoffel K, Dyer A:Hip-Hop to Health Jr. for Latino preschool children.Obesity (Silver Spring)2006,14:1616-1625.
42. Reilly JJ,et al:Physical activity to prevent obesity in young children: cluster randomised controlled trial.BMJ2006,333:1041.
43. Pate RR, Saunders RP, Ward DS, Felton G, Trost SG, Dowda M:Evaluation of a community-based intervention to promote physical activity in youth: lessons from Active Winners.Am J Health Promot2003,17:171-182. 44. McKenzie TL, Sallis JF, Kolody B, Faucette FN:Long-term effects of a
physical education curriculum and staff development program: SPARK.
Res Q Exerc Sport1997,68:280-291.
45. Warren JM, Henry CJ, Lightowler HJ, Bradshaw SM, Perwaiz S:Evaluation of a pilot school programme aimed at the prevention of obesity in children.Health Promot Int2003,18:287-296.
46. Hopper CA, Munoz KD, Gruber MB, Nguyen KP:The effects of a family fitness program on the physical activity and nutrition behaviors of third-grade children.Res Q Exerc Sport2005,76:130-139.
47. Abraham C, Michie S:A taxonomy of behavior change techniques used in interventions.Health Psychol2008,27:379-387.
48. Ministry of Education:The New Zealand CurriculumWellington: Ministry of Education; 2007.
49. Trost SG, Pate RR, Freedson PS, Sallis JF, Taylor WC:Using objective physical activity measures with youth: how many days of monitoring are needed?Med Sci Sports Exerc2000,32:426-431.
50. Duncan JS, Schofield G, Duncan EK, Hinckson EA:Effects of age, walking speed, and body composition on pedometer accuracy in children.Res Q Exerc Sport2007,78:420-428.
51. Vincent SD, Sidman CL:Determining measurement error in digital pedometers.Meas Phys Educ Exerc Sci2003,7:19-24.
52. Rowe DA, Mahar MT, Raedeke TD, Lore J:Measuring physical activity in children with pedometers: Reliability, reactivity, and replacement of missing data.Pediatr Exerc Sci2004,16:343-354.
53. Ambrosini GL, O’Sullivan TA, de Klerk NH, Mori TA, Beilin LJ, Oddy WH:
Relative validity of adolescent dietary patterns: a comparison of a FFQ and 3 d food record.Br J Nutr105:625-633.
54. Hu FB:Dietary pattern analysis: a new direction in nutritional epidemiology.Curr Opin Lipidol2002,13:3-9.
55. Duncan JS, Schofield G, Duncan EK:Step count recommendations for children based on body fat.Prev Med2007,44:42-44.
56. Blanchette L, Brug J:Determinants of fruit and vegetable consumption among 6-12-year-old children and effective interventions to increase consumption.J Hum Nutr Diet2005,18:431-443.
57. Knai C, Pomerleau J, Lock K, McKee M:Getting children to eat more fruit and vegetables: a systematic review.Prev Med2006,42:85-95. 58. Brockman R, Jago R, Fox KR, Thompson JL, Cartwright K, Page AS:“Get off
the sofa and go and play": family and socioeconomic influences on the physical activity of 10-11 year old children.BMC Public Health2009,9:253.
doi:10.1186/1479-5868-8-127