R E S E A R C H
Open Access
Predictive value of the pendulum test for
assessing knee extensor spasticity
Alyssa Whelan
2, Andrew Sexton
1, Melony Jones
3, Colleen O
’
Connell
2,3and Chris A. McGibbon
1,2*Abstract
Background:The pendulum test is commonly used to quantify knee extensor spasticity, but it is currently unknown to what extent common pendulum test metrics can detect spasticity in patients with neurological injury or disease, and if the presence of flexor spasticity influences the test outcomes.
Methods: A retrospective analysis was conducted on 131 knees, from 93 patients, across four different patient cohorts. Clinical data included Modified Ashworth Scale (MAS) scores for knee extensors and flexors, and years since diagnosis. BioTone™measures included extensor strength, passive and active range of motion, and pendulum tests of most affected or both knees. Pendulum test metrics included the relaxation index (RI), 1st flexion amplitude (F1amp) and plateau angle (Plat), where RI=F1amp/Plat. Two-way ANOVA tests were used to determine if pendulum test metrics were influenced by the degree of knee flexor spasticity graded by the MAS, and ANCOVA was used to test for confounding effects of age, years since injury, strength and range of motion (ROM). In order to identify the best pendulum test metrics, Receiver Operator Characteristic analysis and logistic regression (LR) analysis were used to classify knees by spasticity status (none or any) and severity (low/moderate or high/severe).
Results:Pendulum test metrics for knee extensors were not influenced by degree of flexor spasticity, age, years since injury, strength or ROM of the limb. RI, F1amp and Plat were > 70% accurate in classifying knees by presence of clinical spasticity (from the MAS), but were less accurate (< 70%) for grading spasticity level. The best classification accuracy was obtained using F1amp and Plat independently in the model rather than using RI alone.
Conclusions:We conclude that the pendulum test has good predictive value for detecting the presence of extensor spasticity, independent of the existence of flexor spasticity. However, the ability to grade spasticity level as measured by MAS using the RI and/or F1amp may be limited. Further study is warranted to explore if the pendulum test is suitable for quantifying more severe spasticity.
Keywords:Spasticity, Knee extensor, Knee flexor, Pendulum test, Relaxation index, Modified Ashworth scale, Classification, Logistic regression, Receiver operator characteristic
Background
Muscle spasticity can be a painful and debilitating compli-cation that negatively impacts function and quality of life in people with upper motor neuron injury from neurological disease or trauma [1], such as acquired brain injury (trauma, stroke), cerebral palsy, multiple sclerosis and spinal cord injury. Management of spasticity typically in-volves pharmacologic intervention and/or ongoing physical therapy [2,3], but a significant barrier to effective treatment
prescription is the inability to quantify spasticity in the clinic [4].
Spasticity is typically assessed by inducing a rapid stretch of the muscle, or administering a“stretch-reflex”test. Clin-ical tests such as the Modified Ashworth Scale [5] and Tar-dieu Scale [6] apply this method to quantify spasticity subjectively, but their inter-rater reliability [7–10] and valid-ity [11] have been questioned. Several studies have exam-ined objective approaches to quantifying spasticity in the clinic using wearable sensor technologies during passive muscle stretches [9,12–15], but there is not yet a clear con-sensus on testing protocol and how to best translate the resulting electrophysiological and biomechanical signals
* Correspondence:[email protected]
1Institute of Biomedical Engineering, University of New Brunswick, Fredericton, NB E3B 5A3, Canada
2Faculty of Kinesiology, University of New Brunswick, Fredericton, NB, Canada Full list of author information is available at the end of the article
into clinically relevant measures of spasticity. As such, the Modified Ashworth Scale remains a commonly used method of quantifying spasticity in clinical settings.
For the knee joint, the Wartenberg pendulum test [16] offers a potential solution for translation to clinical assess-ment. The pendulum test offers a simple approach whereby gravity induces the stretch-reflex of knee muscles by drop-ping the lower-leg from a resting horizontal position, and observing its oscillatory behavior throughout the passive movement [17, 18]. The test’s easy implementation and execution with commonly available sensors (e.g. electro-myography with video [19], goniometry [20,21], and other accessible devices such as the Wii remote [22]) has contrib-uted to it emerging as an objective and reliable way to quantify spasticity in the knee extensors [17,23–25]. Never-theless, there is still a lack of consensus on what pendulum test metrics are most relevant to clinical spasticity assess-ment, and importantly, whether the pendulum test is sensi-tive to knee flexor spasticity. Thus the purpose of this study was two-fold:
1) To determine if the measurement of extensor spasticity is influenced by flexor spasticity during the pendulum test in patients with neurological injury or disease; and
2) To determine which pendulum test metrics are the closest indicators of clinical muscle spasticity, as represented by the Modified Ashworth Scale (MAS).
Methods
This is a retrospective analysis of knee spasticity measure-ment data from a multi-site study to evaluate wearable sensor-based systems for acquiring objective measures of muscle tone in the clinic.
Participants
Ethics, consent and screening
The study was approved by the University Research Ethics Board (REB) and by the REB or Institutional Review Board (IRB) for each of three participating clinical sites. The three clinical sites were medium to large rehabilitation hospitals in eastern Canada (Stan Cassidy Centre for Rehabilitation, Fredericton, New Brunswick, and Nova Scotia Rehabilita-tion Hospital, Halifax, Nova Scotia) and U.S. (Spaulding Re-habilitation Hospital, Boston, Massachusetts). Prior to data collection, all participants in the study provided informed, signed consent. Data were collected at the three sites be-tween September 2011 and May 2014.
The site coordinator (non-therapist) approached patients meeting the inclusion criteria and asked if they were willing to participate in the study during a future regularly sched-uled visit. Those who were willing were informed of the study purpose, risks, discomforts, potential benefits, and
their rights to privacy and the use of data. Once a partici-pant agreed to the outlined procedures and written consent was obtained, they were enrolled in study. Additional de-tails of the larger study can be found elsewhere [13].
Inclusion criteria were: Male or female active inpatient or outpatient, sixteen years of age or older, and currently receiving services at study site for one or more of the following diagnoses: acquired brain injury (ABI: strokes, trauma, etc.), spinal cord injury (SCI: incomplete any level or complete C7 and below), multiple sclerosis (MS: meeting 2010 MacDonald criteria [26]), and cerebral palsy (CP: hemiplegic or diplegic); medically stable; and exhibits some degree of abnormal tone in either upper or lower limbs, specifically at the elbow and/or knee joint(s). Exclusion criteria were: Joint conditions such as osteoarthritis, rheumatoid arthritis, etc. that would con-found measurement of spasticity; bariatric or with little measureable surface EMG signal; viral or bacterial infec-tion; open skin lesions, and; not capable of autonomous consent.
Measurements
Clinical assessment was performed on the patient as regu-larly scheduled. This included manual assessment of knee extensors and flexors, where the therapist used the Modi-fied Ashworth Scale (MAS). The MAS is a ubiquitous in-strument for clinical spasticity assessment, in which the therapist performs a manual stretch-reflex and rates the pa-tient’s spasticity on a 6-point scale with categories 0, 1, 1+, 2, 3 and 4, as defined elsewhere [5]. There were no partici-pants with MAS = 4, which by definition is indicative of full rigidity [5] and cannot be assessed with a pendulum test.
The participant’s age, height, weight, leg length (for the pendulum test), diagnosis (ABI/CVA, MS, CP, or SCI), af-fected extremity (right, left or both), and the month and year of onset or injury, were also recorded. The participant was then assessed using the BioTone™system, as follows.
Active and passive knee extension
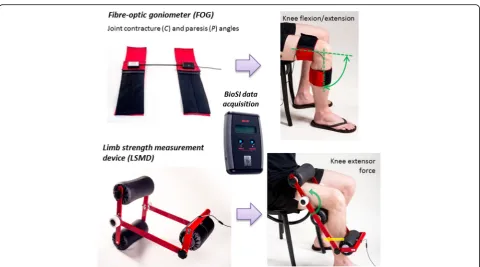
While seated, a fibre-optic goniometer (FOG, ShapeSen-sor™, Measurand, Fredericton NB) was positioned on the limb using the Neoprene/Velcro cuffs and secured in place as seen in Fig.1(top). For passive knee extension, the ther-apist moved the participant’s limb slowly to the full exten-sion. For active knee extension, the subject was instructed to move their lower leg against gravity from a flexed to fully extended position. For both active and passive tests, the minimum angle achieved (peak extension angle) was re-corded and used to estimate the degree of contracture and paresis.
Isometric muscle strength
(bottom). The LSMD was designed to enable autonomous muscle force measurement, thus eliminating the variability inherent with hand-held dynamometry protocols or sub-jectivity of the manual muscle test. The LSMD was ad-justed to“extensor”orientation and positioned on the leg such that the subject’s knee joint formed an angle of ap-proximately 90 deg. The subject then sat with leg sup-ported (by therapist) and attempting to extend the knee with maximal effort. The load cell in the LSMD recorded the patient’s maximal force generation. This was repeated three times with 15 s between trials. Because the “lever arm” of the LSMD (distance from joint centre to distal pad which contains the force transducer) was fixed, forces measured by the device are a proportional measure of muscle torque across participants, and were normalized by dividing by body weight.
Pendulum test
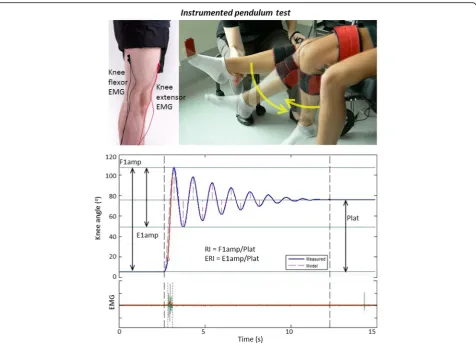
For the instrumented pendulum test, the FOG was posi-tioned as described above. To avoid interference with the thigh cuffs, EMG electrodes were placed on the lateral vas-tii and lateral hamstring. The reference electrode was placed on the hand. The participant was positioned in a re-clining wheelchair with legs hanging freely over the edge of the seat and torso inclined to approximately 30 degrees to avoid stretching the biceps femoris. The therapist then slowly raised the lower leg to full extension (or passive
extension limit) and held the leg horizontal until the par-ticipant was completely relaxed, as indicated by real-time EMG display. The participant’s lower-leg was then released and allowed to oscillate until coming to rest (oscillation amplitude less than 3 deg). Pendulum tests were repeated at least three times for the right and/or left legs. In the present study, EMG was only used to confirm if a spastic contraction occurred during the test.
Data analysis
Pendulum test metrics (RI, F1amp, Plateau angle, etc.) ex-tracted for analysis have been described in detail elsewhere [19] and are shown in Fig.2. Number of cycles (full oscilla-tions) was counted between start of motion and until the oscillation amplitudes is less than 3 degrees [27]. Data from knees of participants with bilateral involvement were treated as separate data points. All statistical analyses were completed using IBM Statistical Package for Social Science (IBM SPSS, Version 23). All statistical analyses were con-ducted with an alpha level of .05 for statistical significance.
First we used a 2-way ANOVA to compare pendulum test metrics (RI, F1amp, E1amp, ERI, Plateau angle and Number of cycles as described in Fig.2) across levels of extensor and flexor spasticity, coded as binary independ-ent variables from the clinical MAS scores. Binary vari-ables were required for testing classification models as part of the second objective.
We created two separate models in order to determine if the above metrics can classify patients by no or any spasti-city, and whether we can classify present spasticity as low or high. In the first model (Model 1), we divided knees into no spasticity (MAS = 0) and any spasticity (MAS > =1), based on their clinical assessment of knee extensor and flexor spasticity prior to the pendulum test. In the second model (Model 2), we excluded the MAS = 0 knees and re-grouped knees by low/moderate spasticity (MAS = [1,1 +]) and high/severe spasticity (MAS= [2,3]), for extensors and flexors. Although other groups could be used, the se-lected groupings had the best distribution and were consid-ered the most clinically relevant.
Therefore, Model 1 had factors: Ext1 (0 = No extensor spasticity, 1 = Any extensor spasticity) by Flx1 (0 = No flexor spasticity, 1 = Any flexor spasticity), and Model 2 had factors: Ext2 (0 = Low/moderate extensor spasticity, 1 = High/severe extensor spasticity) byFlx2(0 = Low/moderate flexor spasticity, 1 = High/severe flexor spasticity). Models
were tested for main effects of extensor spasticity and flexor spasticity, and interaction effects between extensor and flexor spasticity. Interaction effects were used to answer the first research question, and the main effects analysis was used to answer the second research question, as detailed below:
Flexor spasticity influence on measurement of extensor spasticity
These analyses were then repeated with a variety of covari-ates (age, time since diagnosis/injury, passive and active ex-tension range and isometric extensor strength) to further explore sources of variability in the pendulum test.
Assessment of pendulum test metrics for quantifying spasticity
To determine which pendulum test metrics are the best in-dicators of clinical muscle spasticity as represented by the Modified Ashworth Scale (MAS), we first need to analyze the main effects of the ANOVA tests for Model 1 and Model 2. A significant main effect for extensor (or flexor) spasticity will indicate if the pendulum test metric is sensi-tive to spasticity state of the knee. For pendulum test met-rics with significant main effects, we then determined which metric offered the best predictive value of clinical spasticity. This was accomplished using Receiver Op-erator Characteristic (ROC) analysis to determine which metrics have the best predictive potential (area under curve, AUC > .7), followed by classification analysis using logistic regressions on the binary spasticity groupings (Model 1 and Model 2) for each of the pendulum test metrics. Tests for Model 1 will determine which metric is best at discriminating any spasticity from no spasticity, and the analysis of Model 2 will determine which metric is best at grading spasticity into low/moderate spasticity ver-sus high/severe spasticity.
Results
Ninety-three patients (65 male and 28 female) composed of four patient cohorts (45 with ABI, 14 with MS, 12 with CP, and 22 with SCI) completed the pendulum test assessments and had MAS scores and other measures available. A total of 53 patients were measured unilaterally and 39 bilaterally, resulting in a total of 131 knees tested (56 ABI, 23 MS, 18 CP and 34 SCI). Participant demographic data (age and years since diagnosis) for the four cohorts are shown in Table1. Also included are BioTone™measures of contrac-ture (passive extension range), paresis (passive–active ex-tension range) and strength (peak isometric extensor force) for each cohort group.
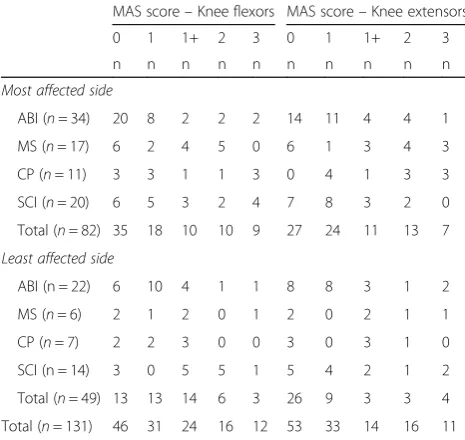
MAS score for knee flexors and extensors for patient cohorts are shown in Table2, and are grouped according to most affected and least affected side, with the total number of knees shown in the last row. The majority of flexor knees were assigned a score of 1 (n= 31) or 1+ (n = 24). Likewise, extensor knees followed a similar pattern with 33 knees being assigned a grade of 1, and 14 being assigned a grade of 1+, but with 16 being assigned a grade of 2. A total of 46 and 53 knee flexors and exten-sors, respectively, had a score of 0.
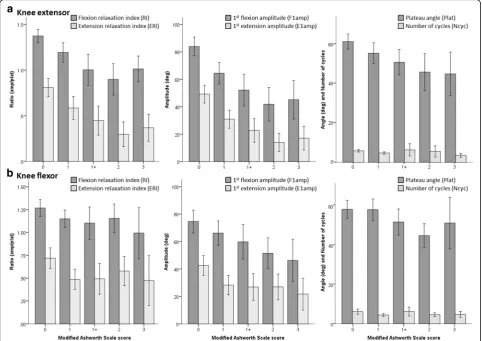
Pendulum test outcomes are summarized in Fig. 3, and Tables 3 and 4. Figure 3 shows pendulum test metrics against therapist rated MAS scores for knee extensors (top) and flexors (bottom). Data in Tables3and4show the mar-ginal means of the pendulum test scores according to the factorial levels of each model. Table 3 shows results for Model 1 with factorsExt1andFlx1, and Table4shows re-sults for Model 2 with factorsExt2andFlx2. Table5shows the resultingp-values generated for main effects and inter-action effects from testing Model 1 (top) and Model 2 (bottom).
Does flexor spasticity influence the pendulum test?
Statistical results in Table 5 for analysis of Model 1 re-vealed a significant effect of Ext1 for all metrics (p< 0.001), except for Number of cycles (p= 0.594). No sig-nificance effect of Flx1 was present for any metrics ex-cept for E1amp (p= 0.013). Additionally, there were no significantExt1×Flx1 interactions (p> 0.05). For Model 2, the only pendulum test metrics to show any statisti-cally significant differences were ERI, which had a sig-nificant Ext2 effect (p= .012) and Flx2 effect (p= .031), and E1amp which had a significant Ext2 effect. Similar to Model 1, there were no significant (p> .05) interac-tions observed for any of the pendulum test metrics.
Lastly, ANCOVA were conducted using both models to identify any confounding effects of age, time since in-jury/diagnosis, passive ROM, active-passive ROM, and extensor strength. We found that both models main-tained the same significance patterns when covariates
Table 1Participant demographic data and BioTone™assessment of contracture, paresis and strength
Gender Age, years Years Since Dx Contracture (Passive ROM Min, deg) Paresis (Passive ROM min-Active ROM min, deg)
Flexor Strength (N) Knees
M F Mean (SD) Mean (SD) Mean (SD) Mean (SD) Mean (SD) N
n n
ABI (n= 45) 35 10 52 (16) 4.8 (4.8) −6.96 (5.25) 7.46 (12.9) 258.1 (135.7) 56
MS (n= 14) 6 8 54 (13) 17.2 (8.7) −5.26 (4.81) 11.3 (19.2) 215.7 (134.2) 23
CP (n= 12) 5 7 34 (12) 34.3 (11.9) −4.28 (7.12) 6.50 (5.93) 160.8 (45.9) 18
SCI (n= 22) 19 3 45 (14) 6.4 (10.5) −6.11 (5.17) 13.3 (20.2) 153.1 (99.4) 34
Total (n= 93) 65 28 49 (16) 11.0 (12.9) −6.09 (5.46) 9.52 (15.7) 215.7 (126.4) 131
were entered into the model. Therefore, covariates did not confound any effects on pendulum test metrics.
These results show that the pendulum test metrics stud-ied were not significantly influenced by level of spasticity in the antagonistic flexor muscles, and were unaffected by variability in the covariates listed above. In addition, results showed that the pendulum test metrics studied had a good ability to discriminate between no spasticity and any spasti-city of knee extensors, as grouped by the assigned MAS. However, they were not able to discriminate very well be-tween low/moderate and high/severe spasticity.
Which pendulum test metric(s) best predicts clinical spasticity?
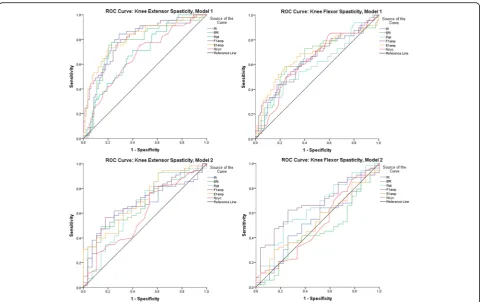
We first conducted ROC analysis on each of the metrics to evaluate their ability to detect the presence of spasticity (Model 1) and level of spasticity (Model 2). AUC values from operator curves (in Fig.4.) are presented in Table6. AUC values >.7 indicate the metric is potentially a good predictor of the dichotomous dependent variable, and AUC of ≤.5 indicates no predictive potential (diagonal line in ROC graphs in Fig.4).
For Model 1, most metrics were acceptable predictors of Ext1, having AUC > .7, with the exception of Number of cy-cles and Plateau angle which had AUC’s of 0.66 and 0.69, respectively. Not surprisingly, Model 1 yielded poor results for predictingFlx1(Factors MAS = 0, and MAS = 1,1+,2,3) with AUC values < 0.7 for all pendulum test metrics. Model 2 yielded AUC values between 0.59 and 0.71 for predicting Ext2(Factors MAS = 1,1+ and MAS = 2,3) and all were < .7 for predictingFlx2 (Factors; MAS = 1,1+, and MAS = 2,3).
This analysis suggests that RI, ERI, F1amp, E1amp and (borderline) Plateau angle are individually acceptable pre-dictors of extensor spasticity as graded by the MAS, but with no clear winner.
Given that E1amp and ERI are somewhat redundant in their nature of depicting contraction of the flexor mus-cles, and the above results suggest they have limited pre-dictive value, both were dropped from the remaining analysis. The metrics RI and F1amp appear to be the su-perior metrics for predicting spasticity presence, per any MAS greater than 0. Clearly RI is a function of F1amp, and Plateau angle, as shown in Fig.2. Therefore, we next conducted logistic regression analysis to classify extensor muscle spasticity according to Model 1 (Ext1) and Model 2 (Ext2) using RI alone, versus using F1amp and Plateau angle in the logistic regression.
These results are shown in Tables7 and8, respectively. For each metric the classification table is shown with result-ing sensitivities and specificities as well as positive and negative predictive values (PPVandNPV) and overall clas-sification accuracy. The logistic regression model for each metric is footnoted in the tables.
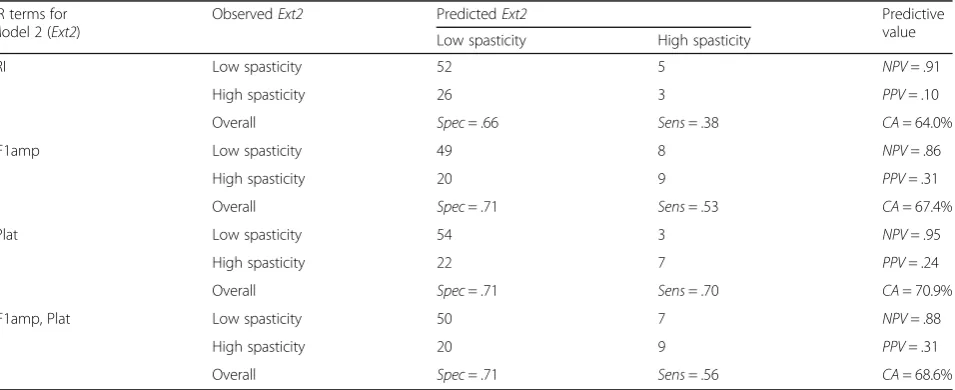
For Model 1 (Table7), the best classification accuracy value of 77.9% was for the model using F1amp and Plat-eau angle simultaneously, versus using any one of them individually or using the RI term alone. This model had the highest sensitivity (.81), specificity (.7), PPV (.86) and NPV (.62). For Model 2 (Table 8.) the highest classifica-tion accuracy value was 70.9% for the model using Plat-eau angle alone, followed by 68.6% for the model using F1amp and Plateau angle in combination. However, it is clear for Model 2 that predictively is heavily biased to-ward the negative condition; that is, the classifier was better at identifying negative results (low/moderate spas-ticity: MAS = [1,1+]) than positive results (high/severe spasticity: MAS= [2,3]).
These results show that F1amp and Plateau angle ex-plained more variance in the logistic regression analysis than RI alone, for detecting the presence of spasticity per a MAS or 1 or greater (Ext1). However, no pendulum test metrics were suitable for discriminating between knees with high/severe spasticity and those with low/moderate spasti-city (Ext2) as measured by MAS.
Discussion
The Wartenberg pendulum test [16] has been around since the 1950’s, but gained interest in the late 80’s/early 90’s as test for assessing muscle spasticity [17, 18,23,24]. Several studies have shown feasibility of using sensor technologies with an instrumented pendulum test [19, 21, 28] and re-peatability and validity for assessing spasticity in patients has generally been reported as positive [25, 29, 30]. Al-though the test has some drawbacks [31], such as being sensitive to posture during the test [32, 33], clinical Table 2Modified Ashworth Scale scores for knee flexors and
extensors from clinical examination
MAS score–Knee flexors MAS score–Knee extensors
0 1 1+ 2 3 0 1 1+ 2 3
n n n n n n n n n n
Most affected side
ABI (n= 34) 20 8 2 2 2 14 11 4 4 1
MS (n= 17) 6 2 4 5 0 6 1 3 4 3
CP (n= 11) 3 3 1 1 3 0 4 1 3 3
SCI (n= 20) 6 5 3 2 4 7 8 3 2 0
Total (n= 82) 35 18 10 10 9 27 24 11 13 7
Least affected side
ABI (n = 22) 6 10 4 1 1 8 8 3 1 2
MS (n= 6) 2 1 2 0 1 2 0 2 1 1
CP (n= 7) 2 2 3 0 0 3 0 3 1 0
SCI (n = 14) 3 0 5 5 1 5 4 2 1 2
Total (n= 49) 13 13 14 6 3 26 9 3 3 4
Total (n= 131) 46 31 24 16 12 53 33 14 16 11
evidence is increasing that the pendulum test has value for objectively quantifying spasticity of knee extensors [34–39], as well as flexors and extensor of the elbow [40,41].
Due to the velocity-dependent nature of spasticity, the initial and second swing of the pendulum test are consid-ered key for the detection of spasticity [17]. The maximum angular velocity of the knee occurs during the initial flexion oscillation [19, 27]. This first excursion (F1amp) results in the largest velocity of musculotendinous stretch, and has been found to be sensitive to differences in spasticity in the quadriceps [23]. Bajd and Vodovnik [17] further refined the approach by dividing F1amp by the plateau angle to quan-tify the relaxation index, RI.1
Therefore, the RI is simply F1amp adjusted for the resting position Plateau angle (hence excursion angle), thus ac-counting for changes in muscle length and structure that can result from ongoing spasticity, or activity induced changes in resting tonic reflex. Stillman and McMeeken [19] introduced the extension relaxation index, or ERI, along with its characteristic amplitude E1amp, describing
the excursion of the first (return) extension oscillation. In theory, this metric should be sensitive to flexor spasticity, although there is very little evidence of the use of ERI/ E1amp in clinical studies.
Several studies have identified F1amp and/or RI [17,23, 27,34,35] as acceptable metrics for identifying spasticity of the quadriceps, although its reliability has been debated in other works [27]. While these metrics have been identified as acceptable, many patient groups with knee extensor spasticity also experience knee flexor spasticity; in our study, MAS scores for extensors and flexors of patient’s knees were significantly correlated (r= .525, p< .001). To our knowledge, no other studies have examined the influ-ence of flexor spasticity on the commonly reported pendu-lum test output metrics mentioned above. Our study provides convincing evidence that the degree of flexor spas-ticity does not have a significant impact upon commonly used pendulum test metrics F1amp and RI.
and for discriminating the level of spasticity as measured by MAS. The results demonstrate that the pendulum test is a valid tool to distinguish knee extensors with spasticity (MAS > 0), from those without spasticity (MAS = 0), but that none of the metrics we analyzed were able to discrim-inate between knees with low/moderate (MAS = [1,1+])
and high/severe (MAS= [2,3]) spasticity. The data in Fig.3 provide a potential explanation for this observation: note that RI and F1amp decreased in magnitude until extensor MAS = 2 then increase for MAS = 3 to levels similar as MAS = 1+. This U-shape tendency was similarly reported between RI and reflex torque from a model-based analysis [20], but was not observed in other studies [27].
Figure3also shows that Plateau angle had a more lin-ear relationship with extensor MAS score. This may also explain, when classifying by Model 1 (no spasticity vs any spasticity), why the combination of F1amp and Plat-eau angle in the logistic regression model had better classification accuracy than did the models with RI, F1amp or Plateau angle individually. This supports the notion proposed by others [41] that F1amp corresponds to stretch-reflex hyper-excitability and Plateau angle cor-responds to passive resistance to stretch of the muscle, both of which comprise (and confound [4]) the clinical presentation of spasticity when using the MAS. This finding is consistent with the study by Fowler et al. [41], who reported that variability in resting angle (our plat-eau angle) contributed to their finding of low reliability of the RI for children with CP; which adds further sup-port to using F1amp and Plateau angle as separate inde-pendent variables for quantifying spasticity.
Although none of the metrics we studied passed muster for Model 2 classification (low spasticity vs high spasticity), the metric with the best overall accuracy, sensitivity and specificity (>.7) was Plateau angle, as shown in Table 8. However, the PPV was too low (.24) to be of value for reli-ably discriminating spasticity in the clinic, and it failed to reach AUC criteria (>.7) using the ROC analysis. It is im-portant to note, however, that we only examined a few of the available metrics from the pendulum test. Other vari-ables or approaches may be more sensitive to discriminat-ing level of spasticity, such as time to first peak, first excursion velocity, and area under the pendulum curve Table 3Model 1 marginal means for factorsExt1andFlx1on
pendulum test metrics (RI = relaxation index, ERI = extension relaxation index, F1amp = 1st flexion amplitude, E1amp = 1st extension amplitude, Plat = plateau angle, and Ncyc = number of oscillation cycles)
MODEL 1 Flx1: Flexor spasticity
No spasticity (MAS = 0)
Any spasticity (MAS > 0)
Ext1: Extensor spasticity
Mean (SD) n Mean (SD) n
RI No spasticity 1.4 (.2) 26 1.3 (.3) 19
Any spasticity 1.1 (.3) 22 1.1 (.3) 64
ERI No spasticity .9 (.3) 26 .7 (.3) 19
Any spasticity .5 (.4) 22 .4 (.3) 64
F1amp No spasticity 88.2 (22.6) 26 78.2 (21.5) 19
Any spasticity 58.6 (26.7) 22 52.8 (24.6) 64
E1amp No spasticity 54.6 (21.6) 26 41.9 (19.6) 19
Any spasticity 28.3 (21.0) 22 22.1 (17.5) 64
Plat No spasticity 62.4 (13.3) 26 59.1 (11.8) 19
Any spasticity 52.2 (16.7) 22 49.4 (16.0) 64
Ncyc No spasticity 6.3 (2.1) 26 5.2 (2.2) 19
Any spasticity 5.8 (6.3) 22 4.9 (3.5) 64
Table 4Model 2 marginal means for factorsExt2andFlx2on pendulum test metrics (RI = relaxation index, ERI = extension relaxation index, F1amp = 1st flexion amplitude, E1amp = 1st extension amplitude, Plat = plateau angle, and Ncyc = number of oscillation cycles)
MODEL 2 Flx2: Flexor spasticity
Low spasticity (MAS = [1,1+])
High spasticity (MAS= [2,3])
Ext2: Extensor spasticity
Mean (SD) n Mean (SD) n
RI Low spasticity 1.1 (.3) 30 1.1 (.5) 9
High spasticity .8 (.4) 8 1.0 (.3) 17
ERI Low spasticity .5 (.3) 30 .6 (.5) 9
High spasticity .2 (.1) 8 .4 (.3) 17
F1amp Low spasticity 60.8 (24.5) 30 48.1 (22.2) 9
High spasticity 42.9 (31.9) 8 45.9 (19.3) 17
E1amp Low spasticity 24.4 (19.2) 30 28.0 (20.7) 9
High spasticity 12.1 (13.1) 8 19.5 (12.8) 17
Plat Low spasticity 53.6 (14.4) 30 47.8 (15.1) 9
High spasticity 47.1 (21.0) 8 43.8 (16.0) 17
Ncyc Low spasticity 4.7 (2.7) 30 5.2 (1.8) 9
High spasticity 6.9 (7.7) 8 4.1 (1.8) 17
Table 5Significant levels for 2-way ANOVA tests for pendulum test metrics
p-values RI ERI F1amp E1amp Plat Ncyc Model 1
Ext1 < 0.001* < 0.001* < 0.001* < 0.001* 0.001* 0.594
Flx1 0.264 0.057 0.098 0.013* 0.304 0.181
Ext1×Flx1 0.679 0.520 0.654 0.395 0.948 0.956 Model 2
Ext2 0.103 0.021* 0.149 0.040* 0.251 0.598
Flx2 0.319 0.031* 0.477 0.269 0.319 0.262
Ext2×Flx2 0.238 0.827 0.259 0.704 0.776 0.093
*effect is significant atp< .05
[25, 42], stiffness and damping properties [20,36,43], or deriving metrics from combining kinematic information with electromyographic (EMG) information [44].
Other studies have reported that number of cycles is an indicator of spasticity [17,41]. In our study, however, num-ber of cycles had the poorest classification performance of all metrics for both Model 1 and 2 analyses. Although our averages for number of cycle agreed with data reported by others [41], Fig.3shows that the number of cycles did not correspond to MAS score.
Limitations
This study had several limitations. Firstly, the gold stand-ard used for comparison was the Modified Ashworth
Scale (MAS), which despite its ubiquity has been ques-tioned as a meaningful measure of spasticity due to the intermingling effects of hyper-excitability of the stretch re-flex and passive resistance to stretch [4, 9]. This means that the inability of the pendulum test metrics to discrim-inate between low/moderate and high/severe spasticity in our study may have been due to subjectivity and lack of sensitivity of the MAS scale, rather than the ability of the pendulum test to quantify the effect. Nevertheless, data from others [41] shows that the pendulum test was less re-liable when muscle becomes exceedingly resistant to pas-sive stretch, which stands to reason given the limited excursion of the limb after release in patients with severe spasticity (c.f. [20,25]).
Fig. 4Receiver Operator Characteristic (ROC) curves for Model 1 (top panels) and Model 2 (bottom panels) for extensors (left panels) and flexors (right panels), for each of the pendulum test metrics studied
Table 6ROC analysis area under curve (AUC) values for each pendulum test metric and for Model 1 and Model 2 prediction of spasticity
AUC (95% CI) RI ERI F1amp E1amp Plat Ncyc
Model 1
Ext1 0.784 (0.698,0.869) 0.762 (0.672,0.852) 0.807 (0.729,0.885) 0.808 (0.726,0.890) 0.691 (0.599,0.783) 0.665 (0.567,0.762)
Flx1 0.635 (0.534,0.736) 0.652 (0.549,0.754) 0.655 (0.554,0.756) 0.675 (0.573,0.778) 0.600 (0.496,0.70) 0.631 (0.530,0.731) Model 2
Ext2 0.659 (0.541,0.777) 0.675 (0.557,0.792) 0.695 (0.578,0.812) 0.705 (0.589,0.820) 0.655 (0.523,0.786) 0.590 (0.459,0.721)
Another limitation is that the study was carried out at three different hospitals across four different cohorts of pa-tients. Regarding the different sites, the BioTone™software fully controlled the testing protocol (from order of testing to acquisition of all measures) and all three sites used the same version of the system and sensors, and all site personnel (physical therapists) were trained by the research team (M.J. and A.S.) when the system was deployed. Of
greatest concern, would be the variability across therapists in their MAS assessments, however, this was not analyzed in the current paper. Regarding patient groups, although we did not analyze effects by patient cohort (due to the lower numbers of MS and CP) the measurement approach (clinical MAS and BioTone) was independent of neuro-logical etiology, and it is expected that the relationships be-tween pendulum test metrics and clinical assessment would not be influenced by this fact.
Conclusions
The pendulum test metrics studied for quantifying knee ex-tensor spasticity were not sensitive to level of flexor spasti-city (as measured by MAS), age, years since diagnosis, or physical parameters of the limb. The pendulum test metrics RI and F1amp were good predictors of the presence of clin-ical spasticity in knee extensors, however, none of the met-rics studied were acceptable predictors of the level of spasticity, as measured by MAS. The best logistic regres-sion model for detecting presence of spasticity used F1amp and Plateau angle as separate input terms rather than using RI or F1amp alone. More research is needed to determine if pendulum test metrics are sensitive outcomes measures for managing problematic spasticity.
Endnotes 1
note that R2 was originally used by [17] but most au-thors now use RI as introduced by [19].
Acknowledgements
The authors are indebted to contributing staff and graduate students of the UNB Institute of Biomedical Engineering and Stan Cassidy Centre for Rehabilitation, Nova Scotia Rehabilitation Hospital in Halifax, and Spaulding Rehabilitation Hospital in Boston.
Table 7Classification results using logistic regression for Model 1 prediction of extensor spasticity from pendulum test metrics: RI, F1amp, and Plat
LR terms for Model 1 (Ext1)
Observed
Ext1
PredictedExt1 Predictive value No spasticity Any spasticity aRI No spasticity 23 22
NPV= .51 Any spasticity 12 74 PPV= .86
Overall Spec= .66 Sens= .77 CA= 74.0%
bF1amp No spasticity 24 21
NPV= .53 Any spasticity 14 72 PPV= .84
Overall Spec= .63 Sens= .77 CA= 73.3%
cPlat No spasticity 15 30
NPV= .33 Any spasticity 11 75 PPV= .87
Overall Spec= .58 Sens= .71 CA= 68.7%
dF1amp, Plat No spasticity 28 17
NPV= .62 Any spasticity 12 74 PPV= .86
Overall Spec= .70 Sens= .81 CA= 77.9%
a
RI: Constant = 5.153; Beta(RI)=−3.646,p< .001 b
F1amp: Constant = 4.236; Beta(F1amp)=−.051,p< .001 c
Plat: Constant = 3.383; Beta(Plat)=−.049,p< .001 d
F1amp, Plat: Constant = 3.258; Beta(F1amp)=−.073,p< .001;
Beta(Plat)= .045,p= .082
Table 8Logistic regression results for Model 2 prediction of extensor spasticity from pendulum test metrics: RI, F1amp, and Plat
LR terms for Model 2 (Ext2)
ObservedExt2 PredictedExt2 Predictive
value Low spasticity High spasticity
aRI Low spasticity 52 5
NPV= .91
High spasticity 26 3 PPV= .10
Overall Spec= .66 Sens= .38 CA= 64.0%
bF1amp Low spasticity 49 8
NPV= .86
High spasticity 20 9 PPV= .31
Overall Spec= .71 Sens= .53 CA= 67.4%
cPlat Low spasticity 54 3
NPV= .95
High spasticity 22 7 PPV= .24
Overall Spec= .71 Sens= .70 CA= 70.9%
dF1amp, Plat Low spasticity 50 7
NPV= .88
High spasticity 20 9 PPV= .31
Overall Spec= .71 Sens= .56 CA= 68.6%
a
RI: Constant = 1.006; Beta(RI)=−1.623,p= .026 b
F1amp: Constant = .834; Beta(F1amp)=−.029,p= .005 c
Plat: Constant = 1.044; Beta(Plat)=−.035,p= .022 d
Availability of data materials Please contact corresponding author.
Funding
This work was supported by the Atlantic Canada Opportunities Agency, Atlantic Innovation Fund, Project # 195180.
Authors’contributions
AW and CM conceived the research questions, performed the statistical analysis and wrote the manuscript draft. AS, MJ and CO collected the data and managed the project. CM and CO acquired the funding to support the project. All authors reviewed, edited and approved the final version of the manuscript.
Competing interests
The authors declare that they have no competing interests.
Publisher’s Note
Springer Nature remains neutral with regard to jurisdictional claims in published maps and institutional affiliations.
Author details
1Institute of Biomedical Engineering, University of New Brunswick, Fredericton, NB E3B 5A3, Canada.2Faculty of Kinesiology, University of New Brunswick, Fredericton, NB, Canada.3Stan Cassidy Centre for Rehabilitation, Fredericton, NB, Canada.
Received: 10 January 2018 Accepted: 5 July 2018
References
1. Public Health Agency of Canada. Mapping connections: Understanding of neurological conditions in Canada. Ottawa ON: Public Health Agency of Canada; 2014.
2. Logan LR. Rehabilitation techniques to maximize spasticity management. Top Stroke Rehabil. 2011;18(3):203–11.
3. Kostas JP, Ristanis SE, Soucacos PN. Botulinum a toxin for treatment of lower limb spasticity in cerebral palsy gait analysis in 49 patients. Acta Orthop Scand. 2003;74(6):749–55.
4. Malhotra S, Pandyan AD, Day CR, Jones PW, Hermens H. Spasticity, an impairment that is poorly defined and poorly measured. Clin Rehabil. 2009; 23(7):651–8.
5. Bohannon RW, Smith MB. Interrater reliability of a modified Ashworth scale of muscle spasticity. Phys Ther. 1987;67(2):206–7.
6. Mackey AH, Walt SE, Lobb G, Stott NS. Intraobserver reliability of the modified Tardieu scale in the upper limb of children with hemiplegia. Dev Med Child Neurol. 2004;46(4):267–72.
7. Ansari NN, Naghdi S, Younesian P, Shayeghan M. Inter- and intrarater reliability of the modified modified Ashworth scale in patients with knee extensor poststroke spasticity. Physiother Theory Pract. 2008;24(3):205–13. 8. Ansari NN, Naghdi S, Hasson S, Mousakhani A, Nouriyan A, Omidvar Z.
Inter-rater reliability of the modified modified Ashworth scale as a clinical tool in measurements of post-stroke elbow flexor spasticity. NeuroRehabilitation. 2009;24(3):225–9.
9. Pandyan AD, Price CI, Rodgers H, Barnes MP, Johnson GR. Biomechanical examination of a commonly used measure of spasticity. Clin Biomech Bristol Avon. 2001;16(10):859–65.
10. Akpinar P, Atici A, Ozkan FU, Aktas I, Kulcu DG, SarıA, et al. Reliability of the modified Ashworth scale and modified Tardieu scale in patients with spinal cord injuries. Spinal Cord. 2017;55:944–9.
11. Fleuren JF, Voerman GE, Erren-Wolters CV, Snoek GJ, Rietman JS, Hermens HJ, et al. Stop using the Ashworth Scale for the assessment of spasticity. J Neurol Neurosurg Psychiatry. 2009;81(1):46–52. Journal Article
12. McGibbon CA, Sexton A, Jones M, O’Connell C. Elbow spasticity during passive stretch-reflex: clinical evaluation using a wearable sensor system. J Neuroengineering Rehabil. 2013;10(1):61. -0003-10–61
13. McGibbon C, Sexton A, Jones M, O’Connell C. Quantification of elbow muscle tone from an instrumented manual stretch-reflex test. Phys Med Rehabil Res [Internet]. 2016 [cited 2017 Oct 29];1(5). Available from:http:// oatext.com/Quantification-of-elbow-muscle-tone-from-an-instrumented-manual-stretch-reflex-test.php.
14. Calota A, Feldman AG, Levin MF. Spasticity measurement based on tonic stretch reflex threshold in stroke using a portable device. Clin Neurophysiol Off J Int Fed Clin Neurophysiol. 2008;119(10):2329–37.
15. Bar-On L, Aertbelien E, Wambacq H, Severijns D, Lambrecht K, Dan B, et al. A clinical measurement to quantify spasticity in children with cerebral palsy by integration of multidimensional signals. Gait Posture. 2013;38(1):141–7. 16. Wartenberg R. Pendulousness of the legs as a diagnostic test. Neurology.
1951;1(1):18–24.
17. Bajd T, Vodovnik L. Pendulum testing of spasticity. J Biomed Eng. 1984;6(1):9–16. 18. Lin DC, Rymer WZ. A quantitative analysis of pendular motion of the lower leg in spastic human subjects. IEEE Trans Biomed Eng. 1991; 38(9):906–18.
19. Stillman B, McMeeken J. A video-based version of the pendulum test: technique and normal response. Arch Phys Med Rehabil. 1995;76(2):166–76. 20. Le Cavorzin P, Hernot X, Bartier O, Carrault G, Chagneau F, Gallien P,
et al. Evaluation of pendulum testing of spasticity. Ann Readaptation med Phys rev Sci Soc Francaise reeducation Fonct Readaptation Med Phys 2002;45(9):510–516.
21. Jamshidi M, Smith AW. Clinical measurement of spasticity using the pendulum test: comparison of electrogoniometric and videotape analyses. Arch Phys Med Rehabil. 1996;77(11):1129–32.
22. Yeh C-H, Hung C-Y, Wang Y-H, Hsu W-T, Chang Y-C, Yeh J-R, et al. Novel application of a Wii remote to measure spasticity with the pendulum test: proof of concept. Gait Posture. 2016;43:70–75.
23. Bajd T, Bowman B. Testing and modelling of spasticity. J Biomed Eng. 1982;4(2):90–6.
24. Bohannon RW. Variability and reliability of the pendulum test for spasticity using a Cybex II isokinetic dynamometer. Phys Ther. 1987;67(5):659–61. 25. Bohannon RW, Harrison S, Kinsella-Shaw J. Reliability and validity of
pendulum test measures of spasticity obtained with the Polhemus tracking system from patients with chronic stroke. J Neuroengineering Rehabil. 2009; 6:30. (Journal Article):30–0003–6–30
26. Polman CH, Reingold SC, Banwell B, Clanet M, Cohen JA, Filippi M, et al. Diagnostic criteria for multiple sclerosis: 2010 revisions to the McDonald criteria. Ann Neurol 2011;69(2):292–302.
27. Fowler EG, Nwigwe AI, Ho TW. Sensitivity of the pendulum test for assessing spasticity in persons with cerebral palsy. Dev Med Child Neurol. 2000;42(3):182–9.
28. Valle MS, Casabona A, Sgarlata R, Garozzo R, Vinci M, Cioni M. The pendulum test as a tool to evaluate passive knee stiffness and viscosity of patients with rheumatoid arthritis. BMC Musculoskelet Disord. 2006;7:89. Journal Article
29. White H, Uhl TL, Augsburger S, Tylkowski C. Reliability of the three-dimensional pendulum test for able-bodied children and children diagnosed with cerebral palsy. Gait Posture. 2007;26(1):97–105.
30. Syczewska M, Lebiedowska MK, Pandyan AD. Quantifying repeatability of the Wartenberg pendulum test parameters in children with spasticity. J Neurosci Methods. 2009;178(2):340–4.
31. Biering-Sørensen F, Nielsen JB, Klinge K. Spasticity-assessment: a review. Spinal Cord. 2006;44(12):708–22.
32. Fleuren JF, Nederhand MJ, Hermens HJ. Influence of posture and muscle length on stretch reflex activity in poststroke patients with spasticity. Arch Phys Med Rehabil. 2006;87(7):981–8.
33. de Azevedo ERFBM, Maria RM, Alonso KC, Cliquet AJ. Posture influence on the pendulum test of spasticity in patients with spinal cord injury. Artif Organs. 2015;39(12):1033–7.
34. Szopa A, Domagalska-Szopa M, KidońZ, Syczewska M. Quadriceps femoris spasticity in children with cerebral palsy: measurement with the pendulum test and relationship with gait abnormalities. J Neuroengineering Rehabil 2014;11:166 (September).
35. Krause P, Szecsi J, Straube A. Changes in spastic muscle tone increase in patients with spinal cord injury using functional electrical stimulation and passive leg movements. Clin Rehabil. 2008;22(7):627–34.
36. Lotfian M, Mirbagheri MM, Kharazi MR, Dadashi F, Nourian R, Irani A, et al. Pendulum test measure correlates with gait parameters in children with cerebral palsy. Conf Proc Annu Int Conf IEEE Eng Med Biol Soc IEEE Eng Med Biol Soc Annu Conf. 2016;2016:1708–11. 37. Hofstoetter US, McKay WB, Tansey KE, Mayr W, Kern H, Minassian K.
38. Tancredo JR, Maria RM, Azevedo ER, Alonso KC, Varoto R, Cliquet Junior A. Clinical assessment of spasticity in individuals with spinal cord injury. Acta Ortop Bras. 2013;21(6):310–4.
39. Nordmark E, Anderson G. Wartenberg pendulum test: objective quantification of muscle tone in children with spastic diplegia undergoing selective dorsal rhizotomy. Dev Med Child Neurol. 2002;44(1):26–33. 40. Lin CC, Ju MS, Lin CW. The pendulum test for evaluating spasticity of the
elbow joint. Arch Phys Med Rehabil. 2003;84(1):69–74.
41. Huang H-W, Ju M-S, C-CK L. Flexor and extensor muscle tone evaluated using the quantitative pendulum test in stroke and parkinsonian patients. J Clin Neurosci Off J Neurosurg Soc Australas. 2016;27:48–52.
42. Sterpi I, Caroli A, Meazza E, Maggioni G, Pistarini C, Colombo R. Lower limb spasticity assessment using an inertial sensor: a reliability study. Physiol Meas. 2013;34(11):1423–34.
43. Joghtaei M, Arab AM, Hashemi-Nasl H, Joghataei MT, Tokhi MO. Assessment of passive knee stiffness and viscosity in individuals with spinal cord injury using pendulum test. J Spinal Cord Med. 2015;38(2):170–7.