JNS 2 (2012) 183-189
Studies on Properties of Ag\Al
2O
3Nanocomposite Synthesized
by Solution Combustion Technique Under Novel Condition
Z. Naemi*,a , M. Jafar-Tafreshia, M. Fazlib
aDepartment of Physics, University of Semnan, Semnan, Iran. bDepartment of Chemistry, University of Semnan, Semnan, Iran.
Abstract
Ag\Al2O3 nanocomposite were synthesized by solution combustion
Technique using ammonium carbonate as a new fuel under simultaneous combustion of alumina and silver particles condition. Samples prepared with different amount of silver, were characterized by XRD, BET, SEM and optical Absorption measurements. XRD analysis was used to determine the change in phase and size of the synthesized nanoparticle with adding silver. BET analysis showed that added silver reduced specific surface but which is still suitable for catalytic application. BJH analysis showed that pores in Ag/Al2O3 nano composite are mesoporous and
in Al2O3 nano particles is microporous. TEM and SEM showed that silver was distributed completely homogenously in pores of Alumina, and didn’t change in surface of Alumina. Optical transmission showed the different existence of different Ag species.
2012 JNS All rights reserved
Article history:
Received 10/6/2012 Accepted 9/8/2012 Published online 1/9/2012
Keywords:
Nanocomposite Solution combustion Ag\Al2O3
*Corresponding author:
E-mail address:
1. Introduction
The functional nanocomposites involving ceramic matrix and nanosized particles of transition metals are known to exhibit multifunctional and attractive properties and are identified as potential candidate for structural [1], mechanical [2], catalytic [3], thermal [4], optical [5], magnetic [6] and electrical [7] applications. Nanocomposites are usually involved noble or transition metals incorporated in such oxide matrices such as alumina, silica and titania by
184
Z. Naemi et al./ JNS 2 (2012) 183-189
is 10 vol.%: 394 MPa, 4.7 MPa m1/2, 11
×
1013Ω
cm, 14.7 mm2 s-1, and 40 W m-1 K-1 (compared to325 MPa, 4.0 MPa m1/2, 1.8
×
1013Ω
cm, 11.3 mm2 s-1, and 32 W m-1 K-1 for pure alumina). Moreover, it was shown that these composites have an interfacial thermal conductance of 4.1×10⁸W m-2 K-1 [15].Studies on the features of hardness in alumina silver composites are reported by Dutta et al., where the Knoop hardness values of the composites sensitively depend on the applied load of intendation [16]. Ag\Al2O3 nanocomposites can
be synthesized mainly by wet chemical [17], solvothermal- calcination (SC), impregnation-calcination(IC)[18], solgel, impregnation, incipient wetness impregnation [19] and alternating current[20]methods. However, all these techniques are quite involved and need high temperatures and long processing times. Moreover alumina and silver nanoparticles are synthesized and prepared separately but in present work we have synthesized both nano particles simultaneously using combustion process.
Solution combustion synthesis (SCS) is a versatile, simple and rapid process, which allows effective synthesis of a variety of nanosize materials [21].
In this study, we report the synthesis of Ag\g-Al2O3 nanocomposite by solution
combustion technique using a new type of fuel, Ammonium carbonate is a new mineral material and has lower price compared to often organic fuels and it has good potential to product nano materials with high surface area because of releasing vigorous enormous amount of gas while combustion process. The Ag\Al2O3 nanocomposite
prepared with different amount of Ag, have been characterized by different analysis such as XRD, BET, optical transmission and SEM. To assess the
change in properties of products with change in amount of silver.
2. Experimental procedure
Analytical grade of aluminium nitrate nanohydrate Al(NO3)3.9H2O(Merck) silver nitrate
AgNO3 and ammonium carbonate (NH4)2CO3
(Merck) were used as the starting materials and ratio between aluminium nitrate and silver nitrate was chosen so that final Ag\Al2O3 nano composite
samples contained( 1wt%, 5wt% and 10wt% of Ag).
The starting materials were used including amount of stoichiometric of aluminium nitrate, silver nitrate to produce pure Al2O3(sample a), 1
wt% Ag\Al2O3(sample b), 5wt% Ag\Al2O3(sample
c) and 10 wt% Ag\Al2O3(sample d) The
preparation method for the Solution combustion synthesis was the same as that in the literature [22]. And then the solution put into ultrasound machine for 10 minute and 40C◦ , Finally The samples were
calcined at 900 C◦ for 2 h.
3. Characterization
The crystallinity and phase identification of the powders were recorded by X-ray diffractometer (D4 Bruker) using Cu Kα as the radiation source and Ni as the filter over 2θ range from 10◦ to 80◦
at a rate of 2.5 ◦/ min. The voltage and the current setting were 30 kV and 30 mA, respectively. The samples were continuously scanned with a step size of 0.06◦ (2θ) and a count time of 1s per step.
The strongest peaks in XRD patterns for Ag\Al2O3 and alumina were selected to calculate
the crystallite size by the Scherrer formula
185
Z. Naemi et al./ JNS 2 (2012) 183-189
BET surface area and pore size distribution of synthesized powders were determined by nitrogen adsorption at 77 K using BET and BJH method respectively, by adsorption analyzer (BEL Japan, Inc). samples were observed by SEM(scaning electron Microscopy, Hitachi, japan). Transmission electron microscopy (TEM) was carried out with a CM300 FEG PHILIPS microscope to determine shape and average size of the particles. By using Diffuse-reflectance UV/Vis (spectra (UV/Vis) were recorded under ambient conditions on a U-3010(Hitachi spectrometer with a standard diffuse reflectance unite) had Study on the existence of different silver species into samples synthesis.
4. Results and discussion
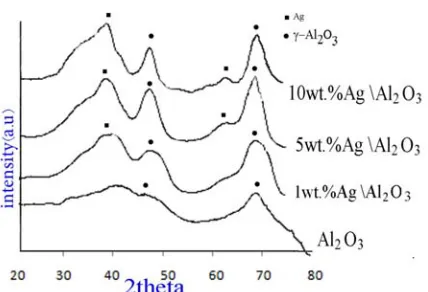
XRD pattern of pure Al2O3 and Ag\Al2O3
nanocomposite (synthesized under the same condition) are shown in fig.1.
Fig. 1. XRD pattern of as- synthesized sample.
In all the samples the γ-Al2O3 phase was
detected. In XRD patterns of pure Alumina broad peak was observed at 2θ of 45 but this peak with added silver became much significant and sharper indicating the mean size of the γ-Al2O3 particle in
the Ag\Al2O3 nano composite increased. The Ag
phases was observed at 2θ of 38.2 which correspond to the (111) lattice planes of metallic
Ag in the all samples, this might because that Ag species on the Ag\Al2O3 was crystalliy phase. It is
observed that with increasing amount of Ag, the Ag (111) diffraction peak became much significant and sharper, indicating that the mean size of the Ag particle in the Ag\Al2O3 nano composite increased.
The added silver nanoparticles occupied lattice vacancies and γ-phase for alumina didn’t change. Determined by Scherer’s equation (Eq. (1)) method from the XRD half-peak broadening
(Eq. (1))
where D is the crystallites size in nm, λ the radiation of wavelength (Cu Kα1, 0.15406 nm), β the full width at half of the maximum in radians and θ is the Bragg-angle. The results are shown in Table 1.
Table 1. Crystal size of Ag and Al2O3 particles by
Scherer’s equation
Sample Crystallite size of
Ag (nm) Crystallite size of Al2O3 (nm)
a - 1.75
b 3.07 1.99
c
d 3.74 4.99 3.23 4.54
The results of BET and BJH measurements for nanocomposites are shown in Table 2. The surface area of the Ag\Al2O3 nanocomposite gradually
186
Z. Naemi et al./ JNS 2 (2012) 183-189
b, c and d smaller than that of the (sample a). (Sample a) has microporous pores and others samples have mesoporous pores. In mesoporous materials due to larger pores more number of molecules interact with each other, and they show better catalytic properties [23]. Hysteresis loops occur at low relative pressures (around 0.5) suggesting a narrow pore size distribution [24]. The pore size distribution confirms this assertion. Well-dispersed to solution tends to produce small pore size and homogeneous product.
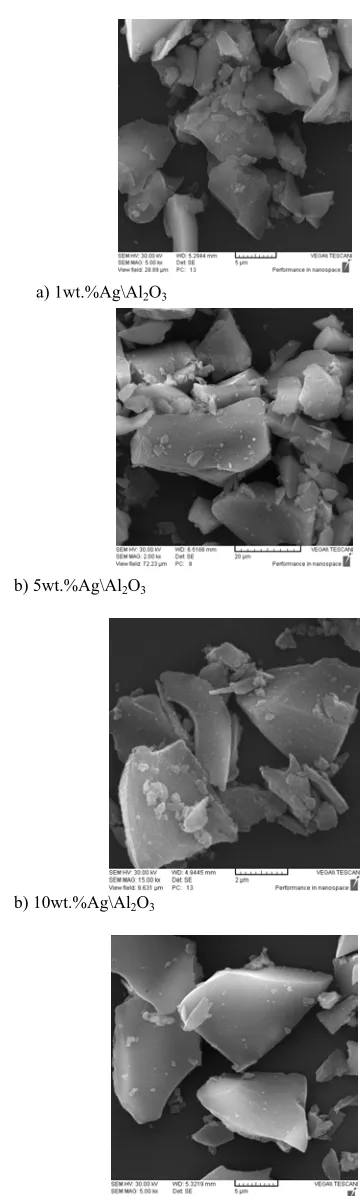
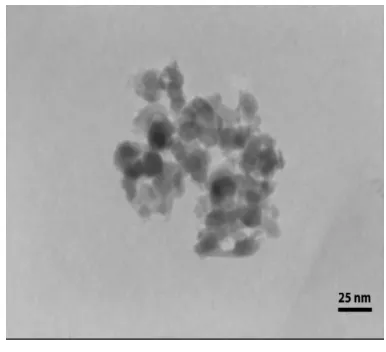
The microstructure of the sample is analyzed by using SEM and TEM microscopy. SEM micrograph shown with the further increase of silver loading there are smaller bulk, this indicating interaction the surface charge because smaller particle with more number of particles make a larger bulk and larger surface area, but unlike larger particles with lower number of particles make a smaller bulk and smaller surface area. This result is in agreement with the value obtained from XRD and BET analysis. TEM microscopy (fig3) shows Ag particles were mostly around 3.54 nm in size and clearly shows that the Ag particles are almost uniformly dispersed on the Ag\Al2O3
nanocomposite [25]. The SEM, BET, BJH and analysis of samples showed that silver is distributed quite homogeneously in pores of Alumina surface, no changes was seen surface of Alumina.
Table 2: results of BET and BJH measurements
a) 1wt.%Ag\Al2O3
b) 5wt.%Ag\Al2O3
b) 10wt.%Ag\Al2O3
d)Al2O3
Fig. 2. (a),(b),(c)and (d) The SEM micrographs of
Ag\Al2O3 nanocomposite and Al2O3 nanoparticles
Sample specific surface area(m3/g) volume(cmAverage pore 3/g) diameter(nm)Mean pore
187
Z. Naemi et al./ JNS 2 (2012) 183-189
10wt. %Ag\Al2O3
Fig. 3. Shows TEM micrograph of 10wt. %Ag\Al2O3
nanocomposite
UV/Vis was taken to discover the details of the state of the supported Ag. Fig. 8 shows the spectra of (a) the 5wt. %Ag\Al2O3 that synthesized
in 400C0 and (b) the 5wt. % Ag\Al 2O3that
synthesized in 500C0. UV/Vis analysis
demonstrates the existence of different states of the Ag species because the presence Ag+ species makes the high catalytic activity of Ag-Al2O3.
The band at 215 nm is attributed to the 4d10 to
4d95s1 transition of highly dispersed Ag+ ions [26,
27], 275 nm is assigned to small Agδ+
n clusters
[28–29] and the bands at 350 and 450 nm are attributed to metallic silver (Ag0) particles [26–29].
Sato et al. confirmed an absorption band of metallic Agn clusters at 352 nm for 4% Ag/Al2O3
[28]. Bogdanchikova et al. also reported an absorption band of Ag0 at a wavelength > 390 nm for reduced Ag/Al2O3 [27]. Accordingly, we
can estimate that the bands at 350 and 450 nm are due to metallic Ag0particles. The absorption band
around 276nm and 350 ~ 400nm was observed in both samples which respectively was assigned to Agδ+
n clusters and metallic silver (Ag0) particles. In
table (b) The band at 215nm is attributed to Ag+
ions, but in table (a) this band isn’t observed. Ag/γ−Al2O3 catalyst, highly dispersed Ag+ ions
were required for HC−SCR [30, 31].
Fig. 4. Shows the spectra of (a) the 5wt. %Ag\Al2O3
that synthesized in 400 0Cand(b) the5wt.% Ag\Al 2O3
that synthesized in 500 0C
The high activity of Ag−Al2O3 for SCR of NO
to N2 by n-octane and higher hydrocarbons was believed to be due to the high dispersion of the Ag species and Ag+ ions [32]. Large amount of active
Ag+ ions and Agδ+
n clusters in Ag/γ−Al2O3 showed
188
Z. Naemi et al./ JNS 2 (2012) 183-189
4. Conclusion
Ag\Al2O3 Nanocomposite have been
successfully synthesized by solution combustion technique. Silver nanoparticles with different amounts (1wt%, 5wt% and 10wt%) were added to alumina, With increasing amount of Ag, the mean size of the Ag and Al2O3 particles in the Ag\Al2O3
nano composite increased and surface area of the Ag\Al2O3 nanocomposite gradually decreased but
mean pore diameter increased while the pore volume was not changed appreciably for this composite, its shows The added silver nanoparticles occupied lattice vacancies and γ -phase for alumina didn’t change. Ag particles were mostly around 3.54 nm in size and clearly shows that the Ag particles are almost uniformly dispersed on the Ag\Al2O3 nanocomposite.
Analysis demonstrates the existence of different states of the Ag species, and increasing synthesis temperature emitted Ag+ species as a result
synthesized sample in 400C0 have good potential
to be used as catalytic with high activities.
References
[1] T. Sekino, K. Nihara, Nanostruct. Mater. 6 (1995) 636–663.
[2] Y. Ji, J.A. Yeomans, J. Eur. Ceram. Soc. 22 (12) (2002) 1927–1936.
[3] S. Komarneni, J. Mater. Chem. 2 (1992) 1219– 1230.
[4] H. Hirano, K. Niihara, Mater. Lett. 26 (1996) 285–289.
[5] H.K. Schmdit, E. Geiter, M. Menning, F. Krug, C. Becker, R.P. Winger, J. Sol–gel Sci. Technol. 13 (1-3) (1998) 397-404.
[6] C. Suryanarayana, Int. Mater. Rev. 40 (2) (1995) 41–64.
[7] F. Capel, C. Moure, P. Duran, A.R. Gounzalez-Elipe, A. Caballero, Appl. Phys. A 68 (1999) 41-48.
[8] X. Bokhimi, A. Morales, O. Novaro, T. López, O. Chimal, M. Asomoza, et al. Chem Mater. 9(11) (1997) 2616-20
[9]Y. Wu, Y. Zhang, L. Zhang, China Particuol. 2(1) (2004) 19–24.
[10] T. Sekino, K. Niihara, Nanostruct Mater. 6 (1995) 663.
[11] S. Komarneni, J Mat Chem. 2 (1992) 1219. [12] T. Sekino, S. Etoh, H. Kondo, YH. Choa, K.
Niihara. Key Eng Mater. 489 (1999) 161.
[13] T. WH, Ch. WB, J Eur Ceram Soc, 16 (1996) 583.
[14] Liu. D-M, Tuan WH. Acta Mater, 44 (1996) 813.
[15] W. H. Tuan, and R. J. J. Brook, Eur. Ceram. Soc. 6 (1990) 31–37.
[16] A. K. Dutta, N. Narasaiah, A.B. Chattopadyaya, K. K. Ray, Ceram Inter, 27(2001) 407.
[17] T. Bala, G. Armstrong, F. Laffir, R. Thornton. Journal of colloid and interface science 356 (2011) 395-403.
[18] T. Qing, LI Rui-xing, Y. Shu, S. Goto, D. Nagai, T. Sato, the Chinese Journal of process Engineering 6 (2006) 4.
[19]Li Zhang, Changbin Zhang, Hong He, Journal of Catalysis 261 (2009) 101-109.
[20]H. J. Tang, F. Q. Wu, H. L. Wang, Y-H Wei, Q-S. Li,Optik 119 (2008) 134–138.
[21]Singanahally, T. Aruna, Alexander S. Mukasyan, Current Opinion in Solid State and Materials Science 12 (2008) 44–50.
[22] F. Bustanafruz, M .Jafar-Tafreshi, M. Fazli, JNS nanostructures kashan, JNS2(2012)27-33.
[23] R.K. Iler, the Chemistry of Silica, John Wiley and sons,1979.
189
Z. Naemi et al./ JNS 2 (2012) 183-189
[25] Sajan D. George, Aji A. Anappara, P.R.S.Warrier, K.G.K.Warrier, P. Radhakrishnan, V.P.N. Nampoori, C.P.G. Vallabhan, Materials Chemistry and Physics, Materials Chemistry and Physics 111 (2008) 38–41.
[26] J.Q. Lu, J.J. Bravo-Suárez, M. Haruta, S.T. Oyama,
Appl. Catal. A 302 (2006) 283.
[27] N. Bogdanchikova, F.C. Meunier, M. Avalos-Borja,
J.P. Breen, A. Pestryakov, Appl.Catal. B 36 (2002) 287.
[28] K. Sato, T. Yoshinari, Y. Kintaichi, M. Haneda, H. Hamada, Appl. Catal. B 44 (2003) 67.
[29] X. She, M. Flytzani-Stephanopoulos, J. Catal. 237 (2006) 79.
[30] K. A. Bethke, H. H. Kung, J. Catal. 172 (1997) 93−102.
[31] T. E. Hoost, R. J. Kudla, K. M. Collins, Appl. Catal. B, 13 (1997) 59-67.