Parameter Measurement
Farzin Asadi1, Nurettin Abut2
Student, Kocaeli University, Kocaeli, Turkey1
Professor, Dept. of Electrical Engineering, Kocaeli University, Kocaeli, Turkey2
ABSTRACT: Switches are heart of power electronics. Plenty of switches are available today. Diode is one of the most wide spread switches which has a lot of application in power electronic and small signal electronics. Diode, has a non-linear I-V characteristics. Diode I-V relation is governed by Shockley diode equation. Two parameters are in Shockley equation: Reverse saturation current(Is) and emission coefficient(n). This parameters are vary from device to device.
Reverse saturation current is very small for modern silicon diodes, generally in the range 10-12 A to 10-8A, very hard to measure it directly. A simple method for measuring these parameters is proposed here. No expensive measurement device is required. This method can also be used for fault detection of power diodes. Laboratory results shows the success of given method.
KEYWORDS: Emission coefficient, Power diodes, Reverse saturation current, Shockley equation.
I.INTRODUTION
Power electronics is the application of solid-state electronics to the control and conversion of electric power.
power conversion systems can be classified according to the type of the input and output power:
AC to DC (rectifier),
DC to AC (inverter),
DC to DC (DC-to-DC converter),
AC to AC (AC-to-AC converter).
Plenty of power switches have been introduced: Diode, Silicon Controlled Rectifier(SCR),Thyristor,Gate Turn Off Thyristor(GTO),Bipolar Junction Transistor(BJT),Power MOSFET, etc.
A computer simulation is an attempt to model a real life or a hypothetical situation on a computer. Power electronic circuits can be simulated in Matlab®,Psim®,Multisim®,etc.
Accuracy of simulation,i.e. how much simulation results are similar to laboratory results, is greatly dependent on accuracy of model which has been used.
Diode is an important, unipolar, uncontrolled switch which is used in many converters. A cheap and simple method of measuring diode parameters is described here.
II.DIODE I-V CHARACTERISTICS
ISSN (Print) : 2320 – 3765 ISSN (Online): 2278 – 8875
I
nternational
J
ournal of
A
dvanced
R
esearch in
E
lectrical,
E
lectronics and
I
nstrumentation
E
ngineering
(An ISO 3297: 2007 Certified Organization)
Vol. 5, Issue 8, August 2016
where
I is the diode current,
IS is the reverse bias saturation current,
VD is the voltage across the diode,
VT is the thermal voltage, and
n is the ideality factor, also known as emission coefficient. The ideality factor n typically varies from 1 to 2 (though can in some cases be higher), depending on the fabrication process and semiconductor material used.
The saturation current (or scale current), more accurately, the reverse saturation current, is that part of the reverse current in a semiconductor diode caused by diffusion of minority carriers from the neutral regions to the depletion region. This current is almost independent of the reverse voltage[4].
IS, the reverse bias saturation current for an ideal p–n diode, is given by [2]:
where
e is elementary charge
A is the cross-sectional area
Dp,n are the diffusion coefficients of holes and electrons, respectively,
ND,A are the donor and acceptor concentrations at the n side and p side, respectively,
ni is the intrinsic carrier concentration in the semiconductor material,
τp,nare the carrier lifetimes of holes and electrons, respectively.
The saturation current is not a constant for a given device; it varies with temperature. The thermal voltage VT is approximately 25.85 mV at 300 K. At any temperature it is a known constant defined by [1] :
Figure 1: Diode I-V characteristics.
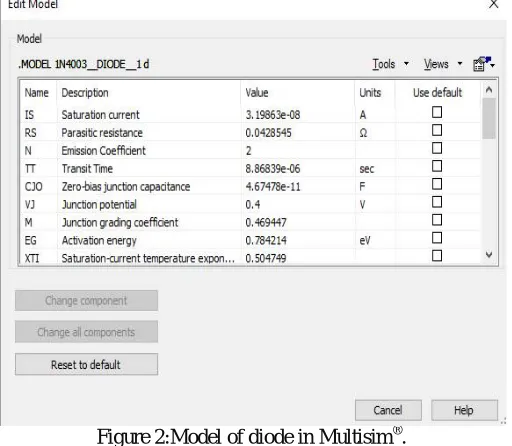
Diode can be in either forward bias(VD>0,I>0) or reverse bias (VD<0,I<0). There is an another point which must be mentioned here: in reverse bias region, where diode voltage is well below break down voltage diode current is nearly constant irrespective of diode voltage. It means diode can be modeled as a constant current source of value IS. Saturation current(Is) and emission coefficient(n) are diode parameters that must be extracted from measurements in order to model diode in simulation programs. For example, Multisim® model of 1N4003 diode is shown in figure 2.As seen saturation current (Is) and emission coefficient (n) must be entered.
Figure 2:Model of diode in Multisim®.
Here is the definition of problem which this paper will focus on :"For a given diode, find a method to measure saturation current(Is) and emission coefficient(n)." Suggested method is studied in the next section.
III.PROPOSED METHOD
ISSN (Print) : 2320 – 3765 ISSN (Online): 2278 – 8875
I
nternational
J
ournal of
A
dvanced
R
esearch in
E
lectrical,
E
lectronics and
I
nstrumentation
E
ngineering
(An ISO 3297: 2007 Certified Organization)
Vol. 5, Issue 8, August 2016
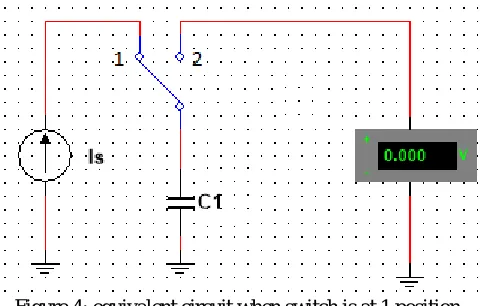
Figure 3:suggested topology.
V1 is a value lower than reverse break down voltage of diode. For instance break down voltage of 1N4007 is about
700 volts, so V1=10 V can be a choice. It is assumed that capacitance of capacitor is known. At t=0 ,switch is in the 1
position. At t=0, Capacitor C1 has no charge,i.e. its voltage is zero. Equivalent model of this region is drawn in figure 4.
Figure 4: equivalent circuit when switch is at 1 position. Equation of instantaneous capacitor voltage is given by:
Q
c1= C
1
V
c1 (4)Q
c1= I
s
t
(5)
) 6 ( 1
1 ICs t
c
V
which conservation of electric charge is used for derivation of above formula. After time ∆t is passed ,key is
switched to position 2,where capacitor voltage can be read. Reading must be done as quickly as possible in order to avoid discharge of capacitor through voltmeter internal resistance. Saturation current can be calculated as:
) 7 ( 1 1 t C c V s I
Figure 5:circuit for measuring emission coefficient(n).
Here V1 is a variable DC power supply. V1 forces D1 into the forward bias region. Diode voltage and currents are
measured for different V1.So an I-V table results. Applying Mean Square Error(MSE) algorithm to data's in this table,
emission coefficient of diode can be calculated[6].
In order to do this job, Matlab® and Curve fitting toolbox is used.
IV.LABORATORY RESULTS
Here is the results of applying proposed method to a power diode. Diode under test is 1N4007. C1 is 9.4 uF,V1=10V
and ∆t=600s.Temperature of room is equal to 24˚C(= 297.15K). After 600 seconds capacitor voltage is 2.65V.
Multimeter internal resistance is 10MΩ.When it connects to 9.4uF capacitor, time constant is:
s C
R 194
(8)
Which is sufficiently large to avoid discharge of capacitor in the reading interval( Generally, reading takes 2-3 seconds). Applying equation 7, gives Is=4.15×10⁻⁸A or Is=4.15×10⁻⁵mA . So I-V relation of diode under test(at
T=297.15K) is as follows:
) 1 . ( 8 10 15 .
4
nVT
D V
e
I
(9) whereVT=25.6mV and 39.0625
1
T V
.
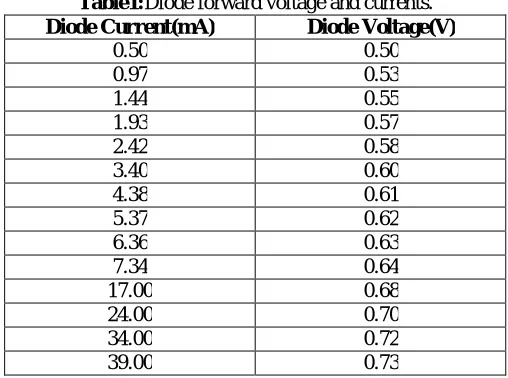
In equation 9, emission coefficient (n) is unknown and must be calculated. Table 1, gives measured current-voltage pairs:
Table1:Diode forward voltage and currents.
Diode Current(mA) Diode Voltage(V)
ISSN (Print) : 2320 – 3765 ISSN (Online): 2278 – 8875
I
nternational
J
ournal of
A
dvanced
R
esearch in
E
lectrical,
E
lectronics and
I
nstrumentation
E
ngineering
(An ISO 3297: 2007 Certified Organization)
Vol. 5, Issue 8, August 2016
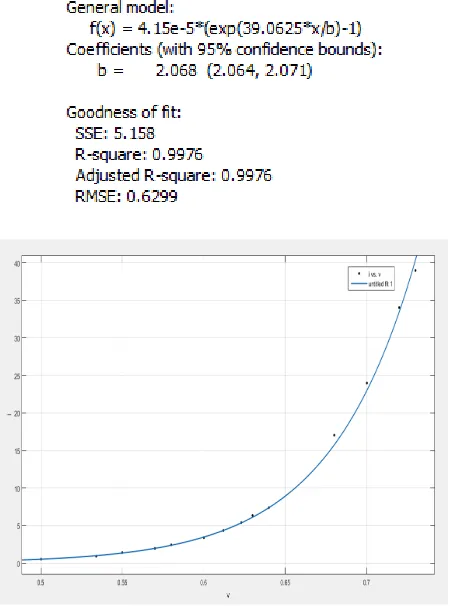
This data are shown graphically as figure 5.
Figure 5:Forward I-V characteristics of diode. using Matlab® Curve fitting toolbox n=2.068. Here is the results of data fitting process:
Figure 6:Results of fitting data. So the device under test I-V equation is as follows:
V. ANOTHER APPLICATION
If result of measurement is compared with standard range of must be values, then large deviation can be a sign of fault in diode.
VI. CONCLUSION
In this paper, a method for diode parameter measurement is suggested. Method is fairly easy and cheap. Expensive measurement equipments are not required. This method can be used in order to do more accurate simulations(i.e. entering measured parameters to simulation software's for more accurate simulations), measurement of diode parameters in research laboratories or even fault detection.
REFERENCES