58 Volume-4, Issue-1, February-2014,ISSN No.: 2250-0758 International Journal of Engineering and Management Research
Available at:
Page Number: 58-62
Estimation of Underwater Environment and Depth Determination using
SOnic Detection and Ranging
Ajish Karthikeyan1, Dr. B. Ramachandran2, K. R. Rajendrakumar3 1
Assistant Professor, Dept of E & C, JCT College of Engineering & Technology, INDIA 2
Professor, Dept of E & C, SRM University, Kattankulathur, INDIA 3
Engineer, Special Products Group, KELTRON, Karakulam, Trivandrum, INDIA
ABSTRACT
As the electronic technology gets advanced day by day the methodologies too should update. For the purpose of ranging various methods such RAdio Detection And Ranging (RADAR), LIght Detection And Ranging (LIDAR) and Sonic Navigation And Ranging (SONAR) etc is used. Later, by adapting the earlier technologies and further by modifying the purposes of detection and ranging in navigation, the technology of Sonic Detection And Ranging (SODAR) is used. The SODAR can be defined as a child of SONAR and also a twin of Echo sounder. The echo-sounder is used only for ranging. But the SODAR use low frequency wave of 33 KHz to measure the underwater depth and also to detect the objects below water medium. So this work comprises with the designing of a SODAR system and to evaluate the underwater sea floor environment and also to measure the depth of the sea floor.
Keywords - SODAR, Echo-sounder, transceiver, interface, transducer, DSP processor.
LITERATURE REVIEW
The use of various electronic detection techniques finds their application in ranging and detection scenario in navigation. There is enormous techniques to detect objects and particles in the atmosphere where as fewer techniques for object detection in below water [4] [8]. The techniques of sonar in the early and single beam sodar nowadays finds more applicable in underwater detection and ranging [1]. The installations of sodar in underwater vehicles were used early as the system uses high frequency ultrasonic waves [2] [7]. By studying the risk factors in this method, the equipment was further modified and suited for installing in ships and the depth as well as bottom surface were detected by sending a low frequency waves. The further upgradations such as multi beam, 3D display are lately. The side beam technique is more used in the family of both sonar and sodar, as they have fewer losses [5] [8]. Studies and works
are going on with multi source high concentrated beam propagation even though they are costly in installation and upgrading for finding resources too[3] [6].
I.
INTRODUCTION
The objective of the work is to estimate the underwater sea floor environment and also to measure the depth of the sea floor by installing the SODAR equipment in a ship. For the long range transmission and reception of echo back, a low frequency of 33 KHz is used. The ultrasonic waves are transformed into acoustic waves and are transmitted into the acoustic medium. As it travels towards the depth, after hitting the target the waves gets reflected back and reaches the transducer. The transducer is a bi-directional transducer that converts the electrical energy to acoustic energy during transmission and back converts acoustic energy to electrical energy during reception. From the received echo signal the depth of the sea floor and sea bed surface variations can be measured. The arrangement of multibeam transducers helps in the estimation of objects below the water surface.
II.
ASSEMBLING A SODAR
59 Fig.2.1. SODAR block diagram
The inter-processing between the three cards make in the transmission and reception of pulses and their processing. The DSP unit in the transceiver card generates a low frequency signal of 33 KHz that is used for transmission purposes. The various card compositions are as follows.
(a)The DC-DC converter card
The conversion of DC voltage for the analog and digital circuits in the transceiver card, power amplifier module 33 KHz card and power amplifier 33 KHz card is done at this unit. The available DC voltage of 24 V is converted to +12VDC and -12VDC.
(b)The Transceiver card
The Transceiver card consists of the power unit, central processing unit (DSP unit), transmitter and receiver section and an interfacing section.
Fig.2.2. Transceiver block diagram
The further conversions are done with the help of various IC’s (voltage regulators). The IC LM7805CK makes the voltage regulation from +12VDC to +5VDC, LM7905CT for -12VDC to -5V, LM350AT for +12VDC to +3.3VDC and LM137H for regulating 12VDC to -1.65VDC. The +3.3VDC analog is used for giving reference value to the Digital Signal Processor.
The central processing unit is the core that has the DSP processor in it and the generation of the pulse is done with a crystal placed in the card. The central processing unit maintains a link between the transmitter unit and receiver unit. A trigger is set to work in high and low. During the time of signal generation the trigger signal will be logic low and all the other time it is kept as logic high.
During the time of signal transmission the DSP will interface with the DAC with the provided input/output lines by the Digital Signal Processor. The transmitter block diagram in figure.2.3 gives the detail about transmission operation.
Fig.2.3. Transmitter block diagram
The bipolar output signal that swings both in the positive and negative cycle is passed through a current to voltage converter, which acts also as a buffer. The converted signal is amplified using an op-amp and further passed through a low pass filter to filter out the higher frequency components in the amplified signal.
In the receiver unit a Time Variant Gain (TVG) is provided in such a way that it keeps the attenuation to be maximized in the initial stages. As the receiving circuit contains high fixed gain amplifiers, the overall gain of the received signal will be comparably small and as time increases the attenuation loss by the TVG channel reduces that helps in obtaining a received signal with increased gain as shown in figure 2.4.
Fig.2.4. Receiver block diagram
The attenuators and fixed gain amplifiers helps in separating and minimize the noise components, there by helps in attaining a better signal strength to a constant level, so that the processor can detect the reflected echo signals easily.
The function generator gives a signal to the digitally controlled switch by which it checks the status of any fault in the system. The Fault Detection Fault Location (FDFL) is provided for each card in the system.
60 standard RS232 interface with the help of MAX233AEPP
IC.
(c)The Power amplifier card
The power amplifier module 33 KHz is mounted in a Power amplifier slot. It consists of a Power Amplifier card 33 KHz assembly and a pot core transformer, is shown in figure 2.5.
Fig.2.5. Power amplifier module
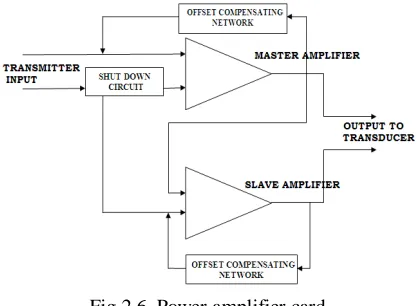
The output from the transmitter section is given to the power amplifier module and latter on to the power amplifier card placed inside the module. The Power Amplifier card is configured in bridge that makes a chance of having an offset of DC voltages at the output of the power op-amp at the time of power ON. As the power amp card 33 KHz is connected with pot core transformer as its load, it is dead short circuited for DC voltages even in the range of millivolts. The figure.2.6 shows the working of the power amplifier card. To make a compensation for this load dead short an offset compensation circuit is provided with the help of two op-amps. Each section (both master and slave) is configured as an integrator that acts as a low pass filter allowing only low frequency components to the inverting input terminal of the op-amp section. This helps in making an offset compensation in the power amplifier card.
Fig.2.6. Power amplifier card
The pot core transformer usually made of ferrite. The design of the core has a shielding effect, such that it prevents the radiations and thus reduces the electromagnetic interference.
III. TRANSDUCER UNIT
A transducer is any device that converts one form of energy into another. In sodar the transducer unit consists of a pair of transducer units that converts electrical energy
into acoustic (pressure) energy during transmission and the reverse conversion of acoustic energy into electrical energy. The types of transducers involved in sodar energy conversion process are tactile transducer, that converts electric signal into acoustic signal and a piezoelectric transducers, kept in the water to receive the reflected echo signals from the target that converts the acoustic signal back to electric pulse.
IV.
WORKING MECHANISM OF
SODAR
The functioning of sodar starts with the generation of pulse from the DSP unit. The generated pulse is further amplified and processed in the transmitter unit and sent to the transducer for transmission. As the transducer gets the electric energy into it, the conversion of electric energy into acoustic energy happens. The acoustic energy is transmitted into the water medium as vibrations. The low frequency of 33 KHz makes the transducer to propagate the signal to long distance. Packages of five pulses constitute a single larger pulse that has duration of 1ms and in between each pulse a reverberation period of 15ms is kept. The signal after hitting the seafloor and objects in the water gets reflected back with certain amount of loss in the signal strength. The reflected signal is received by the transducer and send back to the processing unit for displaying in the front panel.
V.
MEASUREMENT OF DEPTH AND
SEAFLOOR ESTIMATION
(a) Front Panel
Thefront panel design made in the panel pc at the user end displays the seafloor distance (depth) and visual of the underwater environment and objects immersed in the water.
(b) Depth Measurement
The depth is measured by calculating the time of echo reception for the generated signal and the velocity of sound in water.
61 Fig.5.1. Screen shot taken of depth measure
(c) Seafloor Estimation
The estimation of seafloor environment and tracking of objects below the water surface is done with multibeam transducers. The beam produced from the transducers give a picture of the objects below the surface of the sea in the monitor that helps in the distinguishing of all the static and moving bodies in water.
Fig.5.2. Pictorial representation of depth measurement in test mode.
The figure 5.2 shows the screen shot taken while estimating and displaying of sea floor in a testing condition of 30 m in a tank with sediments placed at the bottom. The irregularities in the slope represent the presence of rock or stone among the sediment particles.
Table.5.1. Range selection table
COUNTS 0 1 2 3
DEPTH WINDOW
10 20 50 100
PULSE WIDTH
454µs 1.6ms 1.6ms 4ms
MAXIMUM SEARCH
RANGE
17.9928 30.1665 72.7209 151.439 4
NO. OF CYCLES
15 52 52 132
The table 5.1 shows the availability of maximum range with the selected window size and pulse duration. The pings in a cycle are fixed as five pings and the number of cycles only is varied.
VI.
CONCLUSION
Thework comes to final stage with the designing of a SODAR system and its underwater evaluation.As this work concludes with the measuring the depth and estimation of sea bottom environment using sonic method of detection and ranging, a system earlier used in wind profile measurement is also capable in acoustic environment. This makes the SODAR system compatible for both in atmospheric and acoustic conditions, which makes it a little superior over other navigation, detection and ranging techniques. There can further modifications done in the system for positioning the objects or resources by implementing a Global Positioning System (GPS) module.
REFERENCES
[1] A. R. Amiri Simkoei, M. Snellen, D. G.Simons “Principal Component Analysis of Single-Beam Echo-Sounder Signal Features for Seafloor Classification ” IEEE Oceanic Engineering Society, Volume : 36 , issue:2, On page(s): 259 – 272, ISSN: 0364-9059 , April 2011.
62 Institute of Engineering and Technology, Iran,Volume : 5 ,
issue:6,On page(s): 613 - 625, ISSN:1751-8784, July 2011. [5] Ozcelik Ceyhun, Arisoy Yalcin “Remote sensing of water depths in shallow waters via artificial neural networks” in Estuarine, coastal and shelf science, 26 May 2010.
[6] Rahul Sharma, S. Jai Sankar, Sudeshna Samanta, A.A. Sardar. D. Gracious “Image analysis of seafloor
photographs for estimation of deep-sea minerals” Geo-Mar. vol.30 (6), 617-626, May 2010.
[7] Aubrey L. Anderson and Fa S. Dwan “Quantitative estimation of seafloor backscattering strength using long‐range sidescan sonar data” J. Acoust. Soc. Am. Volume 88, Issue S1, pp. S107-S107 (1990); (1 page) [8]R. J. Urick, "Principles of Underwater Sound", 3rd edition, McGraw-Hill, 1983.