Amelia Carolina Sparavigna (Correspondence)
[email protected], [email protected]
+
1Department of Applied Science and Technology, Politecnico di Torino, Italy
Abstract: Some recent papers proposed the use of Google Earth in the study of physics, in particular of the behaviour of waves. In fact, in satellite views of coastal zones of oceans and seas, we can easily observe several undulatory phenomena, such as diffraction and interference, created by the surface waves. In this paper, we will show that, with a careful examination of the time series of Google Earth, we can also observe oceanic internal waves. Therefore, we propose to study them, with the aim of attracting students’ interest to subjects of the physics of waves that are beyond those usually discussed in the courses of undergraduate education.
Keywords: Teaching Physics, Satellite Images, Google Earth, NASA, Internal waves, Oceans.
1. Introduction
Some recent papers proposed the use of satellite images, available from the web-services of Google Earth or Google Maps, to show some real cases suitable for teaching several disciplines, including social and economic sciences [1-5]. For geophysics, the use of satellite images is obvious. As they are or after some processing, these images show the textures of the Earth surface [6-8].
The satellite maps provide several possibilities for teaching physics too. For instance, Reference 1 is proposing the use of them aiming to increase the appeal of physics to students, even bringing to life the stories of famous scientists by paying a “flying visit to their homes” using Google Earth. The author of [1] suggests visiting Woolsthorpe Manor, the birthplace of Sir Isaac Newton. For studying waves, Reference 2 shows, by means of several images from Google Earth of coastal zones of seas and oceans, how satellites are recording the behaviour of waves. Reflection, refraction, diffraction and interference are easy to observe. Another paper is proposing the satellite images for an evaluation of the speed of boats, applying a simplified approach to the Kelvin wave patterns [3].
Google Earth is easy to use for studying surface and, as we will see here, oceanic internal waves too. Unfortunately, it cannot help in teaching internal waves in the atmosphere. However, other sites exist, such as Earth Observatory or Earth Snapshot, which are suitable for this purpose [9-11]; the first is a NASA web site, whereas the second is collecting images by EOSNAP/Chelys. In this paper then, as previously mentioned, we will see that in the time series of images provided by Google Earth, we can observe internal waves of seas and oceans. With the
use of the examples here proposed and stimulating for searching other cases, we aim attracting students’ interest to the physics of waves, including subjects that are beyond those usually discussed in the courses of undergraduate education.
2. Internal waves
Internal waves are gravity waves that oscillate within a fluid medium, rather than on its surface. In seas and oceans, due to changes of local temperature or salinity concentration, the water can have a density varying with height. If inside the fluid medium there is a horizontal discontinuity of density, we can have waves travelling on it. The speed of these waves is depending on the difference of density, below and above the discontinuity. If the density of the fluid is changing continuously, the waves can propagate vertically as well as horizontally through it [12].
When internal waves are propagating along an interface between two layers of different density, these waves are also known as “interfacial internal waves”. If the interfacial waves have a large amplitude, they are defined as “internal solitary waves”. Theoretical studies and experimental observations tells that some solitary waves have properties analogous to those of elementary particles, and therefore, these waves are also known as “solitons”. In the western Mediterranean, solitons are regularly generated near the Strait of Gibraltar, with amplitudes of 50 to 100 m and wavelengths of 2 to 4 km. The arcs of the Andaman and Nicobar Islands [13-16] in the Bay of Bengal are also producing solitons [13-16].
3. Some theory on interfacial waves
http://www.ijSciences.com Volume 3 – September 2014 (9)
27
density, able to exhibit waves. When the densitygradient jumps between the layers and it remains constant within them, the waves are interfacial waves. Easy to discuss, these waves are a good model to explain the behaviour of some natural environments. Many articles and documents on this subject are freely available on the web; for instance, at [17-19], we find how to model and determine the dispersion relations for interfacial waves, in the ocean and atmosphere.
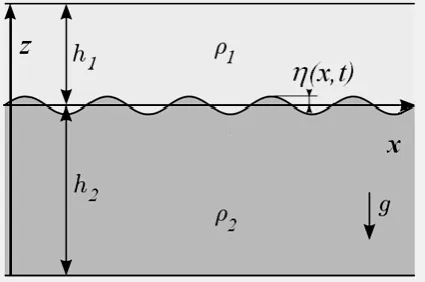
Let us consider a stratified, two-layer, bounded system as in Figure 1. Both upper and lower boundaries are rigid. In the case, if we are searching for a simple harmonic motion, we can write the
interface displacement as
) (
cos )
,
(x t a kx
t
, where k and
are theinterfacial wave number and frequency respectively, and a is the amplitude.
Figure 1 - A two-layer system with rigid upper and lower boundaries.
Between rigid boundaries, the dispersion relation is [17]: 0 ) ( ) tanh( 1 ) tanh( 1 1 2 2 2 2 1 2
1 g kh k kh k (1)
The simplest case we can have is a two-layer fluid where the interface between the two layers is taken to be situated at z=0. Assuming the domain unbounded, the dispersion relation becomes [18]:
k g gk ' ) ( 1 2 1 2 2 (2)
Note that the dispersion depends on a reduced gravity
g
'
, based up the density difference of the upper and lower layers. Dispersion relation (2) is the same of that we obtain for deep water surface waves, where we haveg
'
g
.4. Oceanic internal waves and satellites
As told in [20], ocean can often be approximated as a two-layer fluid, with the two layers being the mixed
layer and the deep ocean. The mixed layer is the upper volume of water, with a depth usually ranging between 25 and 200 m, where the density is about the same as at the surface. This layer owes its existence to the mixing caused by waves and turbulence created by wind stresses and heat fluxes. The thermoclines separate the mixed layer and the deep ocean. If the media are bounded above by a free surface, the dispersion relation allows the free surface and the interface to oscillate. Two modes exist: a barotropic mode, where the two surfaces move in phase with one another, with the free surface amplitude larger than the amplitude of the interfacial wave, and a baroclinic mode, where the two waves have opposite phase. In this case, we find an interfacial wave higher than the free surface wave [19]. The dispersion relations are more complex than those previously given are.
In the ocean then we have cold, dense and salty waters in the deep, and warm and fresher waters near the surface, separated in two layers behaving like different fluids. Reference 20 explains that, when internal waves are created in the lower layer of water, they move the water in the upper layer, which flows down the crests and sinks into the troughs. This motion is creating alternating lines of calm water at the crests and rough water at the troughs, and this is what makes the internal wave visible in satellite images; the calm and smooth water reflects more light back to the satellite, giving a bright stripe, whereas the rough water is scattering light in all directions, forming a dark line. Reference 21 is also telling that these waves influence the concentration of biological materials and natural oils, which are alternately dispersed and concentrated in a wave pattern. These natural materials change the amount of reflected light too, revealing the underlying internal waves.
Internal waves have heights and wavelengths that can be quite large. The origin of the waves can be the tidal movement, but also turbidity currents, wind or even passing ships. As explained in [16], since waves depend on gravity, a local mass oscillation can appear more easily at an internal interface than at the sea-surface. The difference in density between layers of water is smaller than the density difference between water and air, and then the energy required to have an internal waves is less than that required for surface waves of similar amplitude.
5. Examples
http://www.ijSciences.com Volume 3 – September 2014 (9)
28
such as in the Figure 3. In the lower panel, we havethe interference of two trains of internal waves (the central part of the image is enhanced using GIMP, the GNU Image Manipulation Program, www.gimp.org).
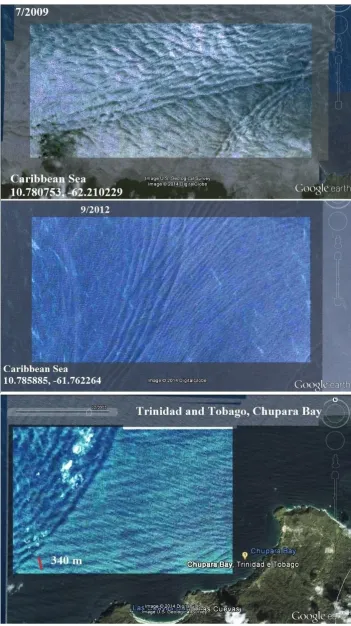
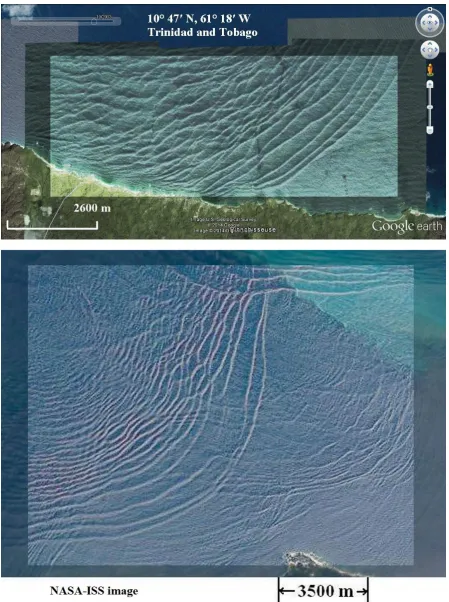
In the Figure 4, we have another example from the Caribbean Sea near Trinidad and Tobago. We can compare the Google Earth image with one of this area from Ref.22, which is giving a photograph taken from the International Space Station (ISS). As stressed in [22], it is true that internal waves produce enough of an effect on the sea surface to be seen from space, “but only where they are enhanced due to reflection of sunlight back towards the International Space Station”. Ref.22 explains that it is probably the shelf break near Tobago, which is causing these internal waves. The shelf break is the step between the shallow sea, which is around continents and islands, and the deep ocean; this is the line where tides usually start to generate internal waves.
In the Figures 5 and 6, we report some internal waves near the coast of Peru. Let us note that the original images are quite dark and then it is necessary an enhancement using some software [23].
6. In the atmosphere
The internal waves exist in the atmosphere too. These waves and other perturbations can be observed when they produce some clouds. As a layer of air is subjected to a perturbation, such as a wave, it oscillates up and down in the atmosphere. If there is enough moisture, clouds will form at the cool crests of the wave. In the descending part of the wave, the clouds disappear due to an adiabatic heating. Therefore, in the atmosphere, some clouded and clear bands are visible [24,25]. The wave clouds typically form when a mountain or an island, or even another mass of air, forces air to oscillate. Google Earth is not suitable for the study of waves in the atmosphere, because the images are usually given without clouds, but we can use the images of the Earth Observatory or Earth Snapshot, and there we can find several images of atmospheric internal waves.
References
1. B.A. Ryder, Journey to the Ends of the Earth, Phys. Educ., 2007, Volume 42, Pages 435-7.
2. F. Logiurato and B. Danese, Physics of Waves with Google Earth, AIP Conf. Proc., 2010, Volume 1263, page 208.-211; F. Logiurato, Teaching Waves with Google Earth, arXiv:1201.0001, physics.ed-ph, 24 Dec 2011.
3. C.E. Aguiar and A.R. Souza, Google Earth Physics, Phys. Educ., 2009, Volume 44, Pages 624-626.
4. M.F. Goodchild, What Does Google Earth Mean for the Social Sciences?, in Geographic Visualization: Concepts, Tools and Applications, M. Dodge, M. McDerby and M. Turner Editors, John Wiley & Sons, Ltd, Chichester, 2008.
5. B. Thankachan and T. Franklin, Impact of Google Earth on Student Learning, International Journal of Humanities and Social Science, 2013, Vol. 3, Issue 21, Pages 11-16.
6. A.C Sparavigna, Crater-like Landform in Bayuda Desert (a Processing of Satellite Images), arXiv:1008.0500, physics.geo-ph, 2010.
7. A.C. Sparavigna, Craters and Ring Complexes of the North-East Sudanese Country, arXiv:1008.3976, physics.geo-ph, 2010. 8. A.C. Sparavigna, Merowe Dam and the Inundation of Paleochannels of the Nile, arXiv:1011.4911, physics.geo-ph, 2010. 9. Earth Observatory, NASA, http://earthobservatory.nasa.gov/ 10. Earth Snapshot, OSNAP/Chelys, http://www.eosnap.com/ 11. A.C. Sparavigna, Internal Waves and Vortices in Satellite Images, arXiv:1202.5770, physics.pop-ph, 2012.
12. Vv.Aa., Internal Waves, Wikipedia.
13. Office of Naval Reasearch, The Strait of Gibraltar, in An Atlas of Oceanic Internal Solitary Waves, May 2002, Global Ocean Associates, Pages 99-118.
14. D.M. Farmer and L. Armi, The Flow of Atlantic Water through the Strait of Gibraltar, Progress in Oceanography, 1988, Volume 21, Issue 1, Pages 1-105.
15. J.R. Apel, Observations of Internal Waves Surface Signatures in ASTP Photographs, Apollo-Soyuz Test Project Summary Science Report, 1979, Volume II, Pages 505-509, El-Baz and Warner Editors, NASA SP-12, NASA, Washington DC.
16. A.R. Osborne and T.L. Burch, Internal Solitons in the Andaman Sea, Science, 1980, Volume 208, Issue 4443, Pages 451-460.
17. www-welafi.ifh.uni-karlsruhe.de/ students/ bounded_interfacial_waves.pdf
18. www.ifh.uni-karlsruhe.de/lehre/ envflu_II/Students/ocen689ch10.pdf
19. A. DeCaria, Atmospheric Dynamics II, Lecture Notes, 2013, snowball.millersville.edu/ ~adecaria/ ESCI343/esci343_main.html 20. Vv.Aa., Internal Waves in the Indian Ocean, in Visible Earth, A Catalog of NASA Images and Animations of Our Home Planet, visibleearth.nasa.gov
21. O. Nielsen, Ocean Waves, 2012, whatonearth.olehnielsen.dk/ oceanwaves.asp
22. Vv.Aa., Internal Waves off Northern Trinidad, February 4, 2013, NASA Earth Observatory, earthobservatory.nasa.gov 23. R. Marazzato and A.C. Sparavigna, Astronomical Image Processing Based on Fractional Calculus: the AstroFracTool, arXiv:0910.4637, astro-ph.IM, 2009.
http://www.ijSciences.com Volume 3 – September 2014 (9)
29
Figure 2- Internal waves in the Andaman Sea, off North Reef Island, as we can see in images of Google Earth. Thehttp://www.ijSciences.com Volume 3 – September 2014 (9)
30
Figure 3 – Long waves in the Caribbean Sea, that we can find in Google Earth. The central part of each panel washttp://www.ijSciences.com Volume 3 – September 2014 (9)
31
Figure 4 – Internal waves near Trinidad and Tobago. In the upper panel, we see the Google Earth image. We canhttp://www.ijSciences.com Volume 3 – September 2014 (9)
32
Figure 5 - Internal waves near the coast of Peru. The original satellite images had been processes to enhance theirhttp://www.ijSciences.com Volume 3 – September 2014 (9)

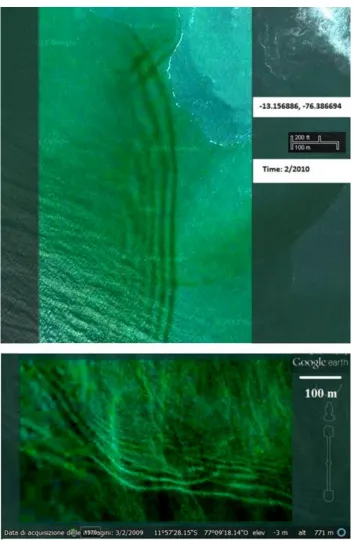
![Figure 6 – Other internal waves in the ocean off Peru. The panels show the Google Earth images after an image processing with AstroFracTool [23] and GIMP](https://thumb-us.123doks.com/thumbv2/123dok_us/9860591.1973284/8.595.91.520.80.573/figure-internal-panels-google-earth-images-processing-astrofractool.webp)
