Published online October 30, 2014 (http://www.sciencepublishinggroup.com/j/ijiis) doi: 10.11648/j.ijiis.20140304.12
ISSN: 2328-7675 (Print); ISSN: 2328-7683 (Online)
Estimating depth of anesthesia from EEG signals using
wavelet transform
Nusrat Ferdous
1, *, Md. Adnan Kiber
21
Department of Electronics and Communication Engineering, Institute of Science and Technology, Dhaka, Bangladesh
2
Department of Applied Physics, Electronics and Communication Engineering, University of Dhaka, Dhaka, Bangladesh
Email address:
[email protected] (N. Ferdous), [email protected] (Md. A. Kiber)
To cite this article:
Nusrat Ferdous, Md. Adnan Kiber. Estimating Depth of Anesthesia from EEG Signals Using Wavelet Transform. International Journal of Intelligent Information Systems. Vol. 3, No. 4, 2014, pp. 40-44. doi: 10.11648/j.ijiis.20140304.12
Abstract:
Electroencephalogram (EEG) is the brain signal containing valuable information about the conscious and unconscious states of the brain, which may provide a useful tool to measure depth of anesthesia. However, raw EEG signals received in various states of consciousness cannot be distinguished visually. In this paper an approach is presented to find out difference between EEG signals in fully awake and in deep sleep conditions with respect to the coefficients of wavelet transform. Continuous wavelet transform of the raw EEG signal obtained at different conscious state of a human subject have been performed. Statistical analyses were then performed on coefficient values to determine the differences between the sleep state and the awake state. From statistical t-test analysis significant difference of the two state of consciousness was found.Keywords: Anesthesia,
EEG, Wavelet Transform, T-Test1. Introduction
The goal in the administration of general anesthesia is to provide a stage of reversible unconsciousness with adequate analgesia and muscle relaxation for surgical procedures in such a way that it does not jeopardize the patient's health. Anesthesiologists face challenges to provide optimal working condition to the surgeon i.e. proper level of anesthesia / unconscious state of the patient, ensuring patient’s safety and comfort. High volume of anesthetic agents may drive the patient into a deep anesthesia state which may lead to comma, or complicate the re-emergence to normal conscious state by lingering the feeling of nausea, vomiting or less of motor response after the operation is over. On the other hand, applying a low volume of such drug can put the patient near to the conscious state, which may end up with the patient being awakened during the surgery. Anesthesiologists control the depth of anesthesia by observing symptoms such as blood pressure, heart beat, evoked response, response to verbal questions, body movement and breathing etc [1].
It is commonly accepted that anesthesia is comprised of at least three functional constituents, namely, immobility, analgesia and hypnosis. The hypnosis describes the drug induced unconsciousness and all anesthetic drugs depress cognitive processing and thus provoke loss of consciousness
[2].
The process of monitoring depth of GA and administration of a general anesthetic during surgery is a closed-loop control system where the human is responsible for reasoning and action. The anesthetists play the roles of controller and actuator by deciding on the amount of anesthetic and when to administer it. On the other hand, the activity of monitoring is performed automatically by commercially available DGA monitors. Together they form a closed-loop control system. In the last decade several experiments have been performed, where anesthesia was controlled in a closed-loop control system without human interference. Although these experiments were relatively successful and represent a proof of principle, there is still a long way to the autonomous commercially available depth of General Anesthesia (GA) control system. Additionally, these experiments raise new questions, which have been only partially addressed so far. For example, the challenge is now to establish fully the safety, efficacy, reliability and utility of closed-loop anesthesia for its adoption into the clinical environment.
41 Nusrat Ferdous and Md. Adnan Kiber: Estimating Depth of Anesthesia from EEG Signals Using Wavelet Transform
information about the depth of unconsciousness level after the application of drug [3].
In order to avoid complex and time consuming interpretation of raw EEG signals a common approach is to extract a single univariate value (if possible) that represents the patient’s depth of anesthesia. Since there is no gold standard for measuring the depth of anesthesia, various analytic techniques are used to estimate this value which is derived in such a way that the resulting quantitative value is sufficiently correlates to the anesthesiologist’s qualitative assessment of patient’s state of unconsciousness [3].
There are few EEG based practical approaches to determine the depth of anesthesia. Auditory Evoked Potential (AEP) in which the excitability of a patient is measured based on his response to the audio stimulus. The Bispectral Index (BIS) is one of the most talked parameter, which represents the coupling of EEG frequencies and gives a dimensionless value in the range of 0-100, which relates to deep anesthesia to consciousness. Narcotrend value has recently been presented which monitor the sleep stages using Kugler’s classification and denominator skill to classify EEG patterns into different classes [1]. The Wavelet based anesthetic value is also been recently been introduced to estimate the depth of anesthesia estimated from the EEG data [3].
These algorithms to estimate depth of unconsciousness have not been published fully or not at all. There are many arguments both in favor and against these algorithms as none of them clearly define a gold standard to estimate the level of unconsciousness after the application of drugs [3].
In this research some work is done in order to pave the way for the development of algorithm and thereby designing anesthesia monitoring system.
2. EEG Rhythms and Waveforms
The human brain is the most complex organic matter known to mankind. An early discovery established that the brain is associated with the generation of electrical activity which is clinically known as electroencephalogram (EEG). So far, no single biological or mathematical model has been put forward which fully explains the diversity of EEG patterns, and, accordingly, EEG interpretation largely remains a phenomenological clinical discipline. The diversity of EEG rhythms is enormous and depends, among many other things, on the mental state of the subject, such as the degree of attentiveness, waking, and sleeping. The rhythms are conventionally characterized by their frequency range and relative amplitude.
The amplitude of the EEG signal is related to the degree of synchrony with which the cortical neurons interact. Synchronous excitation of a group of neurons produces a large-amplitude signal on the scalp because the signals originating from individual neurons will add up in a time-coherent fashion. Repetition of the synchronous excitation results in a rhythmic EEG signal, consisting of large-amplitude waveforms occurring at a certain repetition rate.
On the other hand, asynchronous excitation of the neurons results in an irregular-looking EEG with low-amplitude waveforms. In both cases, the excitation may very well involve an identical number of neurons, but, depending on the time dispersion of the neuronal input, different amplitudes of the EEG result.
The frequency, or the oscillatory rate, of an EEG rhythm is partially sustained by input activity from the thalamus. This part of the brain consists of neurons which possess pacemaker properties, i.e., they have the intrinsic ability to generate a self-sustained, rhythmic firing pattern. Another reason to the rhythmic behavior is coordinated interactions arising between cortical neurons themselves in a specific region of the cortex. In the latter case, no pacemaker function is involved, but the rhythm is rather an expression of a feedback mechanism that may occur in a neuronal circuit [4]. High-frequency/low-amplitude rhythms reflect an active brain associated with alertness or dream sleep, while low-frequency/large-amplitude rhythms are associated with drowsiness and non-dreaming sleep states. "This relationship is logical because when the cortex is most actively engaged in processing information, whether generated by sensory input or by some internal process, the activity level of cortical neurons is relatively high but also relatively unsynchronized. In other words, each neuron, or very small group of neurons, is vigorously involved in a slightly different aspect of a complex cognitive task; it fires rapidly, but not quite simultaneously with most of its neighbors. This leads to low synchrony, so the EEG amplitude is low. By contrast, during deep sleep, cortical neurons are not engaged in information processing, and large numbers of them are physically excited by a common, rhythmic input. In this case synchrony is high, so the EEG amplitude is large" [4]. The meaning of different brain rhythms largely remains unexplained, although several hypotheses have been put forward.
Signals recorded from the scalp have, in general, amplitudes ranging from a few microvolts to approximately 100 V and a frequency content ranging from 0.5 to 30-40 Hz. Electroencephalographic rhythms, also referred to as background rhythms, are conventionally classified into five different frequency bands [5][6].
Delta rhythm, <4 Hz. The delta rhythm is typically encountered during deep sleep and has a large amplitude. It is usually not observed in the awake, normal adult, but is indicative of, e.g., cerebral damage or brain disease (encephalopathy).
Theta rhythm, 4 - 7 Hz. The theta rhythm occurs during drowsiness and in certain stages of sleep.
Alpha rhythm, 8-13 Hz. This rhythm is most prominent in
normal subjects who are relaxed and awake with eyes closed; the activity is suppressed when the eyes are open. The amplitude of the alpha rhythm is largest in the occipital regions.
rhythm is mainly observed in the frontal and of the scalp.
Gamma rhythm, >30 Hz. The gamma rhythm
a state of active information processing of an electrode located over the sensorimotor connected to a high-sensitivity recording gamma rhythm can be observed during finger
3. EEG Datasets
It is anticipated that brain activities or EEG anesthesia would be similar to that of deep cases the cognitive functions of the brain low level. It was expected that EEG from person would have the similarity to that from a deep sleep. Single channel computerized equipment developed and fabricated by the Biomedical Physics and Technology, University Bangladesh [7], was used to collect EEG data. from the frontal plane were obtained from human subject aged around 25 years, while and asleep. Analog EEG data were samples/second for further advanced processing.
It is assumed that the wake condition corresponds conscious state of the brain; on the other hand condition of the subject represents the un-conscious anesthetic condition of the subject.
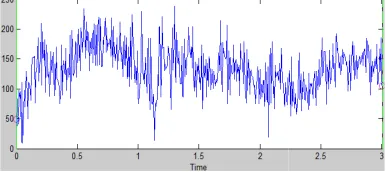
Figure 1(a) and Figure 1(b) display the healthy human subject at awake and deeply respectively. It is clear from the figures that not differentiate the two figures to estimate decision whether the EEG data is from awake person, i.e. conscious or unconscious state of
Figure 1(a). Raw EEG data of awake state from a health
25 yrs of age
Figure 1(b). Raw EEG data of sleep state from the
Clearly, we need some sophisticated procedures or advanced signal processing the raw EEG data to estimate the level of Such methods which may estimate the depth
and central regions
rhythm is related to of the cortex. Using sensorimotor area and recording technique, the finger movements [6].
EEG waves during deep sleep as in both brain comes to a very from an anesthetized from a person having Electrophysiology the department of University of Dhaka, data. The EEG data from one healthy while he was awake sampled at 256 processing.
corresponds to full hand the deep sleep conscious state, i.e.
the EEG patterns of deeply slept condition that naked eye can estimate or to arrive at a awake person or slept of human subject.
health human subject of
same human subject
sophisticated mathematical to be operated on of unconsciousness. depth of anesthesia or
depth of unconsciousness may analysis [8].
4. Wavelet Transform
4.1. Brief Theory of Wavelet Transform
The exact characteristics predicted in terms of amplitude, the individual waves, and, therefore, basis functions, are not well-suited process or signals, because these for information localized in appropriate for signals which are number of series expansion achieve acceptable modeling, thereby of modeling noise components
A wavelet is an oscillating concentrated in time in order non-stationary signals. For a function it must exhibit certain mathematical is to have bandpass filter characteristics. perspective wavelet is a powerful which involve two parameters: and another for scaling in time
Wavelet transform is an intuitive frequency information are of decomposes a given signal into Each of these sets contains a
time series which represents particular frequency band [3].
The wavelet transform can correlation of a signal with a ‘widths’. The wavelet transform respect to the wavelet function
where, T(a, b) is the wavelet function x(t) is the subject signal
a is the frequency scale b is the The relative contribution of a specific a scale and b location dimensional wavelet energy density
A plot of E(a, b) is known as
4.2. Implementation
We have chosen Daubechie 6 (D6) wavelet [8] to transform our EEG signals and selected such scales
which are corresponding to the according to the following relation
f =
may be obtained from wavelet
Transform
Transform
of EEG signal cannot be amplitude, duration, or morphology of therefore, it seems quite cosines as suited for modeling this type of these functions cannot account time; sines and cosines are are periodic. A relatively large coefficients are required to thereby also increasing the risk
[10].
oscillating function whose energy is to better represent transient, function to qualify as a wavelet, mathematical properties, one of which characteristics. In mathematical powerful class of basis functions parameters: one for translation in time
[10].
intuitive tool when both time and of interest. Wavelet transform into a number of coefficient sets.
represents the activity of the signal in a
be thought of as the cross-a set of wcross-avelets of vcross-arious transform of a continuous signal with
is defined as [8]
(1)
coefficient w() is a weighting signal () is the wavelet function
the time scale
the signal energy contained at location is given by the two-density function:
(2)
as a scalogram [8].
We have chosen Daubechie 6 (D6) wavelet [8] to transform our EEG signals and selected such scales
the frequencies of brain rhythm relation [8]:
43 Nusrat Ferdous and Md. Adnan Kiber: Estimating Depth of Anesthesia from EEG Signals Using Wavelet Transform
where, is the passband center of the mother wavelet (D6) which is equal to 0.7273, f is the representative or characteristic frequency for the wavelet at scale a and ∆ is the sampling period (256 sec.).
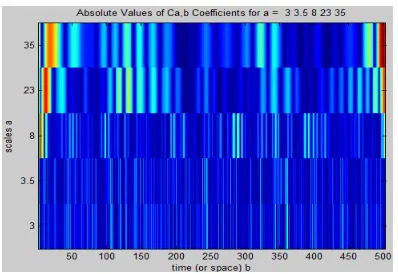
Figure 2(a). Plots of absolute values of wavelet coefficients of EEG signal of awake state.
Figure 2(b). Plots of absolute values of wavelet coefficients of EEG signal of sleep state.
Using the above equation we calculated different scales and their corresponding frequencies which are shown in Table 1
To observe power distribution of the EEG signals of different states of consciousness at different frequencies we performed continuous wavelet transform using MATLAB (R2008a).
Figure 2 shows coefficient plots of wavelet transform of EEG signal at awake and sleeping conditions obtained by using the above mentioned MATLAB program.
It is clear from the two figures 2(a) and 2(b), there is some visual color variation in band, which indicate difference in power distributions in awake state and slept state. However, it is not very easy to perceive this color variation for those who are not familiar with the signal processing tool ‘wavelet transform’.
We also proceeded to further analyze the wavelet coefficient values of awake and slept state to get a simpler numerical value if possible.
To explain our operation in a perceivable way we defined the following vectors:
, , and vectors contain elements
which represent the values of power, contributed at frequencies 5.319, 8.095, 23.27, 53.19 and 62.06Hz respectively for EEG signals of awake state. Length of each vector is 28.
, , , , and vectors contain elements which represent the values of power contributed at frequencies 5.319, 8.095, 23.27, 53.19 and 62.06Hz respectively for EEG signals of sleep state. Length of each vector is 28.
t-test was performed on the above said data sets to check whether there is any distinction of power distribution at different frequency to distinguish between EEG data of sleep and awake state. The results of t-test are tabulated in table 2. In our test it is seen that there is difference in power distribution for band.
Table 1. Different scales and their corresponding frequencies for D6 Wavelet.
EEG band Scale (a) Frequency (f) Hz
35 5.3195
23 8.0949
8 23.2727
3.5 53.1948
3 62.0606
Table 2. Results of t-test between vectors representing awake and sleep condition
Result of t-test between and
Result of t-test between and
Result of t-test between and
Result of t-test between and
Result of t-test between and
f=5.319Hz f=8.095Hz f=23.27Hz f=53.19Hz f=62.06Hz
h 0 0 0 1 1
P value 0.6882 0.4989 0.5258 0.0452 0.0441
It can be noticed that power contribution differs significantly in EEG signals of two different consciousness states only for band.
5. Conclusion
EEG signal is comprised of several frequency bands. From
power contribution at band to estimate certain level of unconsciousness. We did not have large number of EEG data sets from a large number of human subjects to find statistical marginal value for the state of unconsciousness. However, it’s clear from our findings that wavelet transform technique can be used to measure depth of unconsciousness.
References
[1] Bojan Musizza and Samo Ribaric, “Monitoring the Depth of Anaesthesia”, Sensors 2010, 10, 10896-10935; doi:10.3390/s101210896
[2] Charles N. Horton, MD, “Anesthesia Crash Course”, Oxford University Press, 2009.
[3] Tatjana Zikov, Stéphane Bibian, Guy A. Dumont, Mihai Huzmezan, and Craig R. Ries, “Quantifying Cortical Activity During General Anesthesia Using Wavelet Analysis”, IEEE TRANSACTIONS ON BIOMEDICAL ENGINEERING, VOL. 53, NO. 4, APRIL 2006.
[4] M. F. Bear, B. W. Connors, and M. A. Paradiso, Neuroscience. Exploring the Brain. Baltimore: Williams & Wilkins, 1996.
[5] E. Niedermayer, "The normal EEG of the waking adult," in
Electroencephalography. Basic Principles, Clinical Applications and Related Fields (E. Niedermayer and F. Lopes da Silva, eds.), ch. 13, pp. 149-173, Baltimore: Williams & Wilkins, 1999.
[6] C. Andrew and G. Pfurtscheller, "Event-related coherence as a tool for dynamic interaction of brain regions,"
Electroencephal. Clin. Neurophysiol., vol. 98, pp.144-148, 1996.
[7] Tasneem Rahman, Khadija Akhter Suchi and K. Siddique-e-Rabbani, “Towards development of an anaesthesia monitoring device based on EEG”, conference proceeding, Recent Advances in Physics (RAP) 2010, March.
[8] Paul S. Addison, “The Illustrated Wavelet Transform Handbook”, Bristol and Philadelphia, Institute of Physics Publishing, 2002.
[9] Ingrid Daubechies, “Ten Lectures on Wavelets”, Society for Industrial and Applied Mathematics, Philadelphia, Pennsylvania, 1992
[10] Leif Sornmo, Pablo Laguna, “ Bioelectrical Signal Processing in Cardiac and Neurological Applications”, Elsevier Academic Press. [4] M. F. Bear, B. W. Connors, and M. A. Paradiso,