Title: NEW INSIGHTS IN THE FIELD OF FAST DISSOLVING TABLETS Author: Shivangi Shukla*, Dinesh Kumar Mishra, Dinesh Kumar Jain Keyword: Disintegration, Dissolution, Modified tablets, Novel drug delivery system (NDDS).Page No: 213-226Abstract: Recent a
19
0
0
Full text
(2) Katual M.K. et al., Jour. Harmo. Res. Pharm., 2015, 4(3), 227-245. tablet types available include: (1) conventional compressed tablets; (2) multiple compressed tablets; (3) enteric-coated tablets; (4) sugarcoated tablets; (5) film-coated tablets; (6) chewable tablets; (7) effervescent tablets; (8) buccal and sublingual tablets; and (9) vaginal tablets. [1] Destructive Evaluation of Tablets: Evaluations of a pharmaceutical product are an essential and mandatory criterion to asses and confirm the quality of a product to be used by the patients. The following tests are given below: [2] • Hardness(crushing strength) • Friability • Disintegration • Dissolution • Uniformity of content Evaluation techniques for Non-destructive quantification: Non-destructive evaluation techniques are always considered to be advantageous to destructive analytical techniques. A non-destructive evaluation of tablets is possible with the application of Fourier transform infrared spectroscopy, nearinfrared spectroscopy, Optical coherence tomography (OCT) and terahertz pulsed imaging (TPI), Raman spectroscopy, and appropriate statistical techniques. The advantages of non-destructive techniques are: 1. Rapid & reproducible techniques 2. More precise evaluation of products (e.g. tablets, capsules, etc.) 3. Less wastage of pharmaceuticals 4. Low Production cost 5. Maintenance of Dose accuracy 6. Ultimately leads to production of pharmaceuticals economically. Fourier Transform Infrared Spectroscopy: Fourier transform infrared spectroscopy (FTIR)[3] is a technique which is used to obtain an infrared spectrum of absorption, emission, photoconductivity or Ram an scattering of a solid, liquid or gas. An FTIR spectrometer simultaneously collects spectral data in a wide spectral range. The term Fourier. transform infrared spectroscopy originates from the fact that a Fourier transform (a mathematical process) is required to convert the raw data into the actual spectrum. [4] The first low-cost spectrophotometer capable of recording an infrared spectrum was the Perkin-Elmer Infracord produced in 1957.[5] This instrument covered the wavelength range from 2.5 µm to 15 µm (wave number range 4000 cm−1 to 660 cm−1). The lower wavelength limit was chosen to encompass the highest known vibration frequency due to a fundamental molecular vibration. The upper limit was imposed by the fact that the dispersing element was a prism made from a single crystal of rock-salt (sodium chloride) which becomes opaque at wavelengths longer than about 15 µm; this spectral region became known as the rock-salt region. Later instruments used potassium bromide prisms to extend the range to 25 µm (400 cm−1) and caesium iodide 50 µm (200 cm−1). The region beyond 50 µm (200 cm−1) became known as the far-infrared region; at very long wavelengths it merges into the microwave region. Measurements in the far infrared needed the development of accurately ruled diffraction gratings to replace the prisms as dispersing elements since salt crystals are opaque in this region. More sensitive detectors than the bolometer were required because of the low energy of the radiation. One such was the Golay detector. An additional issue is the need to exclude atmospheric water vapour because water vapour has an intense pure rotational spectrum in this region. Farinfrared spectrophotometers were cumbersome, slow and expensive. The advantages of the Michelson interferometer were well-known, but considerable technical difficulties had to be overcome before a commercial instrument could be built. Also an electronic computer was needed to perform the required Fourier transform and this only became practicable with the advent of mini-computers, such as the PDP8 which became available in 1965. Digilab. www.johronline.com. 228 | P a g e.
(3) Katual M.K. et al., Jour. Harmo. Res. Pharm., 2015, 4(3), 227-245. pioneered the world's first commercial FTIR spectrometer (Model FTS-14) in 1969 [6]. (Digilab FTIRs are now a part of Agilent technologies's molecular product line after it acquired spectroscopy business from Varian).[7][8] The goal of any absorption spectroscopy (FTIR, ultraviolet-visible ("UVVis") spectroscopy, etc.) is to measure how well a sample absorbs light at each wavelength. The most straightforward way to do this, the "dispersive spectroscopy" technique, is to shine a monochromatic light beam at a sample, measure how much of the light is absorbed, and repeat for each different wavelength. Fourier transform spectroscopy is a less intuitive way to obtain the same information. Rather than shining a monochromatic beam of light at the sample, this technique shines a beam containing many frequencies of light at once, and measures how much of that beam is absorbed by the sample. Next, the beam is modified to contain a different combination of frequencies, giving a second data point. This process is repeated many times. Afterwards, a computer takes all these data and works backwards to infer what the absorption is at each wavelength. The beam described above is generated by starting with a broadband light source one containing the full spectrum of wavelengths to be measured. The light shines into a Michelson interferometer a certain configuration of mirrors, one of which is moved by a motor. As this mirror moves, each wavelength of light in the beam is periodically blocked, transmitted, blocked, transmitted, by the interferometer, due to wave interference. Different wavelengths are modulated at different rates, so that at each moment, the beam coming out of the interferometer has a different spectrum. As mentioned, computer processing is required to turn the raw data (light absorption for each mirror position) into the desired result (light absorption for each wavelength). The processing required turns out to be a common algorithm called the Fourier transform (hence. the name, "Fourier transform spectroscopy"). The raw data is sometimes called an "interferogram". Michelson interferometer. Fig no. 1 Schematic diagram of a Michelson interferometer, configured for FTIR In a Michelson interferometer adapted for FTIR, light from the polychromatic infrared source, approximately a black-body radiator, is collimated and directed to a beam splitter. Ideally 50% of the light is refracted towards the fixed mirror and 50% is transmitted towards the moving mirror. Light is reflected from the two mirrors back to the beam splitter and (ideally) 50% of the original light passes into the sample compartment. There, the light is focused on the sample. On leaving the sample compartment the light is refocused on to the detector. The difference in optical path length between the two arms to the interferometer is known as the retardation. An interferogram is obtained by varying the retardation and recording the signal from the detector for various values of the retardation. The form of the interferogram when no sample is present depends on factors such as the variation of source intensity and splitter efficiency with wavelength. This results in a maximum at zero retardation, when there is constructive interference at all wavelengths, followed by series of "wiggles". The position of zero retardation is determined accurately by finding the point of maximum intensity in the. www.johronline.com. 229 | P a g e.
(4) Katual M.K. et al., Jour. Harmo. Res. Pharm., 2015, 4(3), 227-245. interferogram. When a sample is present the background interferogram is modulated by the presence of absorption bands in the sample. There are two principal advantages for an FT spectrometer compared to a scanning (dispersive) spectrometer.[9] 1. The multiplex or Fellgett's advantage. This arises from the fact that information from all wavelengths is collected simultaneously. It results in a higher Signal-to-noise ratio for a given scan-time or a shorter scan-time for a given resolution. • 2. The throughput or Jacquinot's advantage. This results from the fact that, in a dispersive instrument, themonochromator has entrance and exit slits which restrict the amount of light that passes through it. The interferometer throughput is determined only by the diameter of the collimated beam coming from the source. Other minor advantages include less sensitivity to stray light,[10] and "Connes' advantage" (better wavelength accuracy),while a disadvantage is that FTIR cannot use the advanced electronic filtering techniques that often makes its signal-to-noise ratio inferior to that of dispersive measurements.[10] Resolution: The interferogram belongs in the length domain. Fourier transform (FT) inverts the dimension, so the FT of the interferogram belongs in the reciprocal length domain, that is the wavenumber domain. The spectral resolution in wavenumbers per cm is equal to the reciprocal of the maximum retardation in cm. Thus a 4 cm−1 resolution will be obtained if the maximum retardation is 0.25 cm; this is typical of the cheaper FTIR instruments. Much higher resolution can be obtained by increasing the maximum retardation. This is not easy as the moving mirror must travel in a near-perfect straight line. The use of corner-cube mirrors in place of the flat mirrors is helpful as an outgoing ray from a corner-cube mirror is parallel to the incoming ray, regardless of the orientation of the mirror about axes perpendicular to the axis of the light beam.. Connes measured in 1966 the temperature of the atmosphere of Venus by recording the vibration-rotation spectrum of Venusian CO2 at 0.1 cm−1 resolution.[11] Michelson himself attempted to resolve the hydrogen Halpha" emission band in the spectrum of a hydrogen atom into its two components by using his interferometer. A spectrometer with 0.001 cm−1 resolution is now available commercially. The throughput advantage is important for high-resolution FTIR as the monochromator in a dispersive instrument with the same resolution would have very narrow entrance and exit slits. Beam splitter: The beam-splitter can not be made of common types of glass, as they are opaque to infrared radiation of wavelengths longer than about 2.5 µm. A thin film, usually of a plastic material, is used instead. However, as any material has a limited range of optical transmittance, several beam- splitters are used interchangeably to cover a wide spectral range. Fourier transform: The interferogram in practice consists of a set of intensities measured for discrete values of retardation. The difference between successive retardation values is constant. Thus, a discrete Fourier transform is needed. The fast Fourier transform (FFT) algorithm is used. Far-infrared FTIR: The first FTIR spectrometers were developed for far-infrared range. The reason for this has to do with the mechanical tolerance needed for good optical performance, which is related to the wavelength of the light being used. For the relatively long wavelengths of the far infrared, ~10 µm tolerances are adequate, whereas for the rocksalt region tolerances have to be better than 1 µm. A typical instrument was the cube interferometer developed at the NPL [12] and marketed by Grubb Parsons. It used a stepper motor to drive the moving mirror, recording the detector response after each step was completed.. www.johronline.com. 230 | P a g e.
(5) Katual M.K. et al., Jour. Harmo. Res. Pharm., 2015, 4(3), 227-245. Mid-infrared FTIR: With the advent of cheap microcomputers it became possible to have a computer dedicated to controlling the spectrometer, collecting the data, doing the Fourier transform and presenting the spectrum. This provided the impetus for the development of FTIR spectrometers for the rock-salt region. The problems of manufacturing ultra-high precision optical and mechanical components had to be solved. A wide range of instruments are now available commercially. Although instrument design has become more sophisticated, the basic principles remain the same. Nowadays, the moving mirror of the interferometer moves at a constant velocity, and sampling of the interferogram is triggered by finding zero-crossings in the fringes of a secondary interferometer lit by a helium–neon laser. In modern FTIR systems the constant mirror velocity is not strictly required, as long as the laser fringes and the original interferogram are recorded simultaneously with higher sampling rate and then re-interpolated on a constant grid, as pioneered by James W. Brault. This confers very high wave number accuracy on the resulting infrared spectrum and avoids wave number calibration errors. Near-infrared FTIR: The near-infrared region spans the wavelength range between the rocksalt region and the start of the visible region at about 750 nm. Overtones of fundamental vibrations can be observed in this region. It is used mainly in industrial applications such as process control and chemical imaging. Applications: FTIR can be used in all applications where a dispersive spectrometer was used in the past (see external links). In addition, the multiplex and throughput advantages have opened up new areas of application. These include: • GC-IR (gas chromatography-infrared spectrometry). A gas chromatograph can be used to separate the components of a mixture. The fractions containing single components are directed into an FTIR spectrometer, to provide the infrared spectrum of the sample. This. technique is complementary to GC-MS (gas chromatography-mass spectrometry). The GCIR method is particularly useful for identifying isomers, which by their nature have identical masses. The key to the successful use of GC-IR is that the interferogram can be captured in a very short time, typically less than 1 second. FTIR has also been applied to the analysis of liquid chromatography fractions.[10] • TG-IR (Thermogravimetry-infrared spectrometry) IR spectra of the gases evolved during thermal decomposition are obtained as a function of temperature.[13] • Micro-samples. Tiny samples, such as in forensic analysis, can be examined with the aid of an infrared microscope in the sample chamber. An image of the surface can be obtained by scanning.[14] Another example is the use of FTIR to characterize artistic materials in old-master paintings.[15] • Emission spectra. Instead of recording the spectrum of light transmitted through the sample, FTIR spectrometer can be used to acquire spectrum of light emitted by the sample. Such emission could be induced by various processes, and the most common ones are luminescence and Raman scattering. Little modification is required to an absorption FTIR spectrometer to record emission spectra and therefore many commercial FTIR spectrometers combine both absorption and emission/Raman modes.[16] • Photocurrent spectra. This mode uses a standard, absorption FTIR spectrometer. The studied sample is placed instead of the FTIR detector, and its photocurrent, induced by the spectrometer's broadband source, is used to record the interferrogram, which is then converted into the photoconductivity spectrum of the sample. [17] Near Infrared Spectroscopy: The near-IR region of the electromagnetic spectrum comprises the wavelength range of about 8002500 nm. [18] Molecular overtone and combination vibrations form the basis for this method. The molar absorptivity in the near-IR. www.johronline.com. 231 | P a g e.
(6) Katual M.K. et al., Jour. Harmo. Res. Pharm., 2015, 4(3), 227-245. region is very small as these transitions are forbidden. But the near-IR has a good penetration power than mid-infrared radiation. Thus though it is not a sensitive technique, it can be used for the evaluation of bulk materials. Another advantage is that this technique requires no sample preparation in most cases. The broad nature of the molecular overtone and combination bands in the near-IR results in complex spectra. This makes it difficult to assign specific features to specific chemical components. Principal component analysis or partial least squares are mainly used as a multiple wavelength (multivariate) calibration technique. This helps in understanding the chemical details. The application of near-IR analytical method is mainly dependent upon two key factors - the calibration samples and calibration technique.[19] Instrumentation: The instrumentation mainly consists of a source, a detector, and a dispersive element. Incandescent, quartz halogen light bulbs, light-emitting diodes, etc. are also used as a source of near-IR radiation. Silicon-based charge-coupled devices, indium gallium arsenide devices, and lead sulfide devices are mostly used as detectors. A 2D array detector with an acousto-optic tunable filter is used in instruments used for chemical imaging. Diffracting gratings are mainly used for the purpose of dispersion of the radiation though prism is also used.[21] Measurement and data analysis: Transmission mode and reflectance mode measurements are possible with NIR spectroscopy depending upon the positioning of the sample and the detector. [22] The ratio of the intensity of radiation that passes through the sample to the intensity of radiation falling on it is called as transmission whereas the ratio of the intensity of radiation reflected by the sample to the intensity of radiation falling on it is called as reflectance. The process of diffuse reflectance involves the re-emergence radiation after penetration into the bulk of the sample and undergoing multiple reflections within the sample substance. For the. evaluation of solid samples like tablets, mainly reflectance spectroscopy is used. NIR spectra are complex with multiple broad overlapping peaks. This necessitated the use of chemometric data processing to gather sample properties from spectral information. [17] Typically to correct collinearity and the typically poor selectivity of NIR spectra, multivariate models are used though some researchers were able to develop a univariate calibration model for pharmaceutical analysis based on NIR spectra.[23] Near-infrared imaging: Digital imaging with the attributes of spectroscopic measurements is possible with chemical imaging techniques. The measurement of the photon interacting with a molecule or matter is involved in vibrational spectroscopy as in NIR spectroscopy. A pattern of absorption of photons of specific energy is obtained as a result of absorption or scattering of these photons by the interacting molecules. This obtained pattern in chemical imaging provides spatial or chemical information about the sample. An illumination source, an imaging optic, a spectral encoder selecting the wavelengths and a focal plane array are the basic instrumental requirements for this technique. The resulting data are recorded as a series of images. Even coating layers on a tablet can be visualized by this technique. [17] Applications: Near-IR finds its major applications in food and drug industry, combustion products, medicine, and astronomical spectroscopy. It is used in studying the atmospheres of cool stars. It can be used for remote monitoring of plants and soils. Its medical uses include noninvasive measurement of the amount and oxygen content of hemoglobin, noninvasive assessment of brain function, NIR imaging or functional NIR imaging, oximetry (determination of blood flow, volume, and oxygenation), etc. Particle size measurement can also be carried out by NIR spectroscopy. The application of near-IR, though established, is still in its infancy for its utility in the pharmaceutical industry. Near-IR. www.johronline.com. 232 | P a g e.
(7) Katual M.K. et al., Jour. Harmo. Res. Pharm., 2015, 4(3), 227-245. has been proposed as an in-process real time test for tablets by FDA. [24] Major pharmaceutical applications include identification of actives/excipients, moisture determination in samples, determination of blend uniformity, determination of particle size, quantification of actives/excipients, etc. The following sections describe in detail about the application of near-IR for the nondestructive evaluation of tablets. Tablet hardness: The use of near-IR as a nondestructive method of tablet hardness has been reported first in 1991. [25] Later on so many studies were reported for the quantitative and qualitative evaluation of tablet hardness. NIR spectrum can be obtained by the determination of absorbance (inversely proportional to reflectance, R) as a function of wavelength or wave number. A change in the slope of the best fit line of the spectrum can be used for the determination of tablet hardness. This approach is based on the established fact that changes in tablet hardness cause a variation in the slope of the baseline of the NIR spectra. [Fig no. 2] displays a schematic representation of NIR spectra of tablet samples with the same composition but with different hardness. The straight lines represent the regression line of the corresponding spectrum. Sample positioning also affects the baseline of the spectrum. So it is of importance to take due care to maintain same sample positioning during the analysis of all samples.. Fig no. 2 Schematic NIR spectra of tablets of same composition but with different hardness. values (Hardness: .....Highest ——Medium ---Lowest) The calibration of the method involves the laboratory determination of tablet hardness and fitting each spectrum with a regression line. Then a plot is prepared using the slopes of the regression lines versus the corresponding hardness of the tablets using a mechanical hardness tester by a destructive technique. Using this calibration plot the tablet hardness is predicted from the slope of the NIR spectra of the tablet sample. [Fig no. 3] displays a schematic representation of a typical calibration curve for the determination of tablet hardness using NIR spectroscopy. The standard error of calibration and standard error of prediction should be small and almost same for a robust calibration model.. Fig no. 3 Schematic calibration curve for the determination] of the tablet hardness from the slope of regression line of the NIR spectrum Disintegration time :From the results of the studies on the effect of tablet hardness, it is clear that as the tablet hardness increases the NIR absorbance of the samples also increases. As increased tablet hardness is indicative of the increased tablet disintegration time, NIR spectroscopy can provide useful information on tablet disintegration by measuring the NIR spectrum. A calibration model has to be generated for this purpose.[26] Dissolution: The dissolution profiles of tablets are found to be inversely proportional to their NIR absorbance. NIR diffuse reflectance. www.johronline.com. 233 | P a g e.
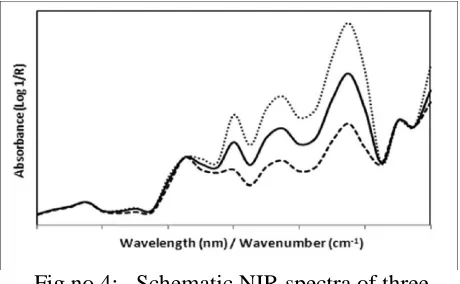
(8) Katual M.K. et al., Jour. Harmo. Res. Pharm., 2015, 4(3), 227-245. spectroscopy can be used for the prediction of drug dissolution. [27] Identification and quantification of actives and excipients: Pharmaceutical actives and excipients can be identified with the help of an NIR spectrum. The NIR spectrum consisting of a plot of absorbance versus wave number or wavelength will be unique for a compound with definite absorption peaks. The particle size of pharmaceutical excipients and thus their grades accordingly can be determined by checking the spectral reflectance baseline and the absorbance peaks. A reduction in particle size causes decreased absorbance resulting from increased light scattering. [Fig no. 4] shows the schematic NIR spectra of three different concentrations of an active/excipient in a tablet formulation. A significant change in the absorbance values is observed in the characteristic region of the particular compound.. Fig no.4: Schematic NIR spectra of three different concentrations of an active/excipient in a tablet A second-derivative spectrum is also useful in the identification and quantification of a compound. The intensity of the band at specific wavelengths characteristic to the compound could be observed to be changed as its quantity changes in the sample being analyzed. This forms the basis for the quantification of actives and excipients using NIR spectroscopy. A calibration curve can be prepared using these derivative spectra and can be used for the prediction of drug content in tablet samples. [28]. Process analytical technology and tablet evaluation by NIR: The NIR spectroscopic method can be used as a routine technique for the monitoring of a manufacturing process and as a real time release testing. Thus this technique is very useful in establishing a valid process analytical technology. [29] The technique is a valid PAT tool for the rapid characterization of pharmaceutical tablet quality. [30] ICH Q8 (R1) guidelines have mentioned the possible use of NIR spectroscopy for real time release testing of tablets such as weight variation. [31] Rationale for the study: To study in detail about nondestructive evaluation of tablets using the multi advanced technique • To find out an alternative for the current methods of evaluation. • To find out the possibility of identification and quantification of drugs and excipients. • To study about various statistical techniques and software useful for carrying out this technique. • To study about NIR spectroscopy as it may be considered to be of high importance in terms of process analytical technology. • To gain wide acceptance this non destructive quantification techniques as a rapid and simple real time in-process testing for tablets. • To study about the suitability of this technique even after packaging renders it highest suitability for pharmaceutical evaluation. • To study whether, it is also suitable for routine quality control of tablets. Literature Review: Javed Ali et.al reported that a rapid and simple non-destructive technique can be used for the in-process evaluation of a pharmaceutical product. This can be helpful in achieving the goals of process analytical technology (PAT). Chemical and physical information of virtually any matrix can be extracted using near-infrared (NIR) spectroscopy and imaging. [30] Multivariate data. www.johronline.com. 234 | P a g e.
(9) Katual M.K. et al., Jour. Harmo. Res. Pharm., 2015, 4(3), 227-245. analysis combined with these methods can be used for exploring both qualitative and quantitative data. NIR spectroscopy has been a very interesting area of research for the development of nondestructive evaluation of pharmaceutical products especially that of tablets. Its utility in the development, optimization, and monitoring of the process has been established and nowadays it is being increasingly used for the purpose. The possible pharmaceutical applications of NIR spectroscopy include identification, determination of composition, moisture content determination, detection of impurities, checking of homogeneity of blending, etc. For NIR spectroscopy, data calibration is required using the measurement of the property being studied. The calibration models developed should be robust enough. [30] Iyer et al. have carried out comparative studies of the reflectance and transmittance methodologies for the evaluation of tablets. The study results showed that both methods might be sensitive to sample inhomogeneity and that transmittance measurements are sensitive to path length variations. [31] Kirsch et al. proposed a new algorithm for testing tablet hardness using near-IR spectroscopy. They carried out their study in cimetidine-containing tablets. Different tablets having 1-20% w/w of cimetidine were used. Both tablet hardness and sample positioning were found to affect the spectral baseline. A destructive diametral crushing test was carried out on each tablet using a calibrated hardness tester, after recording the spectra from the unscored face of the tablets. The study was carried out using excipients showing plastic deformation (sodium chloride and microcrystalline cellulose) and brittle fracture (dibasic calcium phosphate dihydrate and lactose). After compression of the blends, one punch was removed and a fiber-optic probe was inserted into the die and the NIR spectra were recorded. Principal component analysis/principal component regression and. spectral best-fit method were compared using two different approaches. In one approach, the data from the group of a particular potency of cimetidine were used to predict the hardness of the tablets in the other potency groups. In the second approach, the data from half of the group of a particular potency of cimetidine were used to predict the hardness of the rest of the tablets in that particular potency group. The standard error of calibration and the standard error of prediction were used for the comparison and evaluation of the data. The spectral best-fit method was compared to the established multivariate principal component analysis/principal component regression method. The results showed that the spectral best-fit method was easier to develop and can be used for the determination of tablet hardness using NIR spectroscopy. The spectral best-fit method was also found to be applicable for a wide range of drug concentration.[23] Donoso et al. determined tablet hardness using NIR diffuse reflectance method. Seven theophylline tablets with different hardness values were used in their study for developing a model equation, validating the model and testing the model predictive ability. Placebo tablets with different hardness values were also prepared for the study for evaluation. The relationship between tablet hardness and the NIR spectra were evaluated using linear regression, and quadratic, cubic, and partial least-squares methods. The study results suggested that NIR absorbance was increased as the tablet hardness increased. The predicted values using the models were found to be in agreement with the experimental values using destructive evaluation of the tablets by a hardness tester. They concluded that the NIR diffuse reflectance method could be an alternative for the destructive testing of tablet [32] hardness. Morisseau et al. evaluated and quantified the effect of compression force on tablet hardness using NIR spectroscopy. They used drugcontaining formulations and one placebo. www.johronline.com. 235 | P a g e.
(10) Katual M.K. et al., Jour. Harmo. Res. Pharm., 2015, 4(3), 227-245. formulation for their study. Two formulations each were of hydrochlorthiazide (15% and 20%) and chlorpheniramine maleate (2% and 6%). The placebo was prepared out of microcrystalline cellulose and magnesium stearate. The NIR reflectance data were compared to the destructive hardness test data using multiple linear regression and partial least-squares regression methods. They correlated these data and showed that the increased tablet hardness caused by the increased compression force resulted in an increased absorbance of NIR radiation. The study results revealed that the NIR spectroscopic evaluation was as precise as the hardness tester in determining the tablet hardness. [33] Ebube et al. investigated the application of diffuse reflectance NIR spectroscopy for the determination of hardness of three different grades of microcrystalline cellulose. Tablets of different hardnesses have been prepared by varying the compression force from 0.2 to 1.2 tons. The partial least-squares technique was employed for the prediction of tablet hardness. The error of prediction was found to be 8.8%, 5.3%, and 4.6% for MCC PH 101, MCC PH 102, and MCC PH 200, respectively. [34] Otusuka et al. used NIR chemometrics to study the effect of lubricant mixing on tablet hardness. Two formulations were prepared for the evaluation. The first formulation contained sulpyrine, microcrystalline cellulose, and magnesium stearate whereas the second formulation contained sulpyrine, spray-dried lactose, corn starch, and magnesium stearate. Blends of the above two formulations without a lubricant (magnesium stearate) were prepared. Finally the blends were lubricated by mixing with magnesium stearate for various mixing times. A reflection-type Fourier transform NIR (FT-NIR) spectrum spectrometer was used for recording the spectra of the blend samples. A principal component regression technique was employed for evaluation. All the NIR spectra showed change with the lubricant mixing time.. The evaluated blends were compressed and hardness was checked. Their study results showed that the tablet hardness decreased with the increasing mixing time. They concluded that the evaluation of tablet blends using NIR spectroscopy prior to compression can be used for predicting the hardness of the tablets after compression which in turn helps in assuring the product quality. [35] Chen et al. evaluated the possibility of predicting hardness of tablets using artificial neural networks and NIR spectroscopy. The tablet formulation contained microcrystalline cellulose and magnesium stearate. Different tablet hardness values were obtained by varying the compression force from 0.4 to 1 ton. Two sets of tablets were prepared for each hardness value and one set was used for generating the models whereas the other set was used as a test sample for the evaluation of prediction of tablet hardness. Artificial neural network and partial least-squares models were used to predict the hardness of tablets. They found that artificial neural network calibration models can be used as a powerful tool for the analysis of NIR data. [36] Otsuka et al. evaluated the effect of the scaleup factor of blending and tableting processes using NIR spectroscopy. They prepared tablets containing sulpyrine, microcrystalline cellulose, and 1% magnesium stearate both in lab-scale and plot-scale. Principal component regression was used for data evaluation. They observed that in both the cases, tablet hardness decreased as the mixing time increased. [37] Otsuka et al. evaluated the effect of the amount of water used for granulation on tablet hardness. They prepared granules using antipyrine, hydroxylpropylcellulose, lactose, and potato starch. Granulation was done with water in varying quantities from 11% to 19% w/w. The calibration model was prepared using principal component regression using the data obtained from tablet hardness and NIR spectra. The hardness of tablets was found to decrease as the quantity of added water increased. The. www.johronline.com. 236 | P a g e.
(11) Katual M.K. et al., Jour. Harmo. Res. Pharm., 2015, 4(3), 227-245. correlation coefficient for the prediction of tablet hardness was observed to be 0.8064. Thus from their study they concluded that that the chemometric evaluation of tablet granules by NIR spectroscopy can be used for predicting resultant tablet hardness. [38] Tanabe et al. evaluated the use of NIR spectroscopy to predict tablet hardness by principal component regression analysis. The study was conducted on tablets formulated from berberine chloride, lactose, and potato starch. The tablet weight was 800 mg and the diameter was 8 mm. Tablets of different hardnesses were obtained by varying the compression pressure from 59 to 195 MPa. The reflectance NIR data and the corresponding tablet hardness data were used for preparing a calibration for further predicting the hardness of test samples. Principal component regression analysis was carried out for the study. The Pearson product moment correlation coefficient was found to be 0.925 between the actual and predicted tablet hardness values. [39] Donoso et al. evaluated the application of NIR reflectance spectroscopy for the determination of the disintegration time. Seven theophylline tablets of different disintegration times were prepared by varying the compression force while keeping the tablet composition same. Five placebo formulations with different disintegration times were also prepared for the study. They used linear regression, and quadratic, cubic, and partial least-squares methods for establishing a relationship between the laboratory tablet disintegration time and the NIR absorbance and found that an increased NIR absorbance caused an increased disintegration time.[24] Freitas et al. evaluated 10 different formulations of clonazepam tablets varying in excipient content. Three dissolution media were employed for the study. Seven dissolution times were chosen in the study using conventional dissolution apparatus and HPLC analysis of the dissolution samples. Multivariate analysis using the partial least-squares regression was used for. the correlation between the dissolution data and NIR spectra. The study results revealed that this non-destructive method using NIR can be used for the dissolution study of tablets.[40] Malik et al. reported that A simultaneous determination of the identification and composition of tablets was carried out by using NIR spectrometry. Aspirin tablets were taken for their study. The tablets were packed in a blister package. A hole was punched through the foil backing. Through this hole the tablets were exposed to water vapor or a pH 9.0 ammonium hydroxide solution. The salicylic acid content and water absorption were determined in the study using NIR spectrometry. The salicylic acid content and water absorption were also determined by HPLC analysis and weighing, respectively. They prepared a calibration curve for the water absorption and salicylic acid content from the obtained data. They used an IRC-160 InSb focal plane array video camera with a NIR bandpass cold filter for the 0.5-m multispectral imaging of the tablet samples. Imaging with the bootstrap error-adjusted single-sample technique (BEST) was carried out in their study. The study results showed the technique to be very fast (approximately 1000 times) and the precision to be very close to that obtained by spectrometric analysis of single tablets. Multispectral imaging enabled simultaneous analysis of a large numbers of samples. [41] The application of a combination of chemometrics with NIR spectroscopy has been demonstrated by Jedvert et al. They compared the results with those obtained with liquid chromatography. The NIR spectroscopic method was found to be equally good as liquid chromatography and demonstrated a good stability. They could analyze the sample even after 1.5 years after applying baseline correction. [26] Blanco et al. have demonstrated the suitability of reflectance NIR spectroscopy for pharmaceutical process monitoring by carrying out quantitative analysis of an active ingredient. www.johronline.com. 237 | P a g e.
(12) Katual M.K. et al., Jour. Harmo. Res. Pharm., 2015, 4(3), 227-245. in different production steps of tablet formulation. [42] Meza et al. determined the drug content in a low-dosage formulation by transmission NIR spectroscopy. Ibuprofen concentrations of 0.5%, 0.7%, and 1.0% (m/m) were selected for the study. Microcrystalline cellulose, colloidal silicon dioxide, and magnesium stearate were used for the preparation of tablets. A multipurpose analyzer FT-NIR spectrometer was used for the recording of transmission spectra. The drug content was estimated by a validated UV method. A calibration model was developed using partial least-squares regression from the data obtained for 110 tablets. The accuracy, repeatability, intermediate precision, and linearity of the method were evaluated and were found to be satisfactory. The results obtained indicated FT-NIR transmission spectroscopy to be industrially applicable to facilitate process development and optimization. They suggested that the method can be used for a large number of tablets during process development and detect drug agglomeration problems. [43] Ricci et al. developed a method for the identification of counterfeit medicines in blister packs by a combination of spatially offset Raman spectroscopy (SORS) and attenuated total reflection FTIR (ATR-FTIR) imaging. They carried out their study in genuine and fake artesunate antimalarial tablets. They also claimed the method to be useful for forensic investigation of counterfeit medicines. [44] Yang and Irudayaraj reported that A rapid infrared spectroscopic determinations of vitamin C in food and pharmaceutical products have been carried out by. NIR, FT-NIR, and FTIR-ATR were studied for the quantification of vitamin C in powdered mixtures and solutions. Correlation coefficient (r 2) values 0.988, 0.992, and 0.999 were obtained for the developed methods using NIR, FT-NIR-, and FTIR-ATR, respectively. The methods were found to be highly useful for the quantification of vitamin C. [45]. Ziyaur R et.al reported that the focus of present investigation was to assess the utility of non-destructive techniques in the evaluation of risperidone solid dispersions (SD) with methylβ-cyclodextrin (MBCD) and subsequent incorporation of the SD into orally disintegrating tablets (ODT) for a faster release of risperidone. The SD was prepared by a solvent evaporation method and evaluated by scanning electron microscopy (SEM), Fourier transform infrared (FTIR), near infrared spectroscopy (NIR), NIR-chemical imaging (NIR-CI), powder X-ray diffraction (PXRD) and differential scanning calorimetry (DSC). DSC and XRD analysis indicated that crystallinity of SD has reduced significantly. FTIR showed no interaction between risperidone and MBCD. Partial least square (PLS) was applied to the NIR data for the construction of chemometric models to determine both components of the SD. Good correlations were obtained for calibration and prediction as indicated by correlation coefficients >0.9965. The model was more accurate and less biased in predicting the MBCD than risperidone as indicated by its lower mean accuracy and mean bias values. SD3 (risperidone: MBCD, 1:3) was incorporated into ODT tablets containing diluent (Dmannitol, FlowLac® 100 or galenIQ™-721) and superdisintegrant (Kollidon® CL-SF, Ac-Di-Sol or sodium starch glycolate). Disintegration time, T50 and T90were decreased in the formulations containing mannitol and Kollidon® CL-SF, but increased with galenIQ™-721 and sodium starch glycolate, respectively. NIR-CI images confirmed the homogeneity of SD and ODT formulations. [46] C. Cahyadi et al. has demonstrated that The Supercell coater is a newly introduced coater which utilizes air fluidization for tablet coating. The aim of this study was to define a suitable, fast and non-destructive method for the quantification of coat thickness for Supercellcoated tablets. Various coat thickness characterization methods were carried out on. www.johronline.com. 238 | P a g e.
(13) Katual M.K. et al., Jour. Harmo. Res. Pharm., 2015, 4(3), 227-245. tablets coated at different process conditions. These include the use of optical microscopy, micrometer, X-ray fluorescence (XRF), Raman and near-infrared (NIR) spectroscopy. Coat thicknesses obtained from direct measurements were used to calibrate the spectral data from spectroscopic methods for model generation. The models were subsequently validated to evaluate their prediction capabilities, especially the ability to differentiate tablets coated at different conditions. XRF spectroscopy was viewed to be more suitable for the assessment of process yield and efficiency but both Raman and NIR spectroscopy were shown to be more appropriate methods for the rapid prediction and evaluation of coat thickness. However, only Raman spectroscopy was able to differentiate tablets coated under different conditions accurately. In conclusion, direct thickness measurements were more time-consuming but provided assured coat thickness data. On the other hand, XRF, Raman and NIR spectroscopy methods were viable alternatives to provide complementary information for the study of tablet coatings. [47] Sérgio et al. reported that this work was aimed at the investigation of the use of near-infrared spectroscopy (NIRS) for the identification of counterfeit drugs. The identification is based on the comparison of the NIR spectrum of a sample with typical spectra of the authentic drug using multivariate modelling and classification algorithms (PCA/SIMCA). Initially, NIRS was evaluated for spectrum acquisition of various drugs, selected in order to observe the diversity of physico-chemical characteristics found among commercial products. The parameters which could affect the spectra of a given drug (especially if presented in solid form) were investigated and the results showed that the first derivative can minimize spectral changes associated with tablet geometry, physical differences in their faces and position in relation to the probe beam. The power of NIRS in distinguishing among similar pharmaceuticals was demonstrated and a. protocol is proposed to construct a multivariate model and to include it in a library allowing testing for drug authenticity. The methodology was evaluated with real samples of counterfeit drugs and was able to recognize all those presenting changes in composition as false. The results show unequivocally the potential of NIRS for rapid, on-site and non-destructive identification of counterfeit pharmaceuticals. [48] Ying et al. evaluated that the two components (paracetamol and amantadine hydrochloride) were simultaneously determined in combined paracetamol and amantadine hydrochloride tablets and powder by using near-infrared (NIR) spectroscopy and artificial neural networks (ANNs). The ANN models of three pretreated spectra (first-derivative, second-derivative and standard normal variate (SNV), respectively) were established. The mathematical corrected models of tablets were compared with those of the powder. In the models, the concentrations of paracetamol and amantadine hydrochloride as the active components were determined simultaneously and compared with the results of their separate determination. The parameters that affected the network were studied and the concentrations of the test set samples were predicted. The degree of approximation, a new evaluation criterion of the network was employed to prove the accuracy of the predicted results. [49] Karen M. Morisseau. et.al. reported that Nearinfrared reflectance Spectroscopy (NIRS) was used to evaluate and quantify the effect of compression force on the NIR spectra of tablets. A Flat, white tablets with no orientation (scoring, etc.) were manufactured on a Stokes Rotary Tablet Press. NIRS was used to predict tablet hardness on the following four formulations and one placebo matrix: hydrochlorothiazide (HCTZ) 15% and 20% in a placebo matrix (microcrystalline cellulose and magnesium stearate), and chlorpheniramine maleate (CTM) 2% and 6% in a placebo matrix. Five or six levels of tablet hardness from 2 to 12. www.johronline.com. 239 | P a g e.
(14) Katual M.K. et al., Jour. Harmo. Res. Pharm., 2015, 4(3), 227-245. kg were used for each formulation. Laboratory hardness data was compared to NIR reflectance data using a NIR Systems Rapid Content Analyzer®. Multiple linear regression and partial least squares regression techniques were used to determine the relationship between tablet hardness and NIRS spectra. An increase in tablet hardness produced an upward shift (increase in absorbance) in the NIRS spectra. A series of equations was developed by calibrating tablet hardness data against NIR reflectance response for each formulation. The results of NIRS hardness prediction were at least as precise as the laboratory hardness test (SE = 0.32). A NIRS method is presented which has the potential as an alternative to conventional hardness testing of tablets. [50] Camilla et al. reported that The use of a combination of Fourier-transform infrared (FTIR) spectroscopic imaging and desorption electrospray ionization linear ion-trap mass spectrometry (DESI MS) for characterization of counterfeit pharmaceutical tablets. The counterfeit artesunate antimalarial tablets were analyzed by both techniques. The results obtained revealed the ability of FTIR imaging in non-destructive micro-attenuated total reflection (ATR) mode to detect the distribution of all components in the tablet, the identities of which were confirmed by DESI MS. Chemical images of the tablets were obtained with high spatial resolution. The FTIR spectroscopic imaging method affords inherent chemical specificity with rapid acquisition of data. DESI MS enables high-sensitivity detection of trace organic compounds. Combination of these two orthogonal surface-characterization methods has great potential for detection and analysis of counterfeit tablets in the open air and without sample preparation. [51] John D. Kirsch; James K. Drennen evaluated that this study was to investigate the potential of near-infrared (near-IR) spectroscopy for nondestructive at-line determination of the amount of polymer coat applied to tablet cores in a Wurster column. The effects of coating. composition on the near-IR spectroscopic determination of ethylcellulose (Aquacoat ECD-30) or hydroxypropylmethylcellulose (HPMC)-based (Spectrablend) coating were evaluated, as were the performance of several chemometric techniques. Tablets were coated with up to 30% ethylcellulose or 22% HPMC, and samples were pulled at regular intervals during each coating run. Near-IR reflectance spectra of the intact tablets were then collected. The spectra were preprocessed by multiplicative scatter correction (MSC) or second derivative (D2) calculations, and calibrations developed using either principal components (PCs) or multiple spectral wavelengths. The near-IR method provided predictions of film applied with standard errors of 1.07% w/w or less. Near-IR spectroscopy can be profitably employed in a rapid and non-destructive determination of the amount of polymer film applied to tablets, and offers a simple means to monitor the film coating process. [52] S. Sonja Sekulic et.al reported that Nearinfrared spectroscopy is evaluated as an on-line technique for monitoring the homogeneity of a pharmaceutical blend during the blending process. Blends containing 10% sodium benzoate (model active), which provided an aromatic functionality typical of many pharmaceutical compounds, 39% microcrystalline cellulose (Avicel PH102), 50% lactose, and 1% magnesium stearate were developed to mimic the properties of an actual pharmaceutical blend. A twin-shell V-blender was modified to allow installation of a diffuse reflectance fiber-optic probe at the axis of rotation, and spectra were collected during three experiments using a commercially available near-infrared spectrophotometer. In each experiment, blender control and spectral data collection were controlled by a compilation of software packages. The experiments detected spectral changes which eventually converged to a point of constant variance. Further analysis of the spectral data showed the blend is homogeneous long before a typical blending. www.johronline.com. 240 | P a g e.
(15) Katual M.K. et al., Jour. Harmo. Res. Pharm., 2015, 4(3), 227-245. period is complete. Near-infrared spectroscopy has proven to be a feasible and effective method for the “real time” non invasive determination of homogeneity in a pharmaceutical blend. [53] Ana Carolina de Oliveira et.al. suggested that the utilization of the near-infrared spectroscopy (NIRS) and multivariate calibration to measure the percentage drug dissolution of four active pharmaceutical ingredients (APIs) (isoniazid, rifampicin, pyrazinamide and ethambutol) in finished pharmaceutical products produced in the Federal University of Rio Grande do Norte (Brazil). The conventional analytical method employed in quality control tests of the dissolution by the pharmaceutical industry is high-performance liquid chromatography (HPLC). The NIRS is a reliable method that offers important advantages for the large-scale production of tablets and for non-destructive analysis. NIR spectra of 38 samples (in triplicate) were measured using a Bomen FTNIR 160 MB in the range 1100–2500 nm. Each spectrum was the average of 50 scans obtained in the diffuse reflectance mode. The dissolution test, which was initially carried out in 900 mL of 0.1 N hydrochloric acid at 37 ± 0.5 °C, was used to determine the percentage a drug that dissolved from each tablet measured at the same time interval (45 min) at pH 6.8. The measurement of the four API was performed by HPLC (Shimadzu, Japan) in the gradiente mode. The influence of various spectral pretreatments (Savitzky-Golay smoothing, Multiplicative Scatter Correction (MSC), and Savitzky-Golay derivatives) and multivariate analysis using the partial least squares (PLS) regression algorithm was calculated by the Unscrambler 9.8 (Camo) software. The correlation coefficient (R2) for the HPLC determination versus predicted values (NIRS) ranged from 0.88 to 0.98. The root-mean-square error of prediction (RMSEP) obtained from PLS models were 9.99%, 8.63%, 8.57% and 9.97% for isoniazid, rifampicin, ethambutol and pyrazinamide, respectively, indicating that the NIR method is an effective and non-destructive. tool for measurement of drug dissolution from tablets.[54] Rafael da Silva Fernandes et al. reported that this study describes a method for nondestructive detection of adulterated glibenclamide tablets. This method uses near infrared spectroscopy (NIRS) and fluorescence spectroscopy along with chemometric tools such as Soft Independent Modeling of Class Analogy (SIMCA), Partial Least SquaresDiscriminant Analysis (PLS-DA) and Unfolded Partial Least Squares with Discriminant Analysis (UPLS-DA). Both brand name (Daonil) and generic glibenclamide tablets were used for analysis. The levels of glibenclamide in each type of tablet were evaluated by derivative spectrophotometry in the ultraviolet region. The results obtained from the NIR and fluorescence spectroscopy along with those obtained from multivariate data classification show that this combined technique is an effective way to detect adulteration in drugs for the treatment of diabetes. In the future, this method may be extended to detect different types of counterfeit medications. [55] Conclusion The non-destructive techniques are widely accepting the popularity now-a-days for the evaluation of tablets in pharmaceutical industries an alternative for the destructive techniques methods of evaluation. NonDestructive techniques are advantageous over the destructive techniques. In non-destructive techniques, FTIR and IR Spectroscopy techniques are used. So, the ideas behind the non-destructive techniques will be helpful in pharmaco-economics in coming future. Acknowledgement The author is extremely thankful to all the staffs of Rayat Bahra Institute of Pharmacy, Hoshiarpur, Punjab for their much needed help and for developing this review work. The guidance and support received from all the members who contributed to this work, was vital for the success of the review. The author is grateful for their constant support and help.. www.johronline.com. 241 | P a g e.
(16) Katual M.K. et al., Jour. Harmo. Res. Pharm., 2015, 4(3), 227-245. References 1. Joseph Price Remington (2006). Remington: The Science And Practice Of Pharmacy. Lippincott Williams & Wilkins. ISBN 0781746736. 2. Lachman L, Lieberman H, Kanig J; The Theory and Practice of industrial pharmacy. Varghese publication house, 4th edition 1991. 3. Indian pharmacopeia, 2007; volume-I; page no.182-183. 4. Griffiths, P.; de Hasseth, J.A. (18 May 2007). Fourier Transform Infrared Spectrometry (2nd ed.). WileyBlackwell. ISBN 0-471-19404-2. 5. "The Infracord double-beam spectrophotometer". Clinical Science 16 (2). 1957. 6. http://books.google.co.in/books. 7. http://www.agilent.com/about/newsroom/pr esrel/varian/2004/15sep-v04044.htm} 8. http://www.agilent.co.in/about/newsroom/pr esrel/2009/27jul-gp09016.html} 9. Banwell, C.N.; McCash, E.M. (1994). Fundamentals of Molecular Spectroscopy (4thed.) McGrawHill. ISBN 0-07-707976-0. 10. Robert White (1990). Chromatography/Fourier transform infrared spectroscopy and its applications. Marcel Dekker. ISBN 0-8247-8191-0. 11. Connes, J.; Connes, P. (1966). "NearInfrared Planetary Spectra by Fourier Spectroscopy. I. Instruments and Results". Journal of the Optical Society of America 56 (7): 896– 910. doi:10.1364/JOSA.56.000896. 12. Chamberain, J.; Gibbs Gebbie,,J.E.; H.E. (1969). "The determination of refractive index spectra by fourier spectrometry". Infrared Physics 9 (4): 189– 209.Bibcode: 1969 Inf Ph .9. 185C. doi:10.1016/0020-0891(69) 90023-2. 13. Nishikida, K.; Nishio, E.; Hannah, R.W. (1995). Selected applications of FT-IR. techniques. Gordon and Breach. p. 240. ISBN 2-88449-073-6. 14. Beauchaine, J.P.; Peterman, J.W.; Rosenthal,R.J. (1988). "Applications of FTIR/microscopy in forensic analysis". Microchimica Acta 94 (1-6): 133– 138.doi:10.1007/BF01205855. 15. Prati, S.; Joseph, E.; Sciutto, G.; Mazzeo, R. (2010). "New Advances in the Application of FTIR Microscopy and Spectroscopy for the Characterization of Artistic Materials".Acc. Chem. Res. 43 (6): 792– 801.doi:10.1021/ar900274f. PMID 2047673 3. 16. Michael Gaft, Renata Reisfeld, Gérard Panczer (2005).Luminescence spectroscopy of minerals and materials. Springer. p. 263. ISBN 3-540-21918-8. 17. Jef Poortmans, Vladimir Arkhipov (2006). Thin film solar cells: fabrication, characterization and applications. John Wiley and Sons. p. 189. ISBN 0-470-091266. 18. Elizarova TE, Shtyleva SV, Pleteneva TV. Using near-infrared spectrophotometry for the identification of pharmaceuticals and drugs. Pharmaceut Chem J 2008;42:432-4. 19. Skoog DA, Holler FJ, Nieman TA. Principles of instrumental analysis. 5th ed. New Delhi : Harcourt Asia PTE Ltd; 1998. 20. Rhodes CT, Morisseau K. Tablet evaluation using near-infrared spectroscopy. In: Swarbrick J, Boylan JC, editors. Encyclopedia of pharmaceutical technology. New York: Marcel Dekker; 2002. p. 3630-2. 21. Blanco M, Cruz J, Bautista M. Development of a univariate calibration model for pharmaceutical analysis based on NIR spectra. Anal Bioanal Chem 2008;392 :1367-72. 22. Food and Drug Administration. Guidance for industry. Q8(R1) Pharmaceutical Development,2009. 23. Kirsch JD, Drennen JK. Nondestructive tablet hardness testing by near-infrared spectroscopy: A new and robust spectral. www.johronline.com. 242 | P a g e.
(17) Katual M.K. et al., Jour. Harmo. Res. Pharm., 2015, 4(3), 227-245. best-fit algorithm. J Pharm Biomed Anal 1999;19:351-62. 24. Donoso M, Ghaly ES. Prediction of tablets disintegration times using near-infrared diffuse reflectance spectroscopy as a nondestructive method. Pharm Dev Technol 2005;10:211-7. 25. Donoso M, Ghaly ES. Prediction of drug dissolution from tablets using near-infrared diffuse reflectance spectroscopy as a nondestructive method. Pharm Dev Technol 2004;9:247-63. 26. Jedvert I, Josefson M, Langkilde F. Quantification of an active substance in a tablet by NIR and Raman spectroscopy. J Near Infrared Spec 1998; 6:279-89. 27. Food and Drug Administration. Guidance for industry. PAT - A Framework for Innovative Pharmaceutical Development, Manufacturing, and Quality Assurance, 2004. 28. Cogdill RP, Herkert T, Anderson CA, Drennen III JK. Synthetic calibration for efficient method development: Analysis of tablet API concentration by near-infrared spectroscopy. J Pharma Innovation 2007;2:93-105. 29. ICH Harmonised Tripartite Guideline. Pharmaceutical Development Q8(R1), 2008. 30. Reich G. Near-infrared spectroscopy and imaging: Basic principles and pharmaceutical applications. Adv Drug Deliv Rev 2005;7:1109-43 31. Iyer M, Morris HR, Drennen JK. Solid dosage form analysis by near infrared spectroscopy: Comparison of reflectance and transmittance measurements including the determination of effective sample mass. J Near Infrared Spec 2002;10:233-45. 32. Donoso M, Kildsig DO, Ghaly ES. Prediction of tablet hardness and porosity using near-infrared diffuse reflectance spectroscopy as a nondestructive method. Pharm Dev Technol2003; 8:357-66. 33. Morisseau KM, Rhodes CT. Near-infrared spectroscopy as a nondestructive alternative. to conventional tablet hardness testing. Pharm Res 1997;14:108-11. 34. Ebube NK, Thosar SS, Roberts RA, Kemper MS, Rubinovitz R, Martin DL, et al. Application of near-infrared spectroscopy for nondestructive analysis of Avicel powders and tablets. Pharm Dev Technol 1999;4:19-26. 35. Otsuka M, Yamane I. Prediction of tablet hardness based on near infrared spectra of raw mixed powders by chemometrics. J Pharm Sci 2006;95:1425-33. 36. Chen Y, Thosar SS, Forbess RA, Kemper MS, Rubinovitz RL, Shukla AJ. Prediction of drug content and hardness of intact tablets using artificial neural network and near-infrared spectroscopy. Drug Dev Ind Pharm 2001;27:623-31. 37. Otsuka M, Yamane I. Prediction of tablet properties based on near infrared spectra of raw mixed powders by chemometrics: Scale-up factor of blending and tableting processes. JPharm Sci 2009;98:4296-305. 38. Otsuka M, Mouri Y, Matsuda Y. Chemometric evaluation of pharmaceutical properties of antipyrine granules by nearinfrared spectroscopy. AAPS PharmSciTech 2003;4:E47. 39. Tanabe H, Otsuka K, Otsuka M. Theoretical analysis of tablet hardness prediction using chemoinformetric near-infrared spectroscopy. Anal Sci 2007;23:857-62. 40. Freitas MP, Sabadin A, Silva LM, Giannotti FM, do Couto DA, Tonhi E, et al. Prediction of drug dissolution profiles from tablets using NIR diffuse reflectance spectroscopy: A rapid and nondestructive method. J Pharm Biomed Anal 2005;39:1721. 41. Malik I, Poonacha M, Moses J, Lodder RA. Multispectral imaging of tablets in blister packaging. AAPS PharmSciTech 2001;2:17 42. Blanco M, Bautista M, Alcalà M. API determination by NIR spectroscopy across. www.johronline.com. 243 | P a g e.
(18) Katual M.K. et al., Jour. Harmo. Res. Pharm., 2015, 4(3), 227-245. pharmaceutical production process. AAPS PharmSciTech 2008; 9:1130-35. 43. Meza CP, Santos MA, Romañach RJ. Quantitation of drug content in a low dosage formulation by transmission near infrared spectroscopy. AAPS PharmSciTech 2006; 7:1-9. 44. Ricci C, Eliasson C, Macleod NA, Newton PN, Matousek P, Kazarian SG. Characterization of genuine and fake artesunate anti-malarial tablets using Fourier transform infrared imaging and spatially offset Raman spectroscopy through blister packs. Anal Bioanal Chem 2007;389:152532. 45. Yang H, Irudayaraj J. Rapid determination of vitamin C by NIR, MIR and FT-Raman techniques. J Pharm Pharmacol 2002;54:1247-55. 46. Ziyaur Rahman, Ahmed S. Zidan, Mansoor A. Khan;International Journal of Pharmaceutics; Risperidone solid dispersion for orally disintegrating tablet: Its formulation design and non-destructive methods of evaluation Volume 400, Issues 1–2, 15 November 2010, Pages 49–58. 47. C. Cahyadi; A.D. Karande; L.W. Chan; P.W.S. Heng; International Journal of Pharmaceutics Comparative study of nondestructive methods to quantify thickness of tablet coatings Volume 398, Issues 1–2, 15 October 2010, Pages 39–49 48. Sérgio Henrique Frasson Scafi and Celio Pasquini; Identification of counterfeit drugs using near-infrared spectroscopy Instituto de Química, Universidade Estadual de Campinas, CP 6154, 13083-970 Campinas, SP, Brazil 49. Ying Dou; Ying Sun;Yuqiu Ren; Ping Ju; Yulin Ren; Journal of Pharmaceutical and Biomedical Analysis Simultaneous nondestructive determination of two components of combined paracetamol and amantadine hydrochloride in tablets and powder by NIR spectroscopy and artificial. neural networks Volume 37 3, 9 M, Issue arch 2005, Pages 543–549 50. Karen M. Morisseau; Christopher T. Rhodes; Pharmaceutical Research; NearInfrared Spectroscopy as a Nondestructive Alternative to Conventional Tablet Hardness Testing January 1997, Volume 14, Issue 1, pp 108111 51. Camilla Ricci; Leonard Nyadong; Facundo M. Fernandez; Paul N. Newton; Sergei G. Kazarian; Analytical and Bioanalytical Chemistry Combined Fourier-transform infrared imaging and desorption electrospray-ionization linear ion-trap mass spectrometry for analysis of counterfeit antimalarial tablets January 2007, Volume 387, Issue 2, pp 551-559 Date: 29 Nov 2006 52. John D. Kirsch; James K. Drennen; Pharmaceutical Research Near-Infrared Spectroscopic Monitoring of the Film Coating Process February 1996, Volume 13, Issue 2, pp 234-237 53. S. Sonja Sekulic ; Howard W. Ward , II; Daniel R. Brannegan ; Elizabeth D. Stanley ; Christine L. Evans ; Steven T. Sciavolino ; Perry A. Hailey ; and Aldridge; Pfizer Central Research, Eastern Point Road, Groton, Connecticut, 06340 and Pfizer Central Research, On-Line Monitoring Of Powder Blend Homogeneity By Near-Infrared Spectroscopy Anal. Chem., 1996, 68 (3), pp 509–513 Publication Date (Web): February 1, 1996 54. Ana Carolina de Oliveira Neves; Gustavo Mesquita Soares; Stéphanie Cavalcante de Morais; Fernanda Saadna Lopes da Costa; Dayanne Lopes Porto; Kássio Michell Gomes de Lima; Journal of Pharmaceutical and Biomedical Analysis Dissolution testing of isoniazid, rifampicin, pyrazinamide and ethambutol tablets using near-infrared spectroscopy (NIRS) and multivariate calibration Volume 57, 5 January 2012, Pages 115–119. www.johronline.com. 244 | P a g e.
(19) Katual M.K. et al., Jour. Harmo. Res. Pharm., 2015, 4(3), 227-245. 55. Rafael da Silva Fernandes; Fernanda Saadna Lopes da Costa; Patrícia Valderrama; Paulo Henrique Março; Kássio Michell Gomes de Lima; Journal of Pharmaceutical and Biomedical Analysis Non-destructive. detection of adulterated tablets of glibenclamide using NIR and solid-phase fluorescence spectroscopy and chemometric methods Volume 66, July 2012, Pages 85– 90. www.johronline.com. 245 | P a g e.
(20)
Figure
![Fig no. 3 Schematic calibration curve for the determination] of the tablet hardness from the](https://thumb-us.123doks.com/thumbv2/123dok_us/9813598.1967203/7.595.325.552.352.500/fig-schematic-calibration-curve-determination-tablet-hardness.webp)
Related documents
Acute MI stage (Figure 6 A1-A5): 48 hours after reperfused MI, the infarcted region appeared almost isointense on T1WI, but hyperintense to a larger extent at the lateral and
To assess whether UUKV and HRTV NSs could inhibit type I IFN signaling, we transfected HEK293T cells with a reporter plasmid encoding luciferase under the control of an
of coverage established in our exome sequencing, we did not identify any two patients who had de novo variants in the same gene, any de novo coding variants unique to the tumours,
The results showed that treatments of high concentrations of bacterial cells and their free cells had a significant effect on the mortality of all treated ootheca for four times
Instead of a single military revolution embodied by linear infantry tactics, there were multiple revolutions (one could even call them evolutions) in how armies fought: an
42 To assess the mechanism(s) of solute release from calcein-HPPH liposomes upon phototriggering, we evaluated 1) amounts of liposome- encapsulated calcein and HPPH per µ
Liver transplantation has been accepted as therapy for children with end stage liver disease largely because of significant improvement in overall sur- vival rates.’ As
In this approached system, secure code PHP functions are proposed to detect and prevent form XSS attack by using two methods, the first one is to use regular expression to
