1
Development and Validation of an Item-bank
for an Adaptive Computer-based Test
Assessing K-4 Students’ Mathematical
Competence
Macarena Larraina, Marianela Navarroa, Micaela Buraschia, Isabel Torresa and Kattia Muñoza
Corresponding author: Macarena Larrain ([email protected])
aUniversidad de los Andes, Chile
Keywords: elementary mathematics, formative assessment, computer-based test, item validation, mathematics adaptive assessment
International Journal of Innovation in Science and Mathematics Education, 26(1), 1–15, 2018.
Abstract
This paper reports the development and validation process of an item-bank for an adaptive computer-based test aimed at assessing kindergarten to fourth grade students’ mathematical competence. A total of 528 multiple-choice items for 44 learning objectives were selected from the Quantile Framework Database, adapted and translated. A sample of 5,145 Chilean students from kindergarten to fourth grade attending 22 schools participated in the statistical validation process. Item facility and discrimination indices were analysed. Their distributions within grade levels and the four content domains were explored. Results confirm that a local validation of items was necessary.
Introduction
People deal with diverse mathematical situations daily, all of which they have to learn to interpret so as to be able to comprehend and analyse the information they perceive (National Council of Teachers of Mathematics [NCTM] & National Association for the Education of Young Children [NAEYC], 2002). The world in which we live is a quantitative world, making it necessary to have adequate comprehension of mathematics to understand what happens around us. This is why Villarroel (2009) states that cultural adaptability depends mainly on an individual's mathematical competence, due to the fact that they need to carry out such ordinary tasks as paying accounts, going shopping, following recipes and sticking to a budget, among others.
The relevance of learning mathematics in early stages
2
also contributes to structuring students’ logical thinking. In this sense, the development of mathematical competence helps people make better judgments as they are based on reasoning through logical steps using quantitative data, helping make decisions in a constructive, reflexive and committed manner (Agencia de Calidad de la Educación, 2014).
Additionally, as stated by Clements and Sarama (2009) ‘in a global economy with the vast majority of jobs requiring more sophisticated skills than in the past, […] educators, communities and business leaders have expressed strong concern about students’ mathematics achievement’ (p. 4), recognising its increasing importance for the individual’s subsequent professional achievement and their role in society (Kilpatrick, Swafford, & Findell, 2001; Doig, McCrae, & Rowe, 2003).
Detecting difficulties and implementing strategies on time
To learn new concepts and skills in mathematics, the student builds on those he has already mastered. Thus, if a student does not fully understand a previous concept or skill, he will begin to lag behind, making future progress more difficult (Hunting, Mousley, & Perry, 2012). Therefore, one of the main reasons for the recent surge of attention to mathematics in early childhood is that early knowledge strongly affects later success in mathematics (Denton & West, 2002). Thus, it is not an overstatement to say that what children know early, affects them for many years thereafter (Horne, 2005; National Mathematics Advisory Panel [NMP], 2008).
The early diagnosis of mathematical difficulties has become an essential task, since it allows teachers to build a profile about the student’s skill development and identify weaknesses that must be addressed to promote further progress (Taylor-Cox & Oberdorf, 2013). The diagnosis is thus crucial for designing and providing teaching strategies that may help students overcome their difficulties and improve their perspectives. The moment in which this process takes place is also decisive. If a learning difficulty is not addressed promptly, it is more likely to be sustained in time (Horne, 2005).
Furthermore, when teachers plan promptly, they are more likely to make effective pedagogical decisions to compensate for the diagnosed deficiencies on time. Thus, it is crucial to assess and analyse assessment results as early as possible to make sure the correct issues are being undertaken. By periodically receiving information regarding their students’ abilities, teachers are able to adjust their plans and strategies to meet the children’s needs, taking into consideration what challenges they will be able to face without frustration (Taylor-Cox & Oberdorf, 2013).
Finally, implementing strategies to address early difficulties in a timely manner will also foster students’ motivation, as they will feel better prepared to deal with mathematical problems. They will understand that there is no such thing as a lack of mathematical aptitude (Hunting et al., 2012), and that mathematical competence is a skill in constant development that needs to be practiced before it is mastered (Agencia de Calidad de la Educación, 2016). Children need to view mathematics as sensible, useful, and worthwhile and view themselves as capable of thinking mathematically (Clements & Sarama, 2009).
3
Purpose of the study
In Latin America, a variety of standardized assessments is used to evaluate students’ mathematical competence. Some of them, such as PISA (Programme for International Student Assessment, developed by the Organisation for Economic Co-operation and Development [OECD]), TIMSS (Trends in International Mathematics and Science Study established by the International Association for the Evaluation of Educational Achievement [IEA]) and TERCE (Third Regional Comparative and Explanatory Study, applied by the United Nations Educational, Scientific and Cultural Organization [UNESCO]), are applied to a sample in each country and are aimed at developing educational policies and not at informing pedagogical decisions at a classroom level (Ravela et al., 2008).
In addition, some countries have their own systems, such as Chile, where the government relies on a state-controlled assessment known as Education Quality Measurement System [SIMCE] for its acronym in Spanish, which evaluates all students attending 4th, 6th, 8th and 10th grade on reading comprehension, writing, mathematics, natural sciences, history, geography, and social sciences. The objective of this assessment is to provide relevant information to the country and to each school about their students’ learning achievements. However, the results are more intended to provide guidelines for the definition of educational policies, than to be used to adjust strategies inside classrooms. Moreover, the assessment reports are delivered with a significant lag and do not include students’ individual performance results (Informe del Equipo de Tarea para la Revisión del SIMCE, 2015).
However, no validated instrument assessing kindergarten to fourth grade students’ mathematical competence and providing immediate and detailed individual information has been found in Latin America. Hence, the aim of this study is to develop and validate an item-bank for an adaptive computer-based assessment of K-4 students’ mathematical competence. The final instrument will be computer-based, which allows not only for generating immediate results reports, but also for adaptive testing in the way that different students will get different questions based on their performance on previous questions. One of the most relevant advantages of this feature is that it provides more precise information about each student’s abilities. Performance reports should aid teachers and school leaders in identifying weaknesses and strengths of individuals and groups of students in different mathematics content domains to design tailored intervention strategies and make timely decisions regarding their students’ individual needs.
Methodology
Instrument planning and design
4
In order to keep the test extension reasonable, in a second stage, a set of eight learning goals was selected for each grade level, from kindergarten to 2nd grade; and another two sets of 10 learning goals were selected for 3rd and 4th grade. The selection of goals was facilitated through a questionnaire which was completed by teachers, school leaders and experts in mathematics education. For each objective from the curricular analysis, participants decided its relevance in the school curriculum using a Likert scale. Also, each domain was weighted according to the percentage of learning goals in the Chilean curriculum. Considering these two pieces of information, each grade level’s learning goals for each domain to be assessed within the test were selected. Table 1 shows the number of selected learning goals for each domain per grade level.
Table 1: Learning goals distribution by domain
Numbers and Operations
Patterns and Algebra
Geometry and Measurement
Data and Probability
Total
Kindergarten 2 1 4 1 8
1st grade 4 1 2 1 8
2nd grade 4 1 2 1 8
3rd grade 5 1 3 1 10
4th grade 5 1 3 1 10
Item selection, translation and adaptation
On the third stage, items from the Metametrics Inc. database matching the selected objectives were identified. The use of pre-existing questions has been recommended by Hyman, Lamb and Bulmer (2006) as they have already been tested and their psychometric properties are likely to be high. For this reason, a number of researchers have opted for using items from previous surveys in their own developments (see for example Hill, Sharma, O’Byrne, & Airey, 2014; Wattanakasiwich, Taleab, Sharma, & Johnston. 2013).
The process of item selection was iterative: a set of items for each objective was pre-selected by an expert in mathematics education from Metametrics and then, their alignment with the selected objectives was validated by experts from the research team. For each objective at least 10 multiple-choice items, with four answer options each, were chosen to be translated into Spanish and included in the paper and pencil pilot-testing. A set of 94 items for kindergarten, 105 items for first grade, 108 items for second grade, 111 items for third grade and 111 items for fourth grade were translated into Spanish by three bilingual team members. Then, each translated item was compared to its original by a bilingual expert in mathematics education to ascertain consistency among both versions and an adequate use of mathematics vocabulary and terms. In addition, during the translation process, cultural adaptations were made when necessary. For example, names and some contexts used in word problems and a few items including imperial measurement units were slightly modified.
5
additional set of items, with similar characteristics to the original items, developed with the purpose of making available the type of questions used.
Item validation
For the validation process, the items for each grade level were organized randomly into four test forms. In addition, for each form a second version was built, in which the item order was inverted to avoid students’ tiredness having an impact on the results. This yielded a total of 40 test forms with 24 to 32 items each.
A sample of 5,145 students in grades kindergarten through to fourth grade (K=852; 1st=1,082; 2nd=1,097; 3rd=1,066 and 4th=1,048) participated in the study. Their demographic information can be inferred from the school type they attend, since it is generally related to their families’ income. Public schools are fully government-funded and most of their students come from low income families, representing about 38% of the school population. Subsidized schools which account for more than 54% of Chilean students, receive some funding from the government and another small portion is paid by parents who are typically middle-income families. The remaining 8% of school students attend private schools and come from high-income families (Valenzuela, Bellei, & de los Ríos, 2014; Mineduc, 2015). Moreover, students’ mathematics achievement is closely related to school type, with private schools performing, on average, considerably better than public schools and also better than subsidized schools. For instance, 4th grade students results on the standardized national assessment (SIMCE), for which the national average is 262 points, show that students in subsidized schools outperform students in public schools by 18.9 points when not controlling by socioeconomic background and by 7.3 points when taking this into account (Agencia de Calidad de la Educación, 2016).
Participating students came from nine public, five subsidized and eight private schools in a large metropolitan area. Table 2 describes the number of students at each grade level for the three types of schools.
Table 2: Student distribution by type of school
Type of school
Public Subsidized Private Total
Grade level Kindergarten 235 327 290 852
1st grade 313 342 427 1082
2nd grade 340 352 405 1097
3rd grade 311 372 383 1066
4th grade 329 313 406 1048
6
Ethics clearance was needed to pursue this research. First, the University´s Ethics Committee reviewed and suggested some changes to the permission document that was later sent to school principals and parents. Once the required modifications were made and the committee´s final approval given, the document was sent to participating schools along with a document explaining this research in more detail and the stages where the school would participate. All schools, with one exception, decided that the permission to participate would be given by the school´s principal. The one school that decided to send the document home, for parents’ information and approval, resulted in five cases of parents deciding they would not let the student be part of the research. Those students’ answers were removed from the final database.
The tests were administered by trained evaluators, who explained the instructions to each group of students and answered questions related to the way of responding. Because of their young age, students marked their responses directly on the test and later, individual answers were tabulated into the database. For non-reading students (i.e. kindergarten and first grade), each question and their answer options were read aloud by the evaluator to the whole group. Response time generally ranged from 20 to 35 minutes.
Because each test form was not seen as a single test, but as a means to evaluate the items’ psychometric properties, no internal consistency was calculated for the forms. Rather, items were analysed using classical test theory to determine their facility and discrimination indices, and with this information the items that would build the bank of items for the computer-based assessment were selected.
The computer-based assessment structure required the item bank to have at least five items for each learning objective in three different facility levels: 1 easy, 3 medium and 1 hard. For this reason, the proportion of correct answers was used as the index for item facility. Thus, easy items show higher proportion and hard items display lower proportion.
Five facility level categories were defined based on ranges adapted from various studies (Bazán, 2000; Grupo de Análisis para el Desarrollo [GRADE], 2013; Sánchez & Reyes, 2015; Verdugo, Solaz-Portolés, & San José, 2016), according to their facility levels: very easy (> .85 correct answers), easy (.61 to .85), medium (.41 to .60), hard (.16 to .40) and very hard (< .15). Very easy and very hard items were to be discarded and not included in the item bank.
Similarly, we calculated point biserial correlation coefficients (𝑟𝑟𝑟) to estimate item discrimination
since we had one interval scale or continuous variable (i.e. student achievement) and a dichotomous variable (i.e. correct/incorrect answer for each item). Items with coefficients close to zero show a weaker relationship between both variables, whereas correlations closer to 1, indicate a stronger relationship. In other words, higher coefficients indicate a better correlation between responses to a given item and the corresponding total test scores, being more precise at separating students who performed better on the whole test from weaker students. Thus, four item discrimination index categories were defined based on ranges adapted from Alagumalai and Curtis (2005) and Ebel and Frisbie (1991): poor discrimination (𝑟𝑟𝑟< .2), fair discrimination (.2 ≤ 𝑟𝑟𝑟< .3), good
discrimination (.3 ≤ 𝑟𝑟𝑟< .5) and very good discrimination (𝑟𝑟𝑟 ≥ .5). As a general criterion,
7
Results
Item facility indices
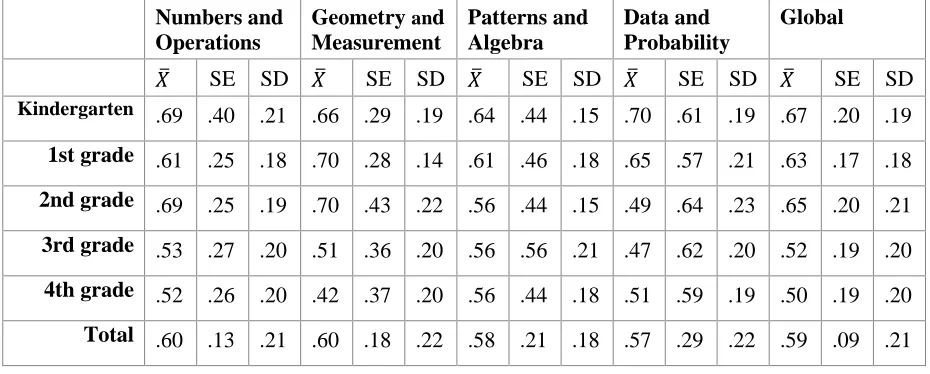
Considering all 528-piloted items, the average item-facility-level was .59, with a standard deviation (SD) of .21. Similar facility levels were obtained across the four domains. Third and fourth grade items showed higher facility levels overall than lower grades. Table 3 shows the mean scores, standard errors and standard deviations.
Table 3: Mean facility indices, standard error and standard deviation by each sample on every grade level and domain
Numbers and Operations
Geometry and Measurement
Patterns and Algebra
Data and Probability
Global
𝑋̅ SE SD 𝑋̅ SE SD 𝑋̅ SE SD 𝑋̅ SE SD 𝑋̅ SE SD Kindergarten .69 .40 .21 .66 .29 .19 .64 .44 .15 .70 .61 .19 .67 .20 .19 1st grade .61 .25 .18 .70 .28 .14 .61 .46 .18 .65 .57 .21 .63 .17 .18
2nd grade .69 .25 .19 .70 .43 .22 .56 .44 .15 .49 .64 .23 .65 .20 .21
3rd grade .53 .27 .20 .51 .36 .20 .56 .56 .21 .47 .62 .20 .52 .19 .20
4th grade .52 .26 .20 .42 .37 .20 .56 .44 .18 .51 .59 .19 .50 .19 .20
Total .60 .13 .21 .60 .18 .22 .58 .21 .18 .57 .29 .22 .59 .09 .21
According to their facility level, a .10 of the 528 items were categorised as very easy, .40 as easy, .31 as medium, .17 as hard and only .02 as very hard items. This resulted in a .13 (N= 66) of the items being discarded for being either too difficult or too easy. Besides, a vast majority of items, over .70, was concentrated on the easy and medium facility categories. Table 4 shows the proportion of items of each content domain that were classified into the facility categories. Numbers and Operations and Geometry and Measurement showed similar distributions. Patterns and Algebra items tended more to the easy and medium levels. Interestingly, in the Data and Probabilities domain, it appeared to be a higher proportion of hard items, but none very hard.
Table 4: Proportion of items classified into facility categories per domain
Very easy Easy Medium Hard Very hard
Numbers and Operations .11 .39 .33 .15 .02
Geometry and Measurement .13 .41 .27 .17 .03
Patterns and Algebra .30 .45 .38 .13 .01
8
Item discrimination indices
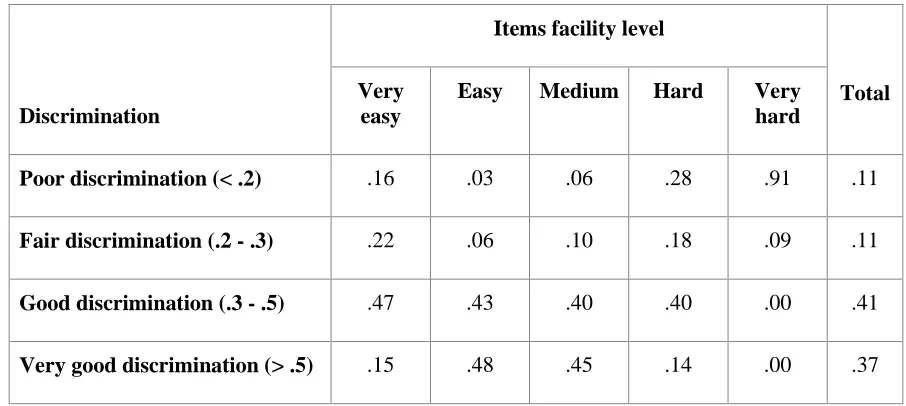
In addition to the facility level, the point-biserial coefficients of the items were calculated in a classical way. The item point-biserial coefficients ranged from -.22 to .69, with a mean of .40 and a standard deviation of .18. Facility levels are related to discrimination properties, as items at both achievement extremes do not tend to show high discrimination indices. Table 5 shows the percentage of poor discrimination, fair discriminating, good discriminating and very good discriminating items within each item-facility-category.
Table 5: Item discriminations within facility level categories
Discrimination
Items facility level
Total Very
easy
Easy Medium Hard Very
hard
Poor discrimination (< .2) .16 .03 .06 .28 .91 .11
Fair discrimination (.2 - .3) .22 .06 .10 .18 .09 .11
Good discrimination (.3 - .5) .47 .43 .40 .40 .00 .41
Very good discrimination (> .5) .15 .48 .45 .14 .00 .37
Most easy, medium and hard items had good or very good discriminations indices. That means that easy items were often answered correctly by students achieving at the lower and higher levels, students with an intermediate level of achievement usually gave correct answers to medium-level-items and hard medium-level-items were mostly answered correctly by high performing students. Similarly, a high proportion of items at an intermediate level discriminated well, indicating that they were easy for high-performing students and harder for weaker students.
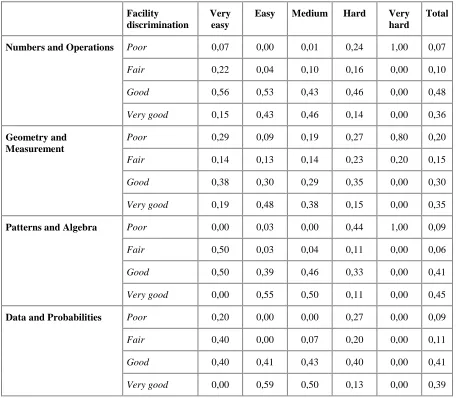
Remarkably, within the easy, medium and hard facility levels, poor discriminating items were found in a higher rate in hard items in all four content domains. This suggests that items that are more difficult were often answered incorrectly by good-performing students and correctly by intermediate or low achievers. More details on how discrimination indices and facility levels were distributed across domains are displayed in Table 6 (see below).
As expected, most very hard items showed poor discrimination properties. On the contrary, a high proportion of very easy items surprisingly showed fair, good and very good discrimination indices. When looking more into detail these items, it can be seen that most of them are from the Numbers and Operations (.49) and Geometry and Measurement (.38) domains.
9
Table 6: Item discrimination indices distribution within facility level categories on each domain
Discussion and conclusions
This work confirms not only the importance of learning mathematics in early stages, but also of detecting difficulties promptly in order to intervene and address them in a timely manner. First, the importance of mathematics relies on the fact that the tasks students face while learning this particular subject help them develop problem solving skills and critical thinking; abilities that will be crucial for their subsequent achievement in real life. Second, the early assessment of mathematical skills is proven crucial, since it allows teachers to identify and address potential difficulties to prevent them from being sustained in time and to promote students further progress. Moreover, early detection of mathematical deficiencies enables the selection and design of specific pedagogical strategies to meet the children’s individual needs.
Facility discrimination
Very easy
Easy Medium Hard Very
hard
Total
Numbers and Operations Poor 0,07 0,00 0,01 0,24 1,00 0,07
Fair 0,22 0,04 0,10 0,16 0,00 0,10
Good 0,56 0,53 0,43 0,46 0,00 0,48
Very good 0,15 0,43 0,46 0,14 0,00 0,36
Geometry and Measurement
Poor 0,29 0,09 0,19 0,27 0,80 0,20
Fair 0,14 0,13 0,14 0,23 0,20 0,15
Good 0,38 0,30 0,29 0,35 0,00 0,30
Very good 0,19 0,48 0,38 0,15 0,00 0,35
Patterns and Algebra Poor 0,00 0,03 0,00 0,44 1,00 0,09
Fair 0,50 0,03 0,04 0,11 0,00 0,06
Good 0,50 0,39 0,46 0,33 0,00 0,41
Very good 0,00 0,55 0,50 0,11 0,00 0,45
Data and Probabilities Poor 0,20 0,00 0,00 0,27 0,00 0,09
Fair 0,40 0,00 0,07 0,20 0,00 0,11
Good 0,40 0,41 0,43 0,40 0,00 0,41
10
The current study described the process of designing and validating an item-bank for an adaptive computer-based test to assess kindergarten to fourth grade students’ mathematical knowledge and skills. A set of objectives was selected for each grade level after a curricular analysis of four Latin American countries experts’ content validation and domain weighting. Items were selected from the Quantile® Framework database following an iterative process of content validation to properly match the measured learning objectives. This also allowed setting a good starting point, using previously validated items. After translation, 528 items were validated with a sample of more than 5,000 K-4th grade students for their use in Chile. Results suggest that, although items were previously developed and validated in the United States, a local validation was necessary in order to account for a different cultural context. In fact, of the empirical data of 105 items, roughly .20 of all items, did not meet the selection criterion either because their facility level was too low or too high or because they showed poor discrimination indices. In other words, some items within a normal range of facility and discriminating well in one country showed different psychometric characteristics in another country, making evident the need to empirically validate instruments in the context they are going to be used.
On the other hand, we obtained a considerable proportion of items of different facility levels with good and very good discrimination indices, which will build a robust item-bank for the adaptive computer-based test for the assessment of K-4 students’ mathematical knowledge and skills. This instrument will fill a gap in Latin America´s mathematics education by providing teachers and school principals with a valid tool to periodically evaluate their students’ learning. Automated results reports will allow them to receive valuable information promptly and use it to make effective pedagogical decisions and design strategies that meet their students’ needs and, therefore, make considerable improvements to their understanding of mathematics.
Acknowledgements
The financial support for this study came from Corfo (Corporación de Fomento de la Producción), Chilean Government with the project 15IPPID-45776.
The validated items were constructed with the collaboration of Metametrics, Inc., an American firm that develops scientific measures of academic achievement and complementary technologies that link assessment results with real-world instruction.
All project procedures were in accordance with the ethical standards of the institutional responsible committee. Informed consent was obtained from principals or parents of students participating in the study.
References
Agencia de Calidad de la Educación. (2014). Informe Nacional Resultados Chile PISA 2012. Gobierno de Chile. Agencia de Calidad de la Educación. (2016). Resultados Educativos 2016. Gobierno de Chile.
Alagumalai, S., & Curtis, D. (2005). Classical test theory. In S. Alagumalai, D.D. Curtis & N. Hungi (Eds.), Applied Rasch measurement: A book of exemplars (pp. 1-14). The Netherlands: Springer.
Bazán, J. (2000). Evaluación Psicométrica de las Preguntas y Pruebas Crecer 96. Lima: Ministerio de Educación. Retrieved from: https://www.ime.usp.br/~jbazan/download/eval_psicometrica_preguntas_pruebas_crecer_9.pdf Clements, D., & Sarama, J. (2009). Early childhood mathematics education research: Learning trajectories for
young children. New York: Routledge.
Cohen, J. (1960). Kappa: coefficient of concordance. Educational and Psychological Measurement, 20(37). Denton, K., & West, J. (2002). Children's reading and mathematics achievement in kindergarten and first grade.
Washington, DC: National Center for Education Statistics. Retrieved from
11
Doig, B., McRae, B., & Rowe, K. (2003). A good start to numeracy: Effective numeracy strategies from research and practice in early childhood. Canberra ACT, Australia: Australian Council for Educational Research.
Ebel, R. L., & Frisbie, D. A. (1991). Essentials of educational measurement (5th ed). New Dehli: Prentice Hall of India.
Grupo de Análisis para el Desarrollo. (2013). Informe el estudio de línea de base sobre uso del tiempo y otras variables de calidad educativa en II.EE. públicas secundarias. Lima: Ministerio de Educación
http://datos.minedu.gob.pe/sites/default/files/Informe%20del%20estudio%20de%20l%C3%ADnea%20de%20b ase%20sobre%20uso%20del%20tiempo%20y%20otras%20variables%20de%20calidad%20educativa%20en%2 0II.EE_.%20p%C3%BAblicas%20secundarias.compressed_0.pdf
Hefty, L. J. (2015). STEM gives meaning to mathematics. Teaching Children Mathematics, 21(7), 422–429. Hill, M., Sharma, M.D., O'Byrne, J., & Airey, J. (2014). Developing and evaluating a survey for representational
fluency in science. International Journal of Innovation in Science and Mathematics Education, 22(5), 22–42. Horne, M. (2005). The effects of number knowledge at school entry on subsequent number development: A five-year
longitudinal study. Melbourne, Australia: Australian Catholic University. Retrieved from http://www.merga.net.au/documents/RP482005.pdf
Hunting, R., Mousley, J., & Perry, B. (2012). Young children learning mathematics: A guide for educators and families. Melbourne, Australia: Australian Council for Educational Research [ACER].
Hyman, L., Lamb, J., & Bulmer, M. (2006). The use of pre-existing survey questions: Implications for data quality.
Proceedings of the European Conference on Quality in Survey Statistics.
Informe del Equipo de Tarea para la Revisión del SIMCE, (2015). Hacia un sistema completo y equilibrado de evaluación de los aprendizajes en Chile. Recuperado de
http://www.mineduc.cl/wp-content/uploads/sites/19/2015/11/Informe-Equipo-de-Tarea-Revisi%C3%B3n-Simce.pdf
Kilpatrick, J., Swafford, J., & Findell, B. (2001). Adding it up: Helping children learn mathematics. Mathematics Learning Study Committee, Center for Education, Division of Behavioral and Social Sciences and Education. Washington, DC: National Academy Press.
Mineduc. (2015). Variación de matrícula y tasas de permanencia por sector. Ministerio de Educación, Gobierno de Chile.
National Council of Teachers of Mathematics [NCTM] & National Association for the Education of Young Children [NAEYC]. (2002). Early childhood mathematics: Promoting good beginnings. Washington DC: NAEYC. National Mathematics Advisory Panel [NMP]. (2008). Foundations for success: The final report of the National
Mathematics Advisory Panel. Washington D.C.: US Department of Education.
Ravela, P., Arregui, P., Valverde, G., Wolfe, R., Ferrer, G., Martínez, F., Aylwin, M., & Wolff, L. (2008). Las Evaluaciones Educativas que América Latina Necesita. Documento de Trabajo N. 40. Santiago de Chile: PREAL.
Sánchez, H., & Reyes, C. (2015). Prueba de comprensión lectora para el nivel primario, NEP-SR (Formas A y B). Lima: Universidad Ricardo Palma
http://repositorio.urp.edu.pe/bitstream/handle/urp/673/PRUEBA%20COMPRENSION%20LECTORA.PDF;jse ssionid=75644FD12DCD84E4AAF6A2CA30206F89?sequence=3
Singleton, C. (2001). Computer-based assessment in education. Educational and Child Psychology, 18(3), 58–74. Taylor-Cox, J., & Oberdorf, C. (2013). Using formative assessment to drive mathematics instruction in grades
PreK-2. Abingdon: Routledge Books.
Valenzuela, J.P., Bellei, C., & de los Ríos (2014). Socioeconomic school segregation in a market-oriented educational system. The case of Chile. Journal of Educational Policy, 29(2), 217–241.
Verdugo, J.J., Solaz-Portolés, J.J., & San José, V. (2016). Pre-service primary school teachers' science content knowledge: An instrument for its assessment. International Journal of Innovation in Science and Mathematics Education, 24(2), 37–51.
Villarroel, J.D. (2009). Origen y desarrollo del pensamiento numérico: una perspectiva multidisciplinar. Electronic Journal of Research in Educational Psychology. No 17, 7(1), 555–604.
12
Appendix
: Sample items (2nd grade)The following items belong to an additional set of items, developed for illustrative purposes with similar characteristics to the original ones. All of them are 2nd grade questions. Domain and facility level is specified before each question. An English translation is provided in italics.
Domain Numbers and Operations
Facility level Medium
¿Qué número representa el modelo? What number is represented by the model?
a) 12 b) 46 c) 48 d) 84
Domain Numbers and Operations
Facility level Hard
Pilar compró 21 naranjas y 16 manzanas. Pilar bought 21 oranges and 16 apples.
¿Qué ecuación muestra cuántas más naranjas que manzanas compró Pilar? What number sentence shows how many more oranges than apples bought Pilar?
13
Domain Numbers and Operations
Facility level Easy
¿Qué florero tiene una cantidad de flores mayor que este florero? Which flower vase has more flowers than this one?
A)
B)
C) )
14
Domain Patterns and Algebra
Facility level Medium
Elisa está completando esta recta numérica. ¿Qué número debe escribir en el recuadro? Elisa is filling in the number line. What number should she write in the box?
A) 56 B) 58 C) 59 D) 60
Domain Geometry and Measurement
Facility level Medium
¿Cuál es la medida más probable del alto de una botella de agua? What is the most likely height measure of a bottle of water?
a) 21 kilómetros (kilometers) b) 21 metros (meters)
c) 21 milímetros (milimeters) d) 21 centímetros (centimeters)
Domain Data and Probability
Facility level Medium
15
¿Cuántas veces más ha visitado Pablo el museo de ciencias que Víctor? How many more times has Pablo visited the museum than Victor?
A) 11 veces (times) B) 8 veces (times) C) 6 veces (times) D) 5 veces (times)
Domain Geometry and Measurement
Facility level Medium
¿Cuál de las siguientes figuras no es un triángulo? What igure is not a tringle?
A)
B)
C)