DEMOGRAPHIC RESEARCH
VOLUME 35, ARTICLE 44, PAGES 1303
−
1316
PUBLISHED 11 NOVEMBER 2016
http://www.demographic-research.org/Volumes/Vol35/44/ DOI: 10.4054/DemRes.2016.35.44
Descriptive Finding
A formal decomposition of declining youth crime
in Denmark
Lars H. Andersen
Anne Sofie Tegner Anker
Signe Hald Andersen
©2016 Andersen, Anker & Andersen.
This open-access work is published under the terms of the Creative Commons Attribution NonCommercial License 2.0 Germany, which permits use, reproduction & distribution in any medium for non-commercial purposes, provided the original author(s) and source are given credit.
2 Data and method 1304
2.1 Cohort analyses 1306
3 Results 1306
3.1 Results from cohort analyses 1310
4 Discussion 1311
A formal decomposition of declining youth crime in Denmark
Lars H. Andersen1Anne Sofie Tegner Anker2
Signe Hald Andersen3
Abstract
BACKGROUND
Over the recent decades and across most developed democracies, youth crime has been in steady decline, and declining youth crime now constitutes an important contemporary demographic change. Yet underneath this change lingers the question of how we should best grasp declining youth crime.
OBJECTIVE
To decompose declining youth crime in Denmark into its extensive and intensive margins, and show results from birth cohort analyses.
METHODS
We apply Das Gupta’s (1993) method for rate decomposition to Danish registry data that holds information on all criminal justice contacts of full birth cohorts. We show results among 15–17-year-old youth by year as well as follow birth cohorts by age.
RESULTS
The main driver of declining youth crime in Denmark is that fewer young people are experiencing contact with the criminal justice (extensive margin), and not lower rates of criminal recidivism among youth with criminal justice contact (intensive margin); a result which is found using both year and birth cohort analyses.
CONTRIBUTION
The knowledge provided in our descriptive findings ‒ that change at the extensive margin is the main driver of declining youth crime in Denmark ‒ represents a first
step towards understanding the important demographic change that youth crime has been in decline across developed democracies over the past decades.
1 Rockwool Foundation Research Unit, Solvgade 1;, 2, DK-1307 Copenhagen K, Denmark; (+45) 33 34
48 17. E-Mail: [email protected].
1. Introduction
The recent decline in youth crime is an important social and demographic change. In the US the arrest rate among 15–17-year-olds has dropped by 60% since its peak in the mid-1990s (own calculations from Snyder and Mulako-Wangota 2016). Other developed democracies, e.g., the UK, Denmark, and the Netherlands, have witnessed similar declines, although the timing varies across countries (Danish Ministry of Justice 2016; Statistics Netherlands 2014; Youth Justice Board 2015). This decline is important because it shows that society is becoming safer and that youth today devote themselves less to anti-social activities.
Yet, despite declining youth crime, little is known about the mechanisms driving the change. At the broadest level, change could come from two margins, the extensive or the intensive. The extensive margin measures the number of young people who offend. If fewer youth today are charged with a crime, it affects the extensive margin. The intensive margin measures the number of offenses among those who experience criminal justice contact. If offenders today recidivate less, it affects the intensive margin.
Therefore an important first step in understanding declining youth crime is to analyze whether changes at one or the other margin ‒ or both ‒ are the prime drivers of this trend. This is the aim of this descriptive finding, and we report both year-by-year and birth cohort estimates. Not only will such estimates improve our insight into today’s youth crime but they will also help policymakers and criminal justice stakeholders in their efforts to maintain or even further the current decline.
Only one existing study has pursued this research agenda. Berg, Baumer, Rosenfeld, and Loeber (2016) compare the extensive and intensive margins of crime among 17‒18-year-olds in the US in the early and late 1990s. They find that the property crime rate changed at both margins during that period. The rate of serious violent crimes changed only at the extensive margin among white youth but at both margins among black youth. However, declining youth crime outside the US is a more recent phenomenon, and it is unclear whether results from the US in the 1990s are applicable to other contexts today.
2. Data and method
of age is our lower bound, as this is the age of criminal responsibility in Denmark ‒
with a small exception between July 1st 2010 and March 1st 2012, when the limit
was 14 years. We use 17 years of age as our upper bound: 17-year-olds are minors in many aspects, including how they are treated in the criminal justice system (e.g., they are primarily sent to youth facilities).
Our crime rate measure derives from the register of charges, and covers all Penal Code violations. Of these, property and violent offenses constitute 80% and
15% of charges against 15‒17-year-olds respectively, theft, vandalism, and simple assault being the most common charges. Our focus on Penal Code violations means that we exclude, for example, charges for traffic offenses and minor drug offenses, but our results are robust to the inclusion of these charges. We use charges rather than convictions, as changes in convictions over time are more likely to reflect both changes in youth’s behavior and changes in system behavior (such as judges’ workload). Although also sensitive to system behavior such as policing efforts, charges are more likely to express the illegal action for which a person is apprehended.
To analyze whether declining youth crime occurs on the extensive or the intensive margin ‒ and thus to analyze how changes on each margin contribute to the overall development of youth crime ‒ we use Das Gupta’s (1993) method of rate decomposition. Equation 1 shows how the age- and year-specific charge rates, Rta,
reflect changes at the intensive and extensive margins. Here, Rta is measured as the
sum of charges during year t within each age group (a) per 1,000, and the rate is the product of the extensive (E, proportion of the population charged with a crime in year t) and intensive (I, average number of crimes that each charged individual is charged with in year t) margins:
𝑅𝑡𝑎=�# 𝑐ℎ𝑎𝑟𝑔𝑒𝑑# 𝑝𝑜𝑝𝑡𝑎𝑡𝑎∗# # 𝑐ℎ𝑎𝑟𝑔𝑒𝑑𝑐ℎ𝑎𝑟𝑔𝑒𝑠𝑡𝑎𝑡𝑎� ∗1000 = (𝐸𝑡𝑎∗ 𝐼𝑡𝑎)∗1000 (1)
Das Gupta’s decomposition method standardizes one margin to its mean value across the observed years and then allows only for changes on the other margin. Conducting this procedure for both margins provides the total decomposition. Specifically, changes at the extensive margin contribute to the overall change in charge rates from one year to the next by 𝜔𝐸=𝐼𝑡+12+𝐼𝑡(𝐸𝑡+1− 𝐸𝑡). Similarly,
changes at the intensive margin contribute by 𝜔𝐼=𝐸𝑡+12+𝐸𝑡(𝐼𝑡+1− 𝐼𝑡). We may
2.1 Cohort analyses
The panel structure of our data also allows for cohort analyses. Such analyses will show the persistence of low or high levels of criminality within cohorts across age
(here we use cohorts 1986‒1996), and will demonstrate whether lifetime charge rates have decreased across birth cohorts or whether more recent cohorts simply postpone their criminality into young adulthood. For this part of the analysis we measure the extensive margin of crime as the cumulative proportion of each cohort ever charged with a crime, by age. We measure the intensive margin as the cumulative mean number of charges, up to a specific age, among those who were charged with a crime.
3. Results
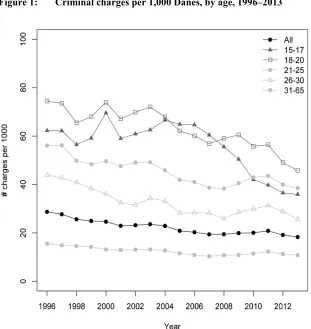
Figure 1: Criminal charges per 1,000 Danes, by age, 1996‒2013
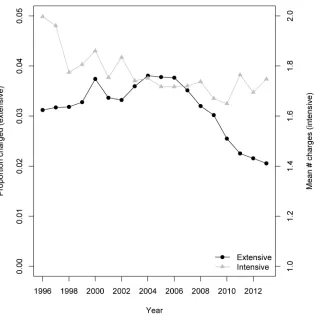
Figure 2 shows the calendar-year-specific charge rate among 15‒17-year-old youth by its extensive and intensive margins. According to these results, which correspond to findings published by the Danish Ministry of Justice (2016), changes at the extensive margin are the primary drivers of the decline in youth charges from 2004 onwards. Between 1996 and 2004 the share of youth who were charged at least once within a given year rose from 3.1% to 3.8%, but by 2013 this share had declined to 2.1%.
Figure 2: Criminal charges at the extensive and intensive margins, ages 15‒17, 1996‒2013
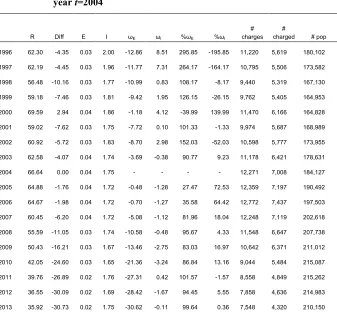
Table 1 shows that changes at the intensive margin drove changes in charge rates from 2004 to 2006 (the baseline year is 2004). However, this changed in
Table 1: Decomposition of charge rates among 15‒17-year-olds, baseline year t=2004
t R Diff E I ωE ωI %ωE %ωI
#
charges charged # # pop
1996 62.30 -4.35 0.03 2.00 -12.86 8.51 295.85 -195.85 11,220 5,619 180,102
1997 62.19 -4.45 0.03 1.96 -11.77 7.31 264.17 -164.17 10,795 5,506 173,582
1998 56.48 -10.16 0.03 1.77 -10.99 0.83 108.17 -8.17 9,440 5,319 167,130
1999 59.18 -7.46 0.03 1.81 -9.42 1.95 126.15 -26.15 9,762 5,405 164,953
2000 69.59 2.94 0.04 1.86 -1.18 4.12 -39.99 139.99 11,470 6,166 164,828
2001 59.02 -7.62 0.03 1.75 -7.72 0.10 101.33 -1.33 9,974 5,687 168,989
2002 60.92 -5.72 0.03 1.83 -8.70 2.98 152.03 -52.03 10,598 5,777 173,955
2003 62.58 -4.07 0.04 1.74 -3.69 -0.38 90.77 9.23 11,178 6,421 178,631
2004 66.64 0.00 0.04 1.75 - - - - 12,271 7,008 184,127
2005 64.88 -1.76 0.04 1.72 -0.48 -1.28 27.47 72.53 12,359 7,197 190,492
2006 64.67 -1.98 0.04 1.72 -0.70 -1.27 35.58 64.42 12,772 7,437 197,503
2007 60.45 -6.20 0.04 1.72 -5.08 -1.12 81.96 18.04 12,248 7,119 202,618
2008 55.59 -11.05 0.03 1.74 -10.58 -0.48 95.67 4.33 11,548 6,647 207,738
2009 50.43 -16.21 0.03 1.67 -13.46 -2.75 83.03 16.97 10,642 6,371 211,012
2010 42.05 -24.60 0.03 1.65 -21.36 -3.24 86.84 13.16 9,044 5,484 215,087
2011 39.76 -26.89 0.02 1.76 -27.31 0.42 101.57 -1.57 8,558 4,849 215,262
2012 36.55 -30.09 0.02 1.69 -28.42 -1.67 94.45 5.55 7,858 4,636 214,983
2013 35.92 -30.73 0.02 1.75 -30.62 -0.11 99.64 0.36 7,548 4,320 210,150
Note: t = year. R = charge rate (charges per 1,000 15-17-year-olds). Diff = difference in charge rate compared to 2004. E = extensive margin (proportion charged in year t). I = intensive margin (mean number of charges per charged person in year t).
ω = margin’s absolute contribution to the overall change in crime compared to 2004. %ω = margin’s percentage contribution to the overall change in crime compared to 2004. The table also shows the number of charges, the number of charged and the population size (for 15-17-year-olds) used to calculate charge rates and the intensive and extensive margins for each year.
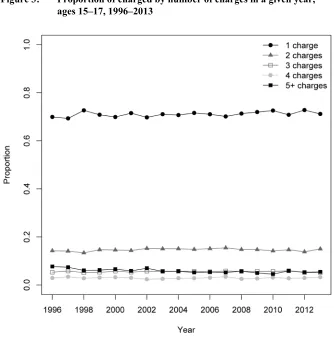
Figure 3: Proportion of charged by number of charges in a given year, ages 15‒17, 1996‒2013
3.1 Results from cohort analyses
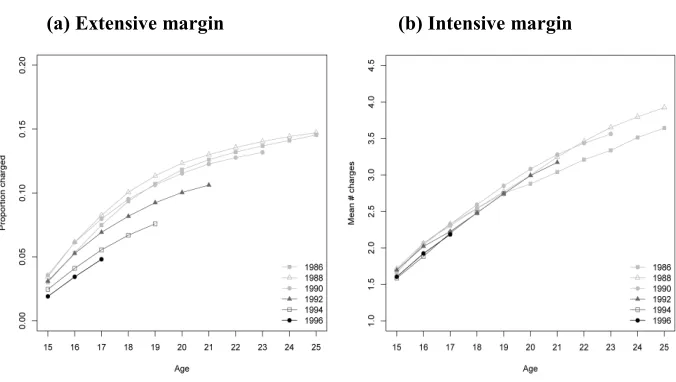
17 (4.8% in the 1996 cohort compared to 6.9% in the 1992 cohort), we may expect to see even lower charge rates in the coming years, when these cohorts move into young adulthood (a prediction that is also proposed in von Hofer 2014).
Panel b in Figure 4, however, shows that across the birth cohorts there is little evidence of changes at the intensive margin. While fewer youth experience criminal justice contact, recidivism among those who do mirrors recidivism among earlier cohorts. At age 17 the mean number of charges is between 2.2 and 2.3 for all birth cohorts, and even at age 21 the cohorts have similar recidivism rates.
Figure 4: Cumulative proportion charged and number of charges, by age and birth cohort
(a) Extensive margin (b) Intensive margin
4. Discussion
may also expect these cohorts to have lower overall levels of crime in early adulthood.
But while our findings provide one answer to the puzzle of declining crime rates, we are still far from fully understanding this trend. In the literature there are multiple untested hypotheses putting forward possible explanations. Farrell, Tilley, and Tseloni (2014) consider 17 hypotheses mentioned in the literature. The authors assess the relevance of each hypothesis using four criteria: cross-national applicability, applicability to previous increases in crime, applicability to increases in ‘e-crimes’ and phone theft, and applicability to the timing of the crime decline across contexts. Only one hypothesis meets all criteria. This is the security hypothesis describing how changes in the quantity and quality of security impact crime rates. By increasing perceived apprehension risks (e.g., because of increased surveillance) and refining security measures to increase the effort it takes to surpass security measures (e.g., bypassing active anti-theft mechanisms in cars requires skill and time), committing certain types of offenses has simply become more cumbersome (Farrell, Tilley, and Tseloni 2014). However, increased security is insufficient to explain our findings, as it would affect both first time offenses and recidivism, and thus both margins.
In fact, broad explanations of general changes in the crime rate might not sufficiently address the nature of the current trends in youth crime, where we observe a simultaneous de-normalization of crime and stable recidivism. Instead we should turn to separate explanations.
Here, the question of stable recidivism rates seems the most straightforward. Our results indicate that the consequence of committing a first crime are unaltered and start the offender on a negative spiral with the same slope today as it had years ago. Similarly, current efforts aimed at reintegrating offenders and avoiding criminal recidivism are fruitless, either because these efforts are insufficient or because the barriers to reintegration are too high. To test this possible explanation, future studies should compare criminal pathways today with criminal pathways a decade or more ago.
The question of the lowered share of first-time offenders is less straightforward. For example, Kim, Bushway, and Tsao (2016) find that neither penal policies nor policing strategies explain changes in US arrest rates between 1990 and 2010. Rather, the changes are best explained by differences across birth cohorts. However, the same conclusion is rejected in a Swedish study (Bäckman et al. 2014), where cohort differences in the composition of offenses have more explanatory power. To further complicate matters, another Swedish study analyzes 34 birth cohorts and finds that only males experience changes in conviction rates (von Hofer 2014) and that female rates are stable.
parallel trends observed in crime rates across developed democracies. In fact, the rates of some types of crime, such as homicide, have shown parallel trends since the late Middle Ages (Tonry 2014), at least in English-speaking countries. The parallel trends across developed democracies may be the key to answering the question of declining youth crime.
Common cultural changes, such as increased accessibility to and use of electronic devices such as smartphones and tablets, may have prevented young people from committing their first crime, by simple incapacitation (Cunningham, Engelstätter, and Ward 2011). Changes in how certain types of behavior are diagnosed and treated may also affect the extensive margin of youth crime. For example, Lichtenstein et al. (2012) found lower conviction rates among people with ADHD symptoms during medication periods than during periods without medication. The increasing use of medication to reduce symptoms of ADHD has also impacted Danish children’s risk of foster care placement (Fallesen and Wildeman 2015). Future studies should further examine these explanations and, if possible, provide causal evidence of how they affect the likelihood of first-time offending.
References
Berg, M.T., Baumer, E., Rosenfeld, R., and Loeber, R. (2016). Dissecting the prevalence and incidence of offending during the crime drop of the 1990s. Journal of Quantitative Criminology 32(3): 377–396. doi:10.1007/s10940-016-9289-6.
Bäckman, O., Estrada, F., Nilsson, A., and Shannon, D. (2014). The life course of young male and female offenders stability or change between different birth cohorts? British Journal of Criminology 54(3): 393–410. doi:10.1093/bjc/ azu007.
Cunningham, A.S., Engelstätter, B., and Ward, M.R. (2011). Understanding the effects of violent video games on violent crime. ZEW Discussion Papers 11‒
042.doi:10.2139/ssrn.1886419.
Danish Ministry of Justice (2016). Udviklingen i børne- og ungdomskriminalitet 2006‒2015. Copenhagen: Danish Ministry of Justice Research Unit.
Das Gupta, P. (1993). Standardization and decomposition of rates: A user’s manual (Current Population Reports No. P23-186). Washington, D.C.: U.S. Bureau of the Census. Retrieved from https://www.census.gov/popest/research/p23-186.pdf
D’Unger, A.V., Land, K.C., McCall, P.L., and Nagin, D.S. (1998). How many latent classes of delinquent/criminal careers? Results from mixed Poisson regression analyses 1. American Journal of Sociology 103(6): 1593–1630.
doi:10.1086/231402.
Fallesen, P. and Wildeman, C. (2015). The effect of medical treatment of Attention Deficit Hyperactivity Disorder (ADHD) on foster care caseloads evidence from Danish registry data. Journal of Health and Social Behavior 56(3): 398–414. doi:10.1177/0022146515595046.
Farrell, G., Tilley, N., and Tseloni, A. (2014). Why the crime drop? Crime and Justice 43(1): 421–490. doi:10.1086/678081.
Kim, J., Bushway, S., and Tsao, H.-S. (2016). Identifying classes of explanations for crime drop: Period and cohort effects for New York State. Journal of Quantitative Criminology 32(3): 357–375. doi:10.1007/s10940-015-9274-5. Li, J. and Kinfu, Y. (2015). rdecompose: Outcome decomposition for aggregate
Lichtenstein, P., Halldner, L., Zetterqvist, J., Sjölander, A., Serlachius, E., Fazel, S., Långström, N., and Larsson, H. (2012). Medication for Attention Deficit– Hyperactivity Disorder and criminality. New England Journal of Medicine 367(21): 2006–2014. doi:10.1056/NEJMoa1203241.
Nagin, D.S. and Land, K.C. (1993). Age, criminal careers, and population heterogeneity: Specification and estimation of a nonparametric, mixed Poisson model. Criminology 31(3): 327–362. doi:10.1111/j.1745-9125.1993. tb01133.x.
Snyder, H. and Mulako-Wangota, J. (2016). Arrest Data Analysis Tool. Bureau of Justice Statistics, Washington, D.C. www.bjs.gov [accessed March 7, 2016]. Statistics Netherlands (2014). Fewer young crime suspects. Web Magazine.
Statistics Netherlands, Den Haag, the Netherlands. www.cs.nl [accessed May 13, 2014].
Tonry, M. (2014). Why crime rates are falling throughout the Western world. Crime and Justice 43(1): 1–63. doi:10.1086/678181.
von Hofer, H. (2014). Crime and reactions to crime in 34 Swedish birth cohorts: From historical descriptions to forecasting the future. Journal of Scandinavian Studies in Criminology and Crime Prevention 15(2): 167–181.
doi:10.1080/14043858.2014.918298.