DEMOGRAPHIC RESEARCH
VOLUME 34, ARTICLE 4, PAGES 109
−
142
PUBLISHED 19 JANUARY 2016
http://www.demographic-research.org/Volumes/Vol34/4/ DOI: 10.4054/DemRes.2016.34.4
Research Article
Racial and ethnic differences in leaving and
returning to the parental home: The role of life
course transitions, socioeconomic resources, and
family connectivity
Lei Lei
Scott J. South
© 2016 Lei Lei & Scott J. South.
This open-access work is published under the terms of the Creative Commons Attribution NonCommercial License 2.0 Germany, which permits use, reproduction & distribution in any medium for non-commercial purposes, provided the original author(s) and source are given credit.
1 Introduction 110
2 Theoretical framework 111
2.1 Life course transitions: School and work 112
2.2 Life course transitions: Cohabiting relationship and parenthood 113
2.3 Socioeconomic resources and parental assistance 115
2.4 Family connectivity and support needs 116
3 Data and methods 117
3.1 Data 117
3.2 Measures 118
3.3 Analytic strategy 123
4 Results 124
4.1 Descriptive statistics 124
4.2 Explaining racial and ethnic differences in leaving home 125 4.3 Explaining racial and ethnic differences in returning home 129
5 Discussion and conclusion 133
Racial and ethnic differences in leaving
and returning to the parental home: The role of life course
transitions, socioeconomic resources, and family connectivity
Lei Lei1 Scott J. South2
Abstract
BACKGROUND
Although Black and Hispanic young adults in the U.S. are less likely than Whites to move out of the parental home and more likely than Whites to return, reasons for these differences have not been clearly identified.
OBJECTIVE
This study examines the ability of racial/ethnic disparities in life course transitions, socioeconomic resources, and family connectivity to account for racial/ethnic differences in leaving and returning home.
METHODS
Using data from the 2005–2011 waves of the Panel Study of Income Dynamics’ Transition into Adulthood study (N=1,491, age 18 to 26), we estimated discrete-time event history models predicting the timing of moving out of and back into the parental home.
RESULTS
Although no single factor completely explained racial-ethnic differences in the timing of leaving and returning to the parental home, the bulk of the Black-White differences in both home-leaving and home-returning was explained by group differences in transitions into adult roles, the ability to afford independent living, and connections to the origin family. These factors also explained most of the Mexican-White difference in home-leaving. However, only a small portion of the Hispanic-White difference in returning home was attributable to the proposed explanatory variables.
CONCLUSION
Explanations for racial and ethnic differences in the timing of leaving and returning to the parental home need to consider a broad array of life course characteristics in which
Black, Hispanic, and White youth differ. The factors that explain Black-White differences in home-leaving and home-returning may differ from those that explain Hispanic-White differences in these behaviors.
1. Introduction
Over the last half-century, social, economic, and cultural changes have made the transition to adulthood more dynamic, complex, and diversified in western countries (Cordón 1997; Mitchell 2007; Settersten and Ray 2010). In addition to extended post-secondary education and delayed marriage and childbearing, there has been a steady increase in the share of young adults living in the parental home (Furstenberg 2010; Payne 2012b; Stone, Berrington, and Falkingham 2011). In the U.S., the percentage of young adults ages 18−31 living in the parental home remained largely unchanged from 1981 (31%) to 2007 (32%), but then increased to 36% in 2012 (Fry 2013). Not only are U.S. young adults leaving home at an older age, but almost half of them return home after living independently (Goldscheider and Goldscheider 1999). This appears to be a much higher rate of home-returning than in Canada and some European countries, including Britain, Germany, and Sweden (Mitchell 2007). This prolonged dependence on parents is likely attributable to the declining job prospects for young adults, an increasing demand for higher education, and the rising cost of living (Newman 2012). In addition, family values among some racial-ethnic and immigrant groups may encourage coresidence with parents (Waters et al. 2011).
In the U.S., transitions out of the parental home are marked by considerable diversity across racial and ethnic groups. At least among young men, levels of co-residence with parents vary substantially by racial-ethnic background. In 2011, 31% of young Black men aged 25–34 lived in the parental home, compared with 21% of young Latino men and only 15% of White men. Differences between young Black women (11%), Latino women (11%), and White women (9%) are substantially smaller (Mather 2011). Prior research found that Black and Hispanic young adults leave home at an older age than their non-Hispanic White peers (Goldscheider, Hofferth, and Curtin 2014; Mulder and Clark 2000) and are more likely to return after living away from home (Da Vanzo and Goldscheider 1990; South and Lei 2015).
coresidence is explained by compositional differences in nativity or recency of arrival to the U.S. Treas and Batalova (2011) eliminated the Black-White gap in parental coresidence by adjusting for young adults’ social roles (e.g., spouse, parent, student, or worker) and economic resources, but were unable to explain completely the Hispanic-White difference. Britton (2013) found that higher rates of coresidence among minorities are not attributable to subcultural differences in attitudes toward family and marriage, but are partially explained by group differences in socioeconomic attainment and marital status.
One limitation of most prior studies of this issue is that they have used cross-sectional data: these studies are thus incapable of identifying the events in young adults’ life course that might precipitate either home-leaving or home-returning (Treas and Batalova 2011; Britton 2013). Moreover, prior research has paid little attention to other possible explanations for racial and ethnic differences in parental coresidence, particularly characteristics of the parental household and the emotional connectivity between adult children and their origin family. This study goes beyond most prior studies 1) by using longitudinal data to measure actual residential moves rather than static patterns of parental coresidence; 2) by considering both moves out of and back into the parental home; 3) by comparing the timing of moves among non-Hispanic Whites, non-Hispanic Blacks, and Hispanics in parallel fashion; and 4) by testing a wider variety of potential explanations for the racial and ethnic gaps in the timing of leaving and returning home.
2. Theoretical framework
independent household (Mitchell 2003). The principle of linked lives emphasizes that the timing of life transitions is influenced by the characteristics of, and life events occurring to, other member of a social network, particularly family members (Elder, Johnson, and Crosnoe 2003). This life course tenet directs attention to the role of family social capital in shaping the timing of both leaving and returning to the parental home. Following the life course principle of agency, we view the delayed leaving and accelerated returning to the parental home as strategic choices made by young adults operating under social influences and constraints (Elder, Johnson, and Crosnoe 2003; Marshall 2005). Young adults from different racial and ethnic backgrounds may have different structural opportunities in schooling and working, unequal access to economic resources, and distinct cultural norms regarding family relationships, all of which provide potential explanations for racial and ethnic differences in the timing of leaving and returning home.
2.1 Life course transitions: School and work
The life course perspective emphasizes the co-occurrence of key events in individuals’ lives (Elder, Johnson, and Crosnoe 2003). Indeed, moves out of and, to a lesser extent, back into the parental home have been viewed as consequences of concurrent, normative transitions in the young adult life course. Transitions from high school to college and from school to work tend to trigger young adults’ decision to leave the parental home. Enrolling in college and finding a job often require geographical relocation in order for young adults to live close to school or the place of employment (Zorlu and Mulder 2011). Similarly, returns to the parental home are often driven by changes in young adults’ schooling and labor market activities. Moving back to the parental home is often a result of an unsuccessful role transition, such as losing a job or failing to find a job after graduating from college (Kaplan 2009; Stone, Berrington, and Falkingham 2014). By returning home, adult children reduce their housing costs, share resources with parents, and exploit economies of scale (Goldscheider et al. 1999).
(23.9%) and Hispanics (22.5%) (NCES 2013b). Among young adults ages 25 to 34 who hold a Bachelor’s degree, 96% of Whites and 94.2% of Hispanics are employed, compared to only 90% of Blacks (NCES 2013c).
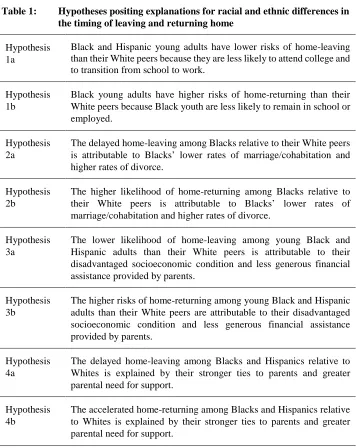
We hypothesized that the delayed home-leaving among Black and Hispanic youth compared with their White peers is potentially attributable to their lower propensity to transition from high school to college and their lower rates of employment after completing high school (Hypothesis 1a). Likewise, the lower employment rates for Black college graduates than for their White and Hispanic counterparts might help account for the racial difference in young adults’ propensity to return to the parental home (Hypothesis 1b). Table 1 summarizes these and the other hypotheses that guide our analysis.
2.2 Life course transitions: Cohabiting relationships and parenthood
Table 1: Hypotheses positing explanations for racial and ethnic differences in the timing of leaving and returning home
Hypothesis 1a
Black and Hispanic young adults have lower risks of home-leaving than their White peers because they are less likely to attend college and to transition from school to work.
Hypothesis 1b
Black young adults have higher risks of home-returning than their White peers because Black youth are less likely to remain in school or employed.
Hypothesis 2a
The delayed home-leaving among Blacks relative to their White peers is attributable to Blacks’ lower rates of marriage/cohabitation and higher rates of divorce.
Hypothesis 2b
The higher likelihood of home-returning among Blacks relative to their White peers is attributable to Blacks’ lower rates of marriage/cohabitation and higher rates of divorce.
Hypothesis 3a
The lower likelihood of home-leaving among young Black and Hispanic adults than their White peers is attributable to their disadvantaged socioeconomic condition and less generous financial assistance provided by parents.
Hypothesis 3b
The higher risks of home-returning among young Black and Hispanic adults than their White peers are attributable to their disadvantaged socioeconomic condition and less generous financial assistance provided by parents.
Hypothesis 4a
The delayed home-leaving among Blacks and Hispanics relative to Whites is explained by their stronger ties to parents and greater parental need for support.
Hypothesis 4b
The lower marriage rates and higher divorce rates among Blacks than among Whites and Hispanics are potentially important reasons for the delayed launch of young Black adults and their greater tendency to return to the parental home. Although racial-ethnic differences in attitudes toward marriage and family do not appear to explain higher rates of coresidence among non-Whites than among Whites, some of the difference in parental coresidence is attributable to racial differences in young adults’ marital status (Britton 2013). We hypothesized that racial-ethnic differences in the likelihood of making relationship transitions can account for some of the difference between Blacks and Whites, and to a lesser extent differences between Hispanics and non-Hispanic Whites, in the likelihood of moving out of (Hypothesis 2a) and moving back into the parental home (Hypothesis 2b).
2.3 Socioeconomic resources and parental assistance
Some of the ethnoracial variability in the timing of leaving and returning home likely stems from differential access to socioeconomic resources. Young adults with stable employment and sufficient income are able to afford routine expenses such as rent and food, which allows youth to establish and maintain an independent household (Goldscheider 1997; Goldscheider and Goldscheider 1994). Earlier research found that young adults with higher income are more likely to move out of the parental home (Mulder and Clark 2000) and less likely to move back (Kaplan 2009). Racial and ethnic differences in economic attainment during young adulthood are well known. Young Blacks and Hispanics are disadvantaged in the labor market due to both discrimination and different qualifications (Alon and Haberfeld 2007; Cancio, Evans, and Maume Jr. 1996). Early career wages are substantially lower for Black and Hispanic young workers than for their White counterparts (Bureau of Labor Statistics 2014). Therefore, racial disparity in young adults’ earnings could account for the delayed home-leaving and higher risk of home-returning among young Black and Hispanic adults relative to Whites.
educational and professional status tend to have a greater need for privacy and lower demand for the companionship of adult children (Avery, Goldscheider, and Speare 1992). In general then, adult children of high SES parents are expected to leave home sooner and be less likely to return after living independently.
White, Black, and Hispanic youth differ in the economic capability of their parents and the amount of parent-to-child financial transfer. White households have substantially more transferable resources, including income, than Black and Hispanic households (DeNavas-Walt, Proctor, and Smith 2013). Given their socioeconomic advantages, White parents are more capable than Black parents of providing financial assistance to their grown children (Rosenzweig and Wolpin 1993). Thus, we hypothesized that the privileged socioeconomic background of, and the more generous financial assistance provided by, the parents of White young adults can explain the greater likelihood of home-leaving (Hypothesis 3a) and lower likelihood of home-returning (Hypothesis 3b) among young White adults than among their Black and Hispanic peers.
2.4 Family connectivity and support needs
Yet another potential explanation for racial-ethnic differences in leaving and returning home is that Black and Hispanic families display distinctive cultural practices and preferences that encourage parent-child coresidence. Under the influence of West African cultural traditions, Blacks ostensibly place great value on mother/child relationships, communal childrearing, and extended kin ties (Collins 1999; Sarkisian and Gerstel 2004). Black youth tend to have stronger affective ties to their mothers than non-Black youth (Lawton, Silverstein, and Bengtson 1994). African American extended families could provide economic sustenance and social and emotional support to their members. Prior research has showed that Blacks are more likely than Whites to take in related children and to “double up” (Hill 2003), and that young Black mothers are especially likely to live with adult kin (Hogan, Hao, and Parish 1990). Somewhat similarly, it has also been argued that Hispanic culture is characterized by familism − a collective value orientation that emphasizes family roles and responsibilities over individual desires and that prizes the relationship between adult children and their parents (Landale and Oropesa 2007). In a recent study, 12.6% of young Hispanic adults thought it important to live close to parents, but only 6.7% of Black and 7.6% of White young adults reported the same attitude (Britton 2013). Hispanics are also more likely than non-Hispanic Whites to live in extended-family households (Kamo 2000; Sarkisian, Gerena, and Gerstel 2007), with non-nuclear members contributing to the livelihood of the family.
more changes in the process of assimilation (Foner 1997). Young adult children of immigrant families are more likely than children of native-born families to live with their parents (Rumbaut and Komaie 2010). Accordingly, the higher percentage of immigrant families among Hispanics, especially Mexicans, than among non-Hispanic Whites and other groups could partially explain Hispanic−White differences in the timing of leaving and returning home.
According to the principle of ‘linked lives’, individual life course experiences are connected through the family and its network. Characteristics of other family members and the strength of family ties could affect the timing of life course events among young adults. Having siblings in the parental home, which likely serves as an indicator of a familistic culture, tends to postpone young adults’ departure from the parental home to live alone or with a partner (Zorlu and Mulder 2011). In addition, the social capital embodied in family relations is crucial for children’s access to other types of resources within the family (Coleman 1988; Mitchell 2007). Adult children might only enjoy living in the parental home if they also enjoy an emotionally satisfying relationship with their parents. Young adults who have strong emotional ties with parents are less motivated to move out of the parental home (Blaauboer and Mulder 2010) and are more likely to return (Mitchell, Wister, and Gee 2004). Racial and ethnic differences in the presence of adult siblings and the quality of the youth-parent relationships could potentially account for the delayed home-leaving and accelerated home-returning among young Black and Hispanic adults compared to Whites.
Racial-ethnic differences in the likelihood of moving out of and back into the parental home might also be explained by group differences in parents’ need for social and instrumental support. Coresidence with parents is more likely when parents have greater needs for support from their children (Smits et al. 2010). For example, parents’ health problems generate greater needs for the presence of caregivers in the household (Choi 2003) and could therefore encourage an adult child to move back to the parental home (Smits et al. 2010). We hypothesized that stronger ties to parents and greater parental needs for support in Black and Hispanic families than in White families can potentially explain the delayed launch of young Black and Hispanic adults (Hypothesis 4a) and their increased risks of home-returning (Hypothesis 4b).
3. Data and methods
3.1 Data
and whose families were still participating in the main PSID. Interviews were conducted in 2005, 2007, 2009, and 2011. At each wave the PSID-TA collected information on respondents’ living arrangements, education and school attendance, employment and income, marital and cohabitation status, childbearing, performance of various responsibilities, relationship with and help received from parents, physical and mental health, and other topics. Our study used data from the 2005 to 2011 waves of the PSID-TA, when respondents were between the ages of 18 and 26. The response rates for the four waves (among those eligible to be interviewed) ranged between 88.8% and 92%, and the average two-year attrition rate was 11%. Because the measurement of the dependent variables required data from successive interviews to form a migration interval, we included only respondents who were interviewed in at least two consecutive waves. After we excluded the thirty respondents of other races (because they are too few in number to sustain a separate analysis), our sample consisted of 1,491 PSID-TA respondents. Of these, 47% were non-Hispanic White, 41% were non-Hispanic Black, 6% were Mexican-origin, and 6% were other Hispanic. Among other Hispanics, 20% were Puerto Rican, 33% were Cuban, and 47% had other Spanish origins. About half (53%) the sample was female and the mean age was 20 years old.
3.2 Measures
The two dependent variables for our analysis were binary indicators capturing whether the respondent moved out of or back into the parental home between successive interviews, among those at-risk of experiencing each event. At each wave of PSID-TA interviews, respondents were asked about the place where they lived most of the time during the previous fall and winter (August through April); the response categories included parents’ home (house or apartment), apartment or house that the respondent (or the respondent’s parents) rented or owned, and college dormitory, sorority, or fraternity. We divided place of residence into two categories: parents’ home versus all other arrangements, which we refer to collectively as “living independently”. The indicator of moving out of the parental home was coded 1 if a respondent’s place of residence changed from ‘parental home’ to ‘independent living’ between successive interviews. A move back to the parental home was coded 1 if the place of residence changed in the opposite direction.
many other studies in this tradition have done (e.g., Goldscheider and Goldscheider 1997; Goldscheider et al. 2014; Zorlu and Mulder 2011). We note that because the PSID-TA does not interview young adults who are incarcerated or in a detention center, we are not able to consider instances of incarceration as moving out of the parental home or to count the return of previously incarcerated respondents as returning home. We also acknowledge that the use of a two-year mobility interval will miss short-term moves that occur and reverse entirely between interviews. The effect of a given covariate could be underestimated if it most strongly affects short-term moves. However, sensitivity checks using a one-year migration interval derived from parental reports in the main PSID of the time that their child left or returned home yielded generally similar findings to those using the two-year migration window. Thus, our results do not seem to suffer appreciable bias from using a two-year migration interval.
The main explanatory variables included race and ethnicity, the occurrence of critical life course transitions, access to socioeconomic resources, multiple dimensions of family connectivity, and support needs. Most of these measures were taken from young adults’ interviews in the PSID-TA study, but some came from their parents’ responses to the main PSID interviews. Time-varying explanatory variables measured respondents’ or parental characteristics at the beginning of each biennial migration interval, with the exception of the two life course transition variables that captured changes of status over this period. Table 2 lists all variables used in the analysis.
To measure respondents’ race and ethnicity, we contrasted non-Hispanic Whites, non-Hispanic Blacks, Mexicans, and other Hispanic respondents. We adopt a ‘subjective’ measure of race and ethnicity based on respondents’ self-identification in the PSID-TA interviews. Using the answers to the question of whether a respondent has Spanish, Hispanic, or Latino background, we divide the respondents into three groups: non-Hispanics, Mexicans (including Mexican Americans) and other Hispanics. Non-Hispanic respondents are further divided into Non-Hispanic Whites and Non-Hispanic Blacks according to their self-reported race. Ideally, we would have further differentiated the “other Hispanic” group by national origin (e.g., Puerto Rican, Cuban, etc.), but the size of the PSID-TA sample does not allow for such detailed categories. In some models we distinguished between children from immigrant families and children from native-born families among the Mexican and other Hispanic respondents. (The sample includes too few children from immigrant Black and White families to make this distinction among these groups3.) A respondent was deemed to be a member of an immigrant family if either the respondent was from the 1997 PSID immigrant refresher sample or if the head of the parental household grew up in a foreign country.
3 We included 17 foreign-born Whites and 16 foreign-born Blacks in the non-Hispanic White and
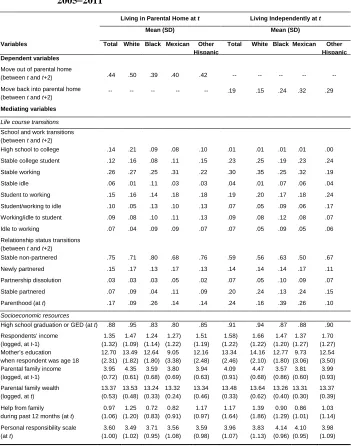
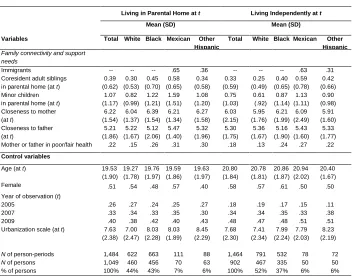
Table 2: Descriptive statistics for dependent and independent variables by residence at origin and race: Transition into adulthood study, 2005−2011
Living in Parental Home at t Living Independently at t
Mean (SD) Mean (SD)
Variables Total White Black Mexican Other
Hispanic
Total White Black Mexican Other
Hispanic Dependent variables
Move out of parental home
(between t and t+2) .44 .50 .39 .40 .42 -- -- -- -- -- Move back into parental home
(between t and t+2)
-- -- -- -- -- .19 .15 .24 .32 .29
Mediating variables
Life course transitions
School and work transitions (between t and t+2)
High school to college .14 .21 .09 .08 .10 .01 .01 .01 .01 .00
Stable college student .12 .16 .08 .11 .15 .23 .25 .19 .23 .24
Stable working .26 .27 .25 .31 .22 .30 .35 .25 .32 .19
Stable idle .06 .01 .11 .03 .03 .04 .01 .07 .06 .04
Student to working .15 .16 .14 .18 .18 .19 .20 .17 .18 .24
Student/working to idle .10 .05 .13 .10 .13 .07 .05 .09 .06 .17
Working/idle to student .09 .08 .10 .11 .13 .09 .08 .12 .08 .07
Idle to working .07 .04 .09 .09 .07 .07 .05 .09 .05 .06
Relationship status transitions (between t and t+2)
Stable non-partnered .75 .71 .80 .68 .76 .59 .56 .63 .50 .67
Newly partnered .15 .17 .13 .17 .13 .14 .14 .14 .17 .11
Partnership dissolution .03 .03 .03 .05 .02 .07 .05 .10 .09 .07
Stable partnered .07 .09 .04 .11 .09 .20 .24 .13 .24 .15
Parenthood (at t) .17 .09 .26 .14 .14 .24 .16 .39 .26 .10
Socioeconomic resources
High school graduation or GED (at t) .88 .95 .83 .80 .85 .91 .94 .87 .88 .90 Respondents’ income
(logged, at t-1)
1.35 (1.32) 1.47 (1.09) 1.24 (1.14) 1.27) (1.22) 1.51 (1.19) 1.58) (1.22) 1.66 (1.22) 1.47 (1.20) 1.37 (1.27) 1.70 (1.27) Mother’s education
when respondent was age 18
12.70 (2.31) 13.49 (1.82) 12.64 (1.80) 9.05 (3.38) 12.16 (2.48) 13.34 (2.46) 14.16 (2.10) 12.77 (1.80) 9.73 (3.06) 12.54 (3.50) Parental family income
(logged, at t-1)
3.95 (0.72) 4.35 (0.61) 3.59 (0.68) 3.80 (0.69) 3.94 (0.63) 4.09 (0.91) 4.47 (0.68) 3.57 (0.86) 3.81 (0.60) 3.99 (0.93)
Parental family wealth (logged, at t)
13.37 (0.53) 13.53 (0.48) 13.24 (0.33) 13.32 (0.24) 13.34 (0.46) 13.48 (0.33) 13.64 (0.62) 13.26 (0.40) 13.31 (0.30) 13.37 (0.39)
Help from family during past 12 months (at t)
0.97 (1.06) 1.25 (1.20) 0.72 (0.83) 0.82 (0.91) 1.17 (0.97) 1.17 (1.64) 1.39 (1.86) 0.90 (1.29) 0.86 (1.01) 1.03 (1.14)
Personal responsibility scale (at t)
Table 2: (Continued)
Living in Parental Home at t Living Independently at t
Mean (SD) Mean (SD)
Variables Total White Black Mexican Other
Hispanic
Total White Black Mexican Other
Hispanic
Family connectivity and support needs
Immigrants -- -- -- .65 .36 -- -- -- .63 .31
Coresident adult siblings in parental home (at t)
0.39 (0.62) 0.30 (0.53) 0.45 (0.70) 0.58 (0.65) 0.34 (0.58) 0.33 (0.59) 0.25 (0.49) 0.40 (0.65) 0.59 (0.78) 0.42 (0.66) Minor children
in parental home (at t)
1.07 (1.17) 0.82 (0.99) 1.22 (1.21) 1.59 (1.51) 1.08 (1.20) 0.75 (1.03) 0.61 (.92) 0.87 (1.14) 1.13 (1.11) 0.90 (0.98) Closeness to mother
(at t)
6.22 (1.54) 6.04 (1.37) 6.39 (1.54) 6.21 (1.34) 6.27 (1.58) 6.03 (2.15) 5.95 (1.76) 6.21 (1.99) 6.09 (2.49) 5.91 (1.60) Closeness to father
(at t)
5.21 (1.86) 5.22 (1.67) 5.12 (2.06) 5.47 (1.40) 5.32 (1.96) 5.30 (1.75) 5.36 (1.67) 5.16 (1.90) 5.43 (1.60) 5.33 (1.77) Mother or father in poor/fair health .22 .15 .26 .31 .30 .18 .13 .24 .27 .22
Control variables
Age (at t) 19.53
(1.90) 19.27 (1.78) 19.76 (1.97) 19.59 (1.86) 19.63 (1.97) 20.80 (1.84) 20.78 (1.81) 20.86 (1.87) 20.94 (2.02) 20.40 (1.67)
Female .51 .54 .48 .57 .40 .58 .57 .61 .50 .50
Year of observation (t)
2005 .26 .27 .24 .25 .27 .18 .19 .17 .15 .11
2007 .33 .34 .33 .35 .30 .34 .34 .35 .33 .38
2009 .40 .38 .42 .40 .43 .48 .47 .48 .51 .51
Urbanization scale (at t) 7.63 (2.38) 7.00 (2.47) 8.03 (2.28) 8.03 (1.89) 8.45 (2.29) 7.68 (2.30) 7.41 (2.34) 7.99 (2.24) 7.79 (2.03) 8.23 (2.19)
N of person-periods 1,484 622 663 111 88 1,464 791 532 78 72
N of persons 1,049 460 456 70 63 902 467 335 50 50
% of persons 100% 44% 43% 7% 6% 100% 52% 37% 6% 6%
Note:t refers to beginning of migration interval, t+2 refers to end of migration interval. Standard deviations (SD) shown for continuous variables only.
In a similar vein, we measured critical relationship transitions by a set of dummy variables indicating whether respondents formed, dissolved, or remained in a marital or cohabiting union between the beginning and the end of each migration interval. For the moving out models, respondents who remained non-partnered (neither married nor cohabiting) over the interval were contrasted with those who initiated a partnership, dissolved a partnership, or remained partnered. In the models of moving back, remaining in stable partnership was used as the reference category, which allows us to show the effect of partnership dissolution on home-returning. A separate dummy variable was included to measure whether the respondent or the respondent’s partner has had a child or is pregnant at the beginning of each migration interval.
Access to socioeconomic resources was measured by multiple indicators of respondents’ socioeconomic attainment, parental SES, and financial assistance from parents. Respondents’ income refers to earnings from work received in the calendar year prior to the interview, measured in thousands of constant 2004 dollars. Respondents’ income and family income (see below) were logged to reduce skewness. A time-varying dummy variable indicating whether the respondent completed high school (or received a GED) was also included as a predictor.
Measures of the characteristics of the parents and parental household were taken from the parents’ interviews in the main PSID. Parental educational attainment was measured by the years of school completed by the PSID-TA respondent’s mother when the respondent was 18 years old. Parental family income, a time-varying measure, included all sources of income in the year prior to the migration interval and was also measured in thousands of constant 2004 dollars (logged). Parental family wealth was the logged value of the sum of seven asset types (farm and business, money savings, real estate, stock, vehicles, other savings and assets, and retirement accounts), net of debts, measured at the beginning of each migration interval. Two time-varying variables derived from the PSID-TA interviews were used to measure the amount of financial resources respondents received from the origin family. Help received from family was measured by the number of the following five types of financial assistance received from parents or other relatives during the year prior to the interview: purchasing a house, paying rent or mortgage, buying a car, paying tuition, and covering expenses or bills. The extent of respondents’ personal responsibility for their own financial well-being was measured by the mean value of the following four items, each of which is rated on a five-point scale (1 = somebody else does this for me all the time, 5 = I am completely responsible for this all the time): earning your own living, paying rent or mortgage, paying bills, and managing your money.
parents was measured by items asking, separately, how close they feel to their mother (or step-mother) and to their father (or step-father), with values ranging from 1 (= not close at all) to 7 (= very close). Respondents’ parents’ health, a time-varying covariate reflecting parental need for support, was measured by a dummy variable derived from a question in the main PSID and contrasted origin families in which either the household head or her/his spouse were reported to be in poor or fair health with families in which both heads and spouses were in good, very good, or excellent health.
We controlled for respondent’s age and gender and for the temporal and geographical context. Age, which for most young adults indicates the length of time before moving out of the parental home, was measured by a set of dummy variables, contrasting each year of age with respondents age 17 or 18. Gender was coded 1 for females. To capture time trends in leaving and returning home, we included indicators for the two-year migration intervals beginning in 2007 and 2009, with the interval beginning in 2005 serving the reference. Geographic context was measured by the 10-point Beale-Ross rural-urban classification of counties (1 = completely rural, not adjacent to a metropolitan area; 10 = central counties of metropolitan areas of 1 million or more population) and treated as a time-varying covariate, measured at each PSID-TA wave.
3.3 Analytic strategy
Following most prior research in this area (e.g., Goldscheider and Goldscheider 1999), we used event history regression models to examine the associations between the independent variables and, separately, the timing of leaving and returning to the parental home. Respondents’ residential histories were segmented into a series of two-year migration intervals, each interval, or person-period, pertaining to the period between successive interviews. There were 1,484 person-periods originating in the parental home and 1,464 person-periods originating in independent living. For person-periods originating in the parental home, the dependent variable was comprised of two outcomes: remaining in the parental home and moving out. For observations beginning in independent living, the outcomes were remaining in independent living and moving back to the parental home. After moving out or moving back, respondents were no longer at risk of moving again in the same direction. Observations were censored at the 2011 interview or, in a few rare cases, at the time of sample attrition. We used logistic regression to estimate the effects of the covariates on the log-odds of moving out of and back to the parental home (Allison 1984).
Chained Equations that uses all the variables in the analysis to sequentially impute missing values (StataCorp 2009).
4. Results
4.1 Descriptive statistics
Table 2 presents descriptive statistics for all of the variables used in the analysis, separately for person-periods originating in and out of the parental home and by race and ethnicity. Over a typical interval beginning in the parental home, 44% of respondents moved out to live independently. Young White adults were more likely than their Black, Mexican, and other Hispanic peers to move out. Of those living independently at the beginning of the interval, 19% returned to the parental home within two years, with Whites less likely to move back than Blacks, Mexicans, and other Hispanics.
There are also racial and ethnic differences in most of the potential mediating variables. Among respondents originally living in the parental home, Whites were more likely than Blacks, Mexicans, and other Hispanics to transition from high school to college, but were less likely to transition from student/working to idle and from idle to working. Mexican youth were more likely than the other groups to remain working. Among respondents living independently, Whites were more apt than minority group members to remain in college and to remain working over the interval, and less likely than Blacks to both start and end the migration interval idling. In terms of relationship status transitions, Blacks and other Hispanics were more likely to stay non-partnered compared to Whites and Mexicans. However, Black respondents were about twice as likely as the other three groups to report being or about to be a parent.
Unsurprisingly, of the four racial and ethnic groups, Whites had the highest levels of high school completion, mother’s education, parental family income, parental wealth, and help received from the origin family. Other Hispanics closely followed Whites in these characteristics and had the highest annual income. Mexicans lagged behind the other groups in mother’s education, whereas Blacks had the lowest personal income, parental family income, and parental wealth. Perhaps because they received the most assistance from parents, White youth were less responsible for their day-to-day sustenance than their minority peers.
These racial-ethnic differences in life course transitions, socioeconomic resources, and family connectivity imply that these variables are indeed plausible candidates for explaining racial and ethnic differences in the likelihood of leaving and returning to the parental home.
4.2 Explaining racial and ethnic differences in leaving home
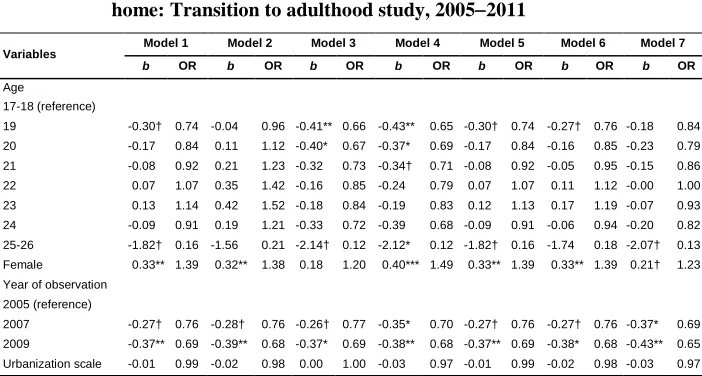
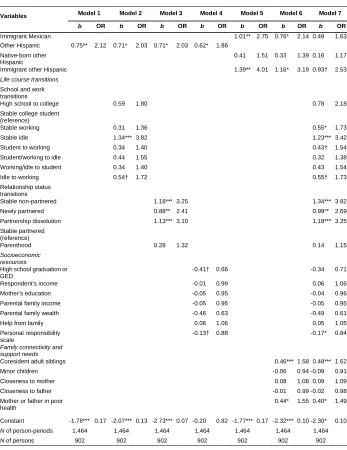
Table 3 presents the results of multivariate logistic regression models of the timing of moving out of the parental home. Included in Model 1 were the control variables (age, gender, year of observation, and urbanization) and three dummy variables comparing Black, Mexican, and other Hispanic respondents to Whites. Relative to the 17–18 year-old age group, the risk of leaving the parental home was significantly lower at age 19 and age 25. Young women moved out of the parental home sooner than young men. The coefficients for the year-of-observation dummy variables revealed a monotonic decline in the risk of leaving the parental home between 2005 and 2011. However, the risk of moving out did not vary significantly by the level of urbanization of the county that young adults originally lived in. After controlling for these variables, Black and Mexican young adults’ risk of moving out of the parental home was only about 70% that of their White peers, but other (i.e., non-Mexican) Hispanics did not differ significantly from Whites.
Table 3: Logistic regression models of the timing of moving out of the parental
home: Transition to adulthood study, 2005−2011
Variables
Model 1 Model 2 Model 3 Model 4 Model 5 Model 6 Model 7
b OR b OR b OR b OR b OR b OR b OR
Age
17-18 (reference)
19 -0.30† 0.74 -0.04 0.96 -0.41** 0.66 -0.43** 0.65 -0.30† 0.74 -0.27† 0.76 -0.18 0.84
20 -0.17 0.84 0.11 1.12 -0.40* 0.67 -0.37* 0.69 -0.17 0.84 -0.16 0.85 -0.23 0.79
21 -0.08 0.92 0.21 1.23 -0.32 0.73 -0.34† 0.71 -0.08 0.92 -0.05 0.95 -0.15 0.86
22 0.07 1.07 0.35 1.42 -0.16 0.85 -0.24 0.79 0.07 1.07 0.11 1.12 -0.00 1.00
23 0.13 1.14 0.42 1.52 -0.18 0.84 -0.19 0.83 0.12 1.13 0.17 1.19 -0.07 0.93
24 -0.09 0.91 0.19 1.21 -0.33 0.72 -0.39 0.68 -0.09 0.91 -0.06 0.94 -0.20 0.82
25-26 -1.82† 0.16 -1.56 0.21 -2.14† 0.12 -2.12* 0.12 -1.82† 0.16 -1.74 0.18 -2.07† 0.13
Female 0.33** 1.39 0.32** 1.38 0.18 1.20 0.40*** 1.49 0.33** 1.39 0.33** 1.39 0.21† 1.23
Year of observation
2005 (reference)
2007 -0.27† 0.76 -0.28† 0.76 -0.26† 0.77 -0.35* 0.70 -0.27† 0.76 -0.27† 0.76 -0.37* 0.69
2009 -0.37** 0.69 -0.39** 0.68 -0.37* 0.69 -0.38** 0.68 -0.37** 0.69 -0.38* 0.68 -0.43** 0.65
Table 3: (Continued)
Variables
Model 1 Model 2 Model 3 Model 4 Model 5 Model 6 Model 7
b OR b OR b OR b OR b OR b OR b OR
Race and ethnicity
White (reference)
Black -0.38** 0.68 -0.28* 0.76 -0.30* 0.74 -0.25† 0.78 -0.38** 0.68 -0.32** 0.73 0.03 1.03
Mexican -0.42* 0.66 -0.33 0.72 -0.49* 0.61 0.06 1.06
Native-born Mexican -0.30 0.74 -0.23 0.79 0.15 1.16
Immigrant Mexican -0.49† 0.61 -0.41 0.66 0.19 1.21
Other Hispanic -0.24 0.79 -0.15 0.86 -0.24 0.79 -0.11 0.90 Native-born other
Hispanic -0.22 0.80 -0.18 0.84 0.12 1.13
Immigrant other
Hispanic -0.27 0.76 -0.23 0.79 -0.08 0.92
Life course transitions
School and work transitions High school to college (reference) Stable college
student -0.71** 0.49 -0.90*** 0.41
Stable working -0.76*** 0.47 -1.25*** 0.29
Stable idle -1.17*** 0.31 -1.42*** 0.24
Student to working -0.99*** 0.37 -1.35*** 0.26
Student/working to
idle -0.82*** 0.44 -1.11*** 0.33
Working/idle to
student -0.99*** 0.37 -1.27*** 0.28
Idle to working -0.70** 0.50 -0.93** 0.39
Relationship status transitions
Stable non-partnered (reference)
Newly partnered 1.02*** 2.77 1.18*** 3.25
Partnership
dissolution 0.64* 1.90 0.62† 1.86
Stable partnered 1.63*** 5.10 1.69*** 5.42
Parenthood 0.11 1.12 0.29† 1.34
Socioeconomic resources
High school
graduation or GED 0.15 1.16 0.09 1.09
Respondent’s income 0.07 1.07 0.08 1.08
Mother’s education 0.09** 1.09 0.08* 1.08
Parental family
income -0.05 0.95 -0.02 0.98
Parental family wealth 0.09 1.09 0.24 1.27
Help from family 0.16** 1.17 0.18** 1.20
Personal
Table 3: (Continued)
Variables Model 1 Model 2 Model 3 Model 4 Model 5 Model 6 Model 7
b OR b OR b OR b OR b OR b OR b OR
Family connectivity and support needs
Coresident adult
siblings -0.17† 0.84 -0.12 0.89
Minor children -0.01 0.99 0.00 1.00
Closeness to mother -0.08† 0.92 -0.10* 0.90
Closeness to father -0.01 0.99 -0.02 0.98
Mother or father in
poor health -0.07 0.93 0.03 1.03
Constant 0.25 1.28 0.83** 2.29 -0.02 0.98 -2.18*** 0.11 0.25 1.28 0.86* 2.36 -0.91 0.40
N of person-periods 1,484 1,484 1,484 1,484 1,484 1,484 1,484
N of persons 1,049 1,049 1,049 1,049 1,049 1,049 1,049
Note: † p < .10, * p < .05, ** p < .01, *** p < .001, two-tailed tests
Models 2 through 6 in Table 3 added to this baseline model sets of factors that potentially mediate the relationship between race-ethnicity and the timing of home-leaving. Model 2 included the measure of school and work transitions. Relative to respondents entering college from high school, respondents in all other categories were significantly less likely to leave the parental home; those who remained idle over the migration interval were least likely to move out. Young adults’ school and work transitions explained a non-trivial but not substantial amount of the racial and ethnic differences in home-leaving; in partial support of Hypothesis 1a, when the school and work transitions were controlled, the coefficients for both Blacks and Mexicans in Model 1 were reduced by more than one-fifth (0.26 = 1− (−0.28)/(−0.38) and 0.21 = 1−(−0.33)/(−0.42)) and the coefficient for Mexicans was no longer statistically significant (see summary in Table 5).
Mexican-White difference actually increased by about 17%. This finding is consistent with Hypothesis 2a.
Model 4 of Table 3 added to the baseline Model 1 the seven indicators of young adults’ access to socioeconomic resources. Young adults’ high school completion, annual income, and their parents’ family income and family wealth were not significantly associated with the risk of leaving home. Mother’s educational level was positively associated with the odds of young adults moving out of the parental home. Both receiving financial assistance and taking responsibility for routine household expenditures were positively associated with young adults’ risk of leaving the parental home. Consistent with Hypothesis 3a, these indicators of socioeconomic resources explained a moderate share of the Black-White difference and all of the Mexican-White difference in the timing of leaving home; the Black-White difference was reduced by 34% (0.34 = 1− (−0.25)/(−0.38)) and the Mexican-White difference dropped to almost nil and became statistically non-significant.
Models 5 and 6 examined whether indicators of the strength of social and emotional connections between young adults and their parents help to explain the racial/ethnic differences in home-leaving. Model 5 showed that Mexican young adults from immigrant families were less likely than Mexicans with native-born parents to move out of the parental home. More importantly, the difference between native-born Mexicans and Whites (B=−0.30) was about 29% smaller than the difference between all Mexicans and Whites (B=−0.42). Thus, consistent with our hypothesis, the high proportion of immigrant families among Mexicans explained some − though by no means all − of the Mexican-White difference in the timing of home-leaving.
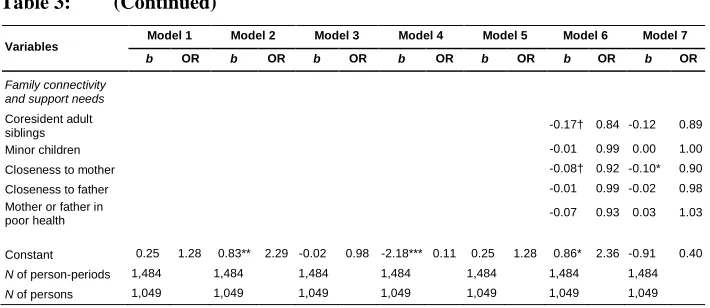
As shown in Model 6, the number of coresident adult siblings in the parental household and the respondent’s reported emotional closeness to his/her mother were negatively associated with the risk of leaving home at a borderline significance level. However, the number of minor children, emotional closeness to the father, and parental health status did not evince a significant association. A modest portion of the racial/ethnic differences in home-leaving was mediated by family connectivity and support needs, providing partial support for our Hypothesis 4a; the direct effects of being Black and being immigrant Mexican both dropped by 16% (0.16=1− (−0.32)/(−0.38); 0.16 =1− (−0.41)/(−0.49)).
home were fully accounted for by group differences in young adults’ life course transitions, access to socioeconomic resources, and family connectivity and support needs, even though no single mediator or subset of mediators explained these differences.
4.3 Explaining racial and ethnic differences in returning home
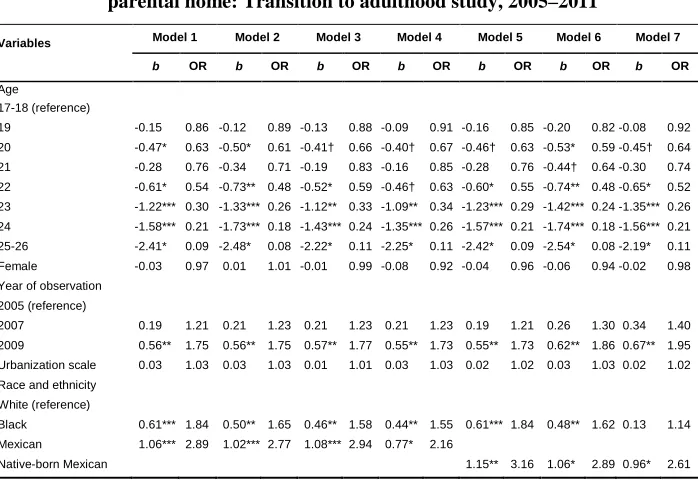
Table 4 presents parallel regression models of the risk of young adults’ returning to the parental home, conditional upon having lived independently. In Model 1 the negative coefficients for age revealed a near-monotonic decline in the odds of moving back with increasing age. The time trend variables indicated that the risk of moving back between 2009 and 2011 was 75% higher than the risk between 2005 and 2007. Gender and urbanization level were not significantly associated with young adults’ likelihood of returning home. Net of the influence of these factors, young Black adults’ risk of moving back was 84% higher than that of Whites, and young Mexicans’ and other Hispanics’ risks were 189% and 103% higher, respectively, than White respondents’ risk.
Table 4: Logistic regression models of the timing of moving back into the
parental home: Transition to adulthood study, 2005–2011
Variables Model 1 Model 2 Model 3 Model 4 Model 5 Model 6 Model 7
b OR b OR b OR b OR b OR b OR b OR
Age
17-18 (reference)
19 -0.15 0.86 -0.12 0.89 -0.13 0.88 -0.09 0.91 -0.16 0.85 -0.20 0.82 -0.08 0.92
20 -0.47* 0.63 -0.50* 0.61 -0.41† 0.66 -0.40† 0.67 -0.46† 0.63 -0.53* 0.59 -0.45† 0.64
21 -0.28 0.76 -0.34 0.71 -0.19 0.83 -0.16 0.85 -0.28 0.76 -0.44† 0.64 -0.30 0.74
22 -0.61* 0.54 -0.73** 0.48 -0.52* 0.59 -0.46† 0.63 -0.60* 0.55 -0.74** 0.48 -0.65* 0.52
23 -1.22*** 0.30 -1.33*** 0.26 -1.12** 0.33 -1.09** 0.34 -1.23*** 0.29 -1.42*** 0.24 -1.35*** 0.26
24 -1.58*** 0.21 -1.73*** 0.18 -1.43*** 0.24 -1.35*** 0.26 -1.57*** 0.21 -1.74*** 0.18 -1.56*** 0.21
25-26 -2.41* 0.09 -2.48* 0.08 -2.22* 0.11 -2.25* 0.11 -2.42* 0.09 -2.54* 0.08 -2.19* 0.11
Female -0.03 0.97 0.01 1.01 -0.01 0.99 -0.08 0.92 -0.04 0.96 -0.06 0.94 -0.02 0.98
Year of observation
2005 (reference)
2007 0.19 1.21 0.21 1.23 0.21 1.23 0.21 1.23 0.19 1.21 0.26 1.30 0.34 1.40
2009 0.56** 1.75 0.56** 1.75 0.57** 1.77 0.55** 1.73 0.55** 1.73 0.62** 1.86 0.67** 1.95
Urbanization scale 0.03 1.03 0.03 1.03 0.01 1.01 0.03 1.03 0.02 1.02 0.03 1.03 0.02 1.02
Race and ethnicity
White (reference)
Black 0.61*** 1.84 0.50** 1.65 0.46** 1.58 0.44** 1.55 0.61*** 1.84 0.48** 1.62 0.13 1.14
Mexican 1.06*** 2.89 1.02*** 2.77 1.08*** 2.94 0.77* 2.16
Table 4: (Continued)
Variables Model 1 Model 2 Model 3 Model 4 Model 5 Model 6 Model 7
b OR b OR b OR b OR b OR b OR b OR
Immigrant Mexican 1.01** 2.75 0.76* 2.14 0.49 1.63
Other Hispanic 0.75** 2.12 0.71* 2.03 0.71* 2.03 0.62* 1.86
Native-born other Hispanic
0.41 1.51 0.33 1.39 0.16 1.17
Immigrant other Hispanic 1.39** 4.01 1.16* 3.19 0.93† 2.53
Life course transitions
School and work transitions
High school to college 0.59 1.80 0.78 2.18
Stable college student (reference)
Stable working 0.31 1.36 0.55* 1.73
Stable idle 1.34*** 3.82 1.23*** 3.42
Student to working 0.34 1.40 0.43† 1.54
Student/working to idle 0.44 1.55 0.32 1.38
Working/idle to student 0.34 1.40 0.43 1.54
Idle to working 0.54† 1.72 0.55† 1.73
Relationship status transitions
Stable non-partnered 1.18*** 3.25 1.34*** 3.82
Newly partnered 0.88** 2.41 0.99** 2.69
Partnership dissolution 1.13*** 3.10 1.18*** 3.25
Stable partnered (reference)
Parenthood 0.28 1.32 0.14 1.15
Socioeconomic resources
High school graduation or GED
-0.41† 0.66 -0.34 0.71
Respondent’s income -0.01 0.99 0.06 1.06
Mother’s education -0.05 0.95 -0.04 0.96
Parental family income -0.05 0.95 -0.05 0.95
Parental family wealth -0.46 0.63 -0.49 0.61
Help from family 0.06 1.06 0.05 1.05
Personal responsibility scale
-0.13† 0.88 -0.17* 0.84
Family connectivity and support needs
Coresident adult siblings 0.46*** 1.58 0.48*** 1.62
Minor children -0.06 0.94 -0.09 0.91
Closeness to mother 0.08 1.08 0.09 1.09
Closeness to father -0.01 0.99 -0.02 0.98
Mother or father in poor health
0.44* 1.55 0.40* 1.49
Constant -1.78*** 0.17 -2.07*** 0.13 -2.73*** 0.07 -0.20 0.82 -1.77*** 0.17 -2.32*** 0.10 -2.30* 0.10
N of person-periods 1,464 1,464 1,464 1,464 1,464 1,464 1,464
N of persons 902 902 902 902 902 902 902
As with the models for moving out, Models 2 through 6 assessed the degree to which the mediating variables could explain racial/ethnic differences in the risk of returning home. Adding to the baseline model measures of school and work transitions, Model 2 showed that, relative to students remaining in college (the reference category), young adults who remained idle and those who transitioned from idle to working had 282% and 72% higher odds of returning to the parental home. Racial-ethnic differences in the likelihood of making transitions between school and work explained 17% (0.17 = 1 − 0.50/0.61) of the Black-White difference, but only 4% (0.4= 1 − 1.02/1.06) of the Mexican-White difference and 5% (0.05=1 − 0.71/0.75) of other Hispanic-White difference in the risk of returning, which partially supports Hypothesis 1b.
Model 3 added to the baseline model young adults’ relationship status transitions and parenthood status. The risks of leaving home for respondents who were consistently non-partnered or who had dissolved a partnership over the interval were about three times that of stably partnered respondents (the reference category). In addition, young adults who formed a new partnership were also more likely than those who remained partnered to move back to the parental home. Including relationship transitions and parenthood in the model reduced the coefficient for Blacks by 25% (0.25 = 1 −0.46/0.61) relative to Model 1, but the coefficients for Mexicans and other Hispanics barely changed. This result is consistent with Hypothesis 2b, which posited that transitions in relationship status help explain the Black-White difference in returning home but not the Hispanic-White gap.
The indicators of access to socioeconomic resources were added in Model 4. The effects of socioeconomic resources on the risk of moving back to the parental home were somewhat less consistent than their influence on the risk of leaving home (Table 3). Only high school completion and personal responsibility were significantly (and inversely) associated with the odds of returning at even a borderline significance level. However, these factors explained a nontrivial portion of the racial and ethnic differences in the risk of returning home, providing some support for our Hypothesis 3b; the coefficient for Blacks decreased by 28% (0.28 = 1−0.44/0.61), for Mexicans by 27% (0.27 = 1−0.77/1.06), and for other Hispanics by 17% (0.17 = 1−0.62/0.75).
Model 6 incorporated the indicators of family connectivity and support needs. Two indicators had a significant effect. Having coresident adult siblings in the parental household and having a parent in ill health raised the risk of moving back home by 58% and 55% respectively. Compared to their values in Model 5, the coefficient for immigrant Mexicans was reduced by one-quarter (0.25 = 1−0.76/1.01), and the coefficients for Blacks, native-born Mexicans, and immigrant other Hispanics declined by 21%, 8%, and 17%, respectively. This result provides some support for our hypothesis (4b) that family connectivity accounts for some of the racial and ethnic differences in the timing of returning home.
The final model in Table 4 (Model 7) included all variables that potentially mediate the relationship between race-ethnicity and the risk of returning home. Only a few coefficients changed relative to previous models. Among school and work transitions, the coefficients for stable working and for transitioning from student to working grew larger and became statistically significant. Even young adults experiencing these normal transitions were more likely than their counterparts who remain in college to move back into the parental home. After controlling for these factors, the coefficients for Blacks and immigrant Mexicans were reduced by 79% and 51%, respectively (relative to Model 1), and driven to statistical non-significance. However, the differences between Whites and both native-born Mexicans and immigrant other Hispanics were reduced by considerably less (17% and 33%, respectively), and both differences remained statistically significant.
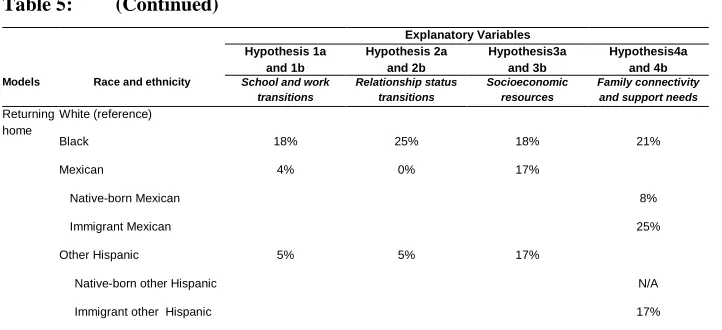
Table 5: Summary of results: Percentage reduction in racial and ethnic
differences in the timing of leaving and returning home
Explanatory Variables Hypothesis 1a
and 1b
Hypothesis 2a and 2b
Hypothesis 3a and 3b
Hypothesis 4a and 4b
Models Race and ethnicity School and work
transitions
Relationship status transitions
Socioeconomic resources
Family connectivity and support needs
Leaving home
White (reference)
Black 26% 21% 34% 16%
Mexican 21% 0% 86%
Native-born Mexican N/A
Immigrant .Mexican 16%
Other Hispanic N/A N/A N/A
Native-born other Hispanic N/A
Table 5: (Continued)
Explanatory Variables Hypothesis 1a
and 1b
Hypothesis 2a and 2b
Hypothesis3a and 3b
Hypothesis4a and 4b
Models Race and ethnicity School and work transitions
Relationship status transitions
Socioeconomic resources
Family connectivity and support needs
Returning home
White (reference)
Black 18% 25% 18% 21%
Mexican 4% 0% 17%
Native-born Mexican 8%
Immigrant Mexican 25%
Other Hispanic 5% 5% 17%
….Native-born other Hispanic N/A
….Immigrant other .Hispanic 17%
Note: “N/A” indicates that there is no statistically significant difference to be explained.
5. Discussion and conclusion
Despite pronounced racial and ethnic differences in the timing of young adults’ home-leaving and home-returning, we know little about why Black and Hispanic young adults are less likely than their White peers to move out of the parental home and more likely to return. We addressed this issue here by using recent longitudinal data from the Panel Study of Income Dynamics’ Transition into Adulthood module to explore factors that help to explain the lower risks of home-leaving and higher risks of home-returning among Blacks and Hispanics relative to Whites. Our analysis goes beyond previous research by hypothesizing and testing a wider variety of potentially mediating mechanisms, by measuring actual residential moves rather than static parental coresidence, and by conducting parallel analyses of both home-leaving and home-returning. Our use of longitudinal data extends prior cross-sectional studies of this issue (e.g., Britton 2013; Glick and Van Hook 2002; Treas and Batalova 2011) by allowing us to determine whether factors that help explain racial and ethnic differences in young adults’ propensity to reside with their parents operate through group differences in home-leaving, through group differences in home-returning, or both.
other Hispanic, and White young adults differ in the timing at which they leave home and the likelihood that they return. Our analysis leads to several broad conclusions.
First, we found that although no single factor or even subset of factors completely explains minority youths’ lower propensity to leave home and higher propensity to return, multiple factors combine to account for much of these differences. Broadly consistent with the life course principle of the timing of lives and with prior cross-sectional research (Treas and Batalova 2011), ethnoracial disparities in transitions between school and work and into and out of cohabiting unions explain a portion of these differences. As summarized in Table 5, Black and Mexican young adults’ lower tendency to enter and to remain in college partially explains their delayed timing of home-leaving and their higher risk of home-returning relative to Whites. Consistent with our hypothesis, young Blacks exhibit different patterns of relationship formation than Whites, and differences in the likelihood of establishing and maintaining a romantic relationship help to account for the Black−White differences in home-leaving and returning. This finding is also consistent with prior cross-sectional research (Britton 2013). Racially differentiated access to socioeconomic resources, reflected especially in mother’s education and financial assistance received from parents, is another important part of the explanation for why White and minority young adults differ in the timing of home-leaving and returning.
Second, our findings suggest that comprehensive explanations for racial/ethnic differences in leaving and returning home need to go beyond coincident life course transitions and the financial wherewithal to establish and maintain an independent household4. In particular, differences between minority and White youth in aspects of familism appear to be important. The presence of coresident siblings in the parental home and the degree of emotional connectivity between parents and adult children partially explain why Black and Hispanic youth tend to delay leaving home, while also evincing higher rates of ‘boomeranging’. The residential mobility of immigrants appears to explain part of the Mexican−White difference in home-leaving and part of the difference between non-Mexican Hispanics and Whites in home-returning (cf. Glick and Van Hook 2002). The influence of familism and other cultural differences could be considered a manifestation of the life course principle of linked lives.
Third, although racial and ethnic differences in life course transitions, access to socioeconomic resources, and family connectivity explained much of the racial and ethnic differences in home-leaving and home-returning, the specific factors accounting
4 To evaluate the contribution of familial factors, we estimated nested models first including all other
for the Black−White differences and for Hispanic−White differences differed in some respects. Black−White differences in both leaving and returning to the parental home were attributable to all three groups of mediating variables − school-to-work and relationship transitions, socioeconomic resources, and family connectivity. However, the Mexican−White difference in the timing of leaving home was mainly attributable to group disparities in school-to-work transitions and the availability of financial resources (Table 5).
Fourth, although the proposed mechanisms were able to account for the vast bulk of the Black−White and Hispanic−White differences in the timing of leaving home, and most of the Black-White difference in the likelihood of returning home, the models were much less successful in accounting for the Hispanic−White − and especially the Mexican−White − difference in returning home. These differences remained large and statistically significant even in the most comprehensive model of potential mediators, indicating that in these transitions there is considerable life course heterogeneity unaccounted for by our model. Perhaps these differences are attributable to other unmeasured aspects of family connectivity, such as young Hispanic adults’ perceived obligation to provide economic and social support to family members and their emotional closeness to siblings. Compared to Whites, young Hispanic adults may be more comfortable with sharing living spaces with parents and less likely to view parental coresidence as a barrier to the transition to full adulthood. Future research might explore these and other explanations for Hispanic youths’ unusually high likelihood of returning to the parental home after having lived independently.
Another possible explanation for the delayed home-leaving and accelerated home-returning among young minority adults is that they might be less responsive to the independent variables than Whites. For example, Black and Hispanic young adults may be less likely to leave the parental home not only because they receive lower wages but also because increases in earnings lead to smaller gradients in their risks of home-leaving compared to that for Whites. The models presented in this study assumed that independent variables have the same impact for each racial/ethnic group. In supplementary analyses we tested for interactions between race/ethnicity and all of the other independent variables and failed to find clear evidence that Blacks and Hispanics are less responsive to the predictors than their White peers. Nevertheless, future research might benefit from exploring ethnoracial differences in the magnitude of other predictors of leaving and returning home.
market crisis that defined the recession likely altered young adults’ calculus of living arrangements, making independent living financially infeasible and rendering coresidence with parents a more attractive option. These economic constraints may have impacted minority youth more strongly than White youth. Quantifying the impact of macroeconomic fluctuations on race-specific transitions out of and back into the parental home is an important task for future research.
Further research is also needed to address some of the limitations of this analysis. As noted above, our use of a two-year rather than shorter transition intervals likely incurs measurement error, both because some short-term moves will be missed and because it is not possible to observe the exact duration spent in the various living arrangements. We also acknowledge that leaving home to attend college results in a semi-autonomous living arrangement in which adult children are not completely independent of their parents. Future research might profit by using a more detailed measure of the various routes to leaving home, perhaps distinguishing moves to attend college from other pathways. Unfortunately, the PSID-TA dataset is too small for us to adopt such a detailed measurement strategy. As noted above, because of data limitations we are not able to consider incarceration as a pathway for leaving the parental home. Future research might attempt to explore the role of incarceration in explaining racial and ethnic differences in home-leaving and home-returning.
As with most observational studies, causal inference remains tentative. Some of the life course transitions may be both a cause and a consequence of home-leaving. For example, remaining in the parental home might detract from men’s desirability in the marriage market, and the degree of this devaluation might vary by race and ethnicity. We acknowledge as well that our sample is limited to youth no older than 26. It is possible that racial and ethnic differences in the timing of home-leaving and home-returning observed in our sample differ at older ages. Perhaps race-specific rates of leaving and returning home converge or even reverse at older ages. It is also possible that the factors accounting for these differences vary by stage in the life course. The use of subsequent waves of the PSID-TA data as well as other datasets that sample young adults of a wider age range will help to address this limitation.
References
Allison, P.D. (1984). Event history analysis: Regression for longitudinal event data. Newbury Park, CA: Sage.
Allison, P.D. (2001). Missing data. Thousand Oaks, CA: Sage.
Alon, S. and Haberfeld, Y. (2007). Labor force attachment and the evolving wage gap between white, black, and hispanic young women. Work and Occupations 34(4): 369–398. doi:10.1177/0730888407307247.
Aughinbaugh, A., Robles, O., and Sun, H. (2013). Marriage and divorce: Patterns by gender, race, and educational attainment: Bureau of Labor Statistics.
Avery, R., Goldscheider, F., and Speare, A. (1992). Feathered nest/gilded cage: Parental income and leaving home in the transition to adulthood. Demography 29(3): 375–388. doi:10.2307/2061824.
Blaauboer, M. and Mulder, C.H. (2010). Gender differences in the impact of family background on leaving the parental home. Journal of Housing and the Built Environment 25(1): 53–71. doi:10.1007/s10901-009-9166-9.
Britton, M.L. (2013). Race/ethnicity, attitudes, and living with parents during young adulthood. Journal of Marriage and Family 75(4): 995–1013. doi:10.1111/jomf.
12042.
Bureau of Labor Statistics (2014). Table 3. Median usual weekly earnings of full-time wage and salary workers by age, race, hispanic or latino ethnicity, and sex, quarterly averages, not seasonally adjusted. Retrieved from http://data.bls.gov/pdq/SurveyOutputServlet.
Cancio, A.S., Evans, T.D., and Maume Jr, D.J. (1996). Reconsidering the declining significance of race: Racial differences in early career wages. American Sociological Review 61(4): 541–556. doi:10.2307/2096391.
Choi, N.G. (2003). Coresidence between unmarried aging parents and their adult children who moved in with whom and why? Research on Aging 25(4): 384–404.
doi:0164027503025004003.
Coleman, J.S. (1988). Social capital in the creation of human capital. American Journal of Sociology 94: 95–120. doi:10.1086/228943.
Collins, P.H. (1999). Black feminist thought: Knowledge, consciousness, and the politics