Implementing Intensive
Intervention:
Lessons Learned From
the Field
SUBMITTED TO:
Division of Research to Practice
Office of Special Education Programs
U.S. Department of Education
PREPARED BY:
National Center on Intensive Intervention
October 2013
National Center on
IntensIve InterventIon
This document was produced under U.S. Department of Education, Office of Special Education Programs, Award No. H326Q110005. Celia Rosenquist serves as the project officer. The views expressed herein do not necessarily represent the positions or policies of the U.S. Department of Education. No official endorsement by the U.S. Department of Education of any product, commodity, service or enterprise mentioned in this document is intended or should be inferred.
This product is public domain. Authorization to reproduce it in whole or in part is granted. Although permission to reprint this publication is not necessary, the citation should be: National Center on Intensive Intervention. (2013). Implementing intensive intervention: Lessons learned from the field. Washington, DC: U.S. Department of Education, Office of
Contents
Executive Summary . . . 1 Introduction . . . 3 Conceptual Framework . . . 3 Methodology . . . 5 Site Selection . . . 5 Data Collection . . . 7 Data Analysis . . . 8Limitations of the Study . . . 9
The Five Districts . . . 10
Alton, Illinois . . . 11
Hancock, West Virginia . . . 11
Jenison, Michigan . . . 12
Okaloosa, Florida . . . 13
Scituate, Massachusetts . . . 14
Findings . . . 15
Implications for Intensive Intervention . . . 37
Conclusion. . . 41
References . . . 42
Appendix A: Data Collection Materials . . . 43
District Administrator Interview Protocol . . . 43
School Administrator Interview Protocol . . . 47
Interventionist Interview Protocol . . . 53
Parent Interview Protocol . . . 59
executive summary
The National Center on Intensive Intervention (NCII) has a mission to build district and school capacity to implement intensive intervention that will improve reading, mathematics, and behavioral outcomes for students with disabilities in Grades K–12 who have severe and persistent learning and/or behavioral problems. The purpose of this document is to present findings from an exploratory study of how five high-performing districts, which we refer to as NCII’s knowledge development sites, defined and implemented intensive intervention. The findings from this study reflect the most common themes that emerged from the data across all five districts, related to factors that facilitated or created challenges in the implementation of intensive intervention. The findings may offer lessons that other districts can learn from when planning for, implementing, and working to sustain their own initiatives to provide intensive intervention for students with the most severe and persistent learning and/or behavioral needs. The following are the seven key findings from this study:
1. In all sites, intensive intervention was defined as a component of a multi-tiered system of support (MTSS). These systems provided an infrastructure to support services for students with the most intensive needs, including those with disabilities, within the general education system.
2. The use of data to drive instructional decision making was pervasive in all sites, especially with respect to academic progress monitoring. In contrast, the use of diagnostic assessment data and behavioral progress-monitoring data was less defined and consistent.
3. All sites placed a heavy emphasis on capacity-building practices related to intensive intervention, including creating and maintaining broad stakeholder buy-in, building staff expertise, being flexible with scheduling, and making connections between intensive intervention and other related initiatives.
4. Meaningful engagement and involvement of families in decisions about program planning was important for supporting implementation of intensive intervention. 5. Identification and service delivery for special education occurred separately from and
after a student received intensive intervention within the tiered intervention system. 6. Staff defined intensive intervention as a process involving adaptation of a
secondary intervention (Tier 2), consistent with components of NCII’s data-based individualization (DBI) framework. However, staff spoke more frequently and concretely about making quantitative rather than qualitative adaptations to interventions. 7. Although all sites described using secondary intervention programs (Tier 2) as a
foundation for intensifying intervention, fidelity of implementation of these programs was inconsistent.
The findings that emerged from this study reflect common themes observed in the field, and prompted NCII to offer the following five lessons for consideration in implementing intensive intervention:
1. Intensive intervention is most likely to be facilitated when implemented as a component of a multi-tiered system of support.
2. Family engagement can be challenging, but is important to pursue to achieve successful outcomes for students with intensive needs.
3. Implementing intensive intervention in behavior brings a unique set of challenges, due largely to a lack of readily available tools.
4. Lack of clarity around the distinction between Tiers 2 and 3 in a multi-tiered intervention system can make it challenging to appropriately design and plan for intensive intervention.
5. Schools and districts should identify and seek to avoid hidden inefficiencies in the ways in which they use staff, particularly skilled special education staff, within the tiered intervention system.
Learning about how these five districts have addressed common challenges and mobilized limited resources to support students with intensive needs has helped NCII improve its own training and technical assistance work. It is our hope that the experiences shared by these districts can offer important insight and lessons learned for many other districts and schools around the country that either are starting, implementing, or fine-tuning programs for delivering intensive intervention.
Introduction
The National Center on Intensive Intervention (NCII) has a mission to build district and school capacity to implement intensive intervention that will improve reading, mathematics, and behavioral outcomes for students in Grades K–12 who have severe and persistent learning and/or behavioral needs. The term intensive intervention is not commonly understood, and variations abound in the literature regarding both its definition and implementation. The purpose of this document is to present findings from an exploratory study of how five high-performing districts, which we refer to as NCII’s knowledge development sites, defined and implemented intensive intervention. The findings are drawn from analysis of interviews with a limited purposive sample of key stakeholders in each district; therefore, they may not be interpreted as definitive or generalizable with respect to factors that universally support implementation of intensive intervention. We present these findings because they offer important lessons learned within these five districts and provide insight for other districts not only about what factors may support implementation, but also about how to address or avoid some of the common barriers to successfully implementing intensive intervention.
We purposively selected districts for this study that experienced notable success in educating their students with disabilities. We wanted to learn how this group of districts supported students with the most intensive academic and behavioral needs, and what factors they perceived facilitated their success. NCII recognizes the considerable contextual variation among districts and understands that successful practices in one district may not be as successful in another. Furthermore, we found that even high-performing districts experience challenges in implementing and sustaining intensive intervention. Nonetheless, the information we present here is intended to inform districts as they plan for implementing intensive intervention. We first present NCII’s conceptual framework for intensive intervention because it guided the development of our interview protocols and data analysis. Next, we describe the data we collected from the five districts, and the findings that emerged from these data. In addition, in the Implications section that concludes this paper, we offer NCII’s perspective on what these findings mean for effective, sustainable, broad-scale implementation of intensive intervention.
Conceptual Framework
NCII’s approach to intensive intervention is grounded in the concept of data-based individualization (DBI), a systematic method for using assessment data to determine when and how to intensify interventions in reading, mathematics, and behavior. DBI relies on the systematic and frequent collection and analysis of student-level data,
DBI is typically implemented within the context of a multi-tiered system of support (MTSS), such as response to intervention (RTI) or Positive Behavior Interventions and Supports (PBIS). An MTSS is a seamless, integrated system of academic and/or behavioral interventions that vary in intensity, are matched to students according to need, and are driven by team- and data-based decision making. In most cases, MTSS is conceptualized as having three “tiers” or “levels” including (1) core instruction that targets the needs of all students (often referred to as “Tier 1”), (2) secondary (or “Tier 2”) intervention for students who do not progress adequately in core instruction, and (3) tertiary (or “Tier 3”) intervention for students who do not respond adequately to either the core or secondary levels of intervention. Tier 3 typically involves intensive intervention.
DBI is an iterative, multi-step process that involves the analysis of progress-monitoring and diagnostic assessment data, followed by individualization of a validated academic or behavioral intervention program. The DBI process begins when data indicate that a student is making insufficient progress in response to a secondary (or Tier 2) evidence-based intervention program delivered with fidelity.1 The first step is to implement the
program with greater intensity (typically by making quantitative changes, such as a smaller group size or adding more time) and collect frequent progress-monitoring data. If the student continues to be unresponsive, diagnostic data are collected and analyzed to identify the specific skill deficits that need to be targeted. The results of the diagnostic assessment, in combination with the teacher’s analysis of what features of the intervention need to be modified to better support the student, help staff determine how to individualize the secondary intervention program to meet the student’s unique needs. Individualization at this stage often involves making qualitative changes to the instructional components of the program (e.g., adding vocabulary drills, increasing scaffolding) as opposed to quantitative changes, such as increasing the amount of time or decreasing group size. Upon implementing the change, the teacher continues to collect progress-monitoring data at regular intervals to help determine whether additional changes to the individualized intervention are required to support adequate student response. The DBI process provides a systematic way for interventionists to gradually intensify their instruction and support, based on data.
Although NCII did not specifically ask the knowledge development sites if they implemented DBI, our staff did ask questions about each of the major components of the DBI process (e.g., secondary intervention, progress-monitoring data, diagnostic assessment data, intervention modification). A greater familiarity with DBI may therefore be helpful for the reader of this document. A more detailed description of DBI and its components can be found on NCII’s website (see Data-Based Individualization: A Framework for Intensive Intervention at http://www.intensiveintervention.org/resource/data-based-individualization-framework-intensive-intervention).
1 Delivering an intervention with fidelity means delivering it consistent with the way it was designed and implemented during research studies that have validated its effectiveness. Important components of fidelity
Methodology
NCII selected five districts based on data suggesting strong performance for students with disabilities. We initially selected a pool of potential districts through two methods: (1) a statistical analysis of district-level academic achievement data for students with disabilities, and (2) nominations from members of NCII’s Advisory Board. The first method was intended to identify sites with evidence of positive outcomes for students with intensive
academic needs. The second method was intended to identify sites with evidence of positive outcomes for students with intensive behavioral needs. NCII staff then conducted telephone interviews with key informants from potential sites and used information obtained during these interviews to finalize the selection process. Researchers then conducted two-day site visits to each district, which included interviews and focus groups with key district and school-level staff. Below we describe our procedures for site selection, data collection, and data analysis.
Site Selection
Our first step in site selection was to identify districts where performance on state academic assessments for students with disabilities during the last five years had been consistently higher than what would be predicted based on the district’s background characteristics and the state average. Analyses were conducted in three states: Florida, Massachusetts, and West Virginia. These three states met our criteria of (a) having publicly available and readily accessible data on all required variables for the analysis, (b) being within reasonable geographical proximity to our staff, and (c) not offering an alternate assessment based on modified standards.2 Within these three states, we limited the
analysis to those districts in which performance for students with disabilities met or exceeded the state average. We also limited it to districts with a proportion of students with disabilities that was at least equal to the proportion in the district’s state. We did this to ensure that districts ultimately selected for the study were representative of other districts in the state in terms of the percentage of students with disabilities enrolled. Next, within each of these three states, we applied multi-variate regression analysis predicting district-level achievement on standardized reading and mathematics
assessments for the subgroup of students with disabilities.3 We based these analyses on
2 For states that offer an alternate assessment based on modified standards, we assumed that the population taking this assessment would be our subgroup of interest. Therefore, we did not look at any states that offered this type of assessment to ensure that the academic outcome data (state assessment data) used for our analysis included the population of students with disabilities who have the most intensive needs.
a set of district background characteristics that included total enrollment, percentage of students identified for special education, percentage of students in special education in each disability category, percentage of students who qualify for free or reduced-price lunch, percentage of students who are English language learners, and percentage of students in each of the different racial-ethnic categories.4
The results of this analysis yielded a predicted level of achievement for students with disabilities in each district. We then identified the districts in each state for which the average difference between the actual level of achievement of students with disabilities and the predicted level of achievement was the highest during the past five years. In other words, students with disabilities were performing better than expected in these districts. These districts (18 in Florida, 93 in Massachusetts, and 23 in West Virginia)5 formed our
initial pool of site visit candidates.
Next, we reviewed the results of the statistical analysis and identified the five top-ranked districts in each state in terms of the difference between actual and predicted levels of achievement. In some states, all of the top-ranked districts were similar in terms of location type (e.g., all suburban). Therefore, we identified some additional districts that were ranked between 5 and 10, but that were a different location type (e.g., urban or rural).
Finally, we conducted a secondary statistical analysis that mirrored the first with one exception: We included performance for students with disabilities in the prior year as a predictor. Because we were controlling for performance in the prior year, this second analysis represented consistently strong growth in performance each year. We used the first analysis as our primary analysis because we knew that districts that have consistently performed well during a five-year period may not see growth because they have always done well. Those sites were of primary interest to us. However, we also wanted to identify some districts that started with fairly low performance a few years prior, but have seen very strong growth in recent years. Therefore, we added to our group two districts that were the top ranked in this secondary analysis, but also still within the top 15 for the primary analysis. Following review of the data, we sent e-mails to a total of 20 districts requesting telephone interviews to determine fit for a site visit. Seven districts responded and agreed to an interview. Using a semistructured interview protocol, we asked interviewees questions about the strategies they use to support students with disabilities who have the most intensive needs, and the local education agency (LEA) and school system components that facilitate their success. We ultimately selected one district in each of these three states where (a)
4 There was some variation across states in predictors included. For example, we did not include the percentage of English language learners in the West Virginia analyses because this variable was missing for several districts and was 1 percent or lower in all other districts. Similarly, racial diversity was very low in West Virginia, so we collapsed racial categories to only include one predictor called “percent nonwhite.”
5 The large number of districts in Massachusetts is due to the fact that many school districts in the state consist of one regional high school or one elementary school. We ultimately removed these districts from our pool when
outcome data showed strong performance for students with disabilities, (b) district leaders were able to clearly articulate a strategy for supporting students with disabilities who have intensive needs, and (c) district leadership could identify at least one school within the district that exemplified its vision for implementing intensive intervention and would be willing to accommodate a site visit.
The statistical analysis described above was limited to academic outcome data only. Therefore, in addition to identifying top-ranked sites in three states using the procedures described above, we sought nominations of sites in other states from members of our advisory board. We were particularly interested in sites that had demonstrated success in the area of behavior. NCII staff reached out by telephone to staff from four different districts that were nominated by members of the advisory board.6 For these sites, we
conducted telephone interviews with a district representative or key informant to gather basic information about their program and data on behavioral outcomes for their students with the most intensive needs. After reviewing these data, we selected two of these districts for a site visit. Ultimately, our goal was to ensure that within the full group of five sites, there was diversity with respect to urbanicity, demographics, grade level represented in the example schools, and an intervention focus (academics or behavior). Detailed information on the five sites and the reason for their selection is provided in the section titled The Five Districts.
Data Collection
Once the five sites were selected, research staff conducted two-day site visits to each district. During each site visit, we met with district leadership and also visited one or two schools identified by district leadership as exemplary. Data collection during these site visits consisted of the following:
•
Interview with district administrator(s) (e.g., special education director)•
Interview with school principal(s)•
Interviews with key school administrative staff (e.g., assistant principal, special education coordinator, school psychologist)•
Interviews or focus group with interventionists (e.g., special education teacher, social worker)•
Interviews or focus group with parents•
Document review (outcome data, progress-monitoring data, individualized education program (IEP) data, professional development documentation, policies/guidance related to intensive intervention)Interviewees were selected in consultation with district and school administrators. We sought to interview staff in leadership positions, as well as staff who were most directly involved in the implementation of intensive intervention, for both academics and behavior. Research staff used semistructured protocols to guide the interviews, with questions focused on (a) how intensive intervention is defined and implemented, and (b) district and school system components perceived to facilitate or hinder effective implementation of intensive intervention. Copies of interview protocols are included in Appendix A.
Data Analysis
All interviews were audiorecorded and transcribed prior to analysis. Interview transcripts were coded with Atlas.ti, a qualitative data analysis software package. An initial set of codes was developed prior to coding; these codes aligned with NCII’s DBI framework for intensive intervention as well as the literature on implementation (Fixsen et al., 2005). For example, codes included the different components of the DBI process (e.g., progress monitoring, diagnostic assessment, intervention adaptation), factors related to implementing DBI (e.g., group size and composition, team-based decision making, scheduling), and common factors cited in the literature as supportive of effective implementation (e.g., leadership, staff buy-in, resources). This list of codes was modified regularly during the early phase of coding to accommodate common themes or patterns in the data that could not be captured by the initial list of codes. Appendix B contains the final list of codes that was used for the analysis.
A total of seven researchers contributed to the coding, although a core team of three researchers led the process, which included generating the initial code list, modifying the list based on feedback from and discussions with coders, and monitoring and troubleshooting issues that emerged during coding. Following coding, this core team of three researchers met to collaboratively review and analyze the coded data. The team identified common themes and sources of variation across the districts that were used to generate five overall findings that are described in this paper. These findings reflect themes that (a) emerged in all five districts, (b) were discussed repeatedly in several interviews within each district, and (c) were described either as a supporting factor or a barrier (or both) for the district in its efforts to implement intensive intervention. In the Findings section, we describe what the data reveal about how staff in the districts described these themes as they related to implementing intensive intervention. In the Implications section, we reflect on these findings and offer NCII’s perspective on strategies that may lead to effective and sustainable implementation of intensive intervention.
Limitations of the Study
The districts that NCII selected for this study met criteria suggesting success with students with disabilities; however, some caveats are warranted. First, data demonstrating “success” within each of these districts were very limited. For those districts identified through the statistical analysis of state achievement data, it is important to note that these outcomes were for the students with disabilities population as a whole, not the subpopulation of students with the most intensive needs. During telephone interviews and site visits, we asked if districts or schools could provide us with some data demonstrating improved outcomes for their students with intensive needs, but none of them were able to do so. This was not necessarily surprising but rather illustrative of some of the challenges involved in identifying and tracking data for this population of students. For example, many of the staff we interviewed struggled with making a clear distinction regarding which students were “Tier 3” versus “Tier 2.” This issue is described further in the Findings and Implications sections of this document. Second, although we contacted 20 sites to interview, only seven responded and agreed to an interview. This limited our pool of districts from which to choose. It is possible that had we gathered information from a wider pool of candidates, we would have had the opportunity to visit districts with better data on success for their students with intensive needs or demonstrated success in both academics and behavior.
Nonetheless, the five districts we ultimately selected did meet our two primary criteria for selection, which were (1) evidence of positive academic and/or behavioral outcomes for their population of students with disabilities, and (2) a well-defined and clearly articulated strategy for implementing intensive interventions and for supporting teachers in implementing intensive interventions effectively. The staff members we met with during the site visits were insightful and candid in sharing their successes and challenges. Research on intensive intervention, especially about the implementation of intensive intervention in real-life settings, is limited. The experience of these districts contributes greatly to our evolving understanding of this complicated process.
the Five Districts
In this section, we provide a description of each of the five districts. Three of the districts (Hancock, West Virginia; Okaloosa, Florida; and Scituate, Massachusetts) were selected as a result of the statistical analysis of state academic assessment data. Two of the districts (Alton, Illinois; and Jenison, Michigan) were selected through advisor nomination. Table 1 summarizes key demographic indicators across the districts.
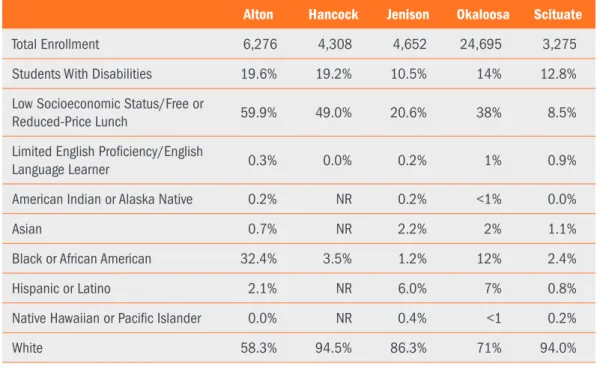
Table 1. Demographic Data by District (2011)
Alton Hancock Jenison Okaloosa Scituate
Total Enrollment 6,276 4,308 4,652 24,695 3,275 Students With Disabilities 19.6% 19.2% 10.5% 14% 12.8% Low Socioeconomic Status/Free or
Reduced-Price Lunch 59.9% 49.0% 20.6% 38% 8.5% Limited English Proficiency/English
Language Learner 0.3% 0.0% 0.2% 1% 0.9% American Indian or Alaska Native 0.2% NR 0.2% <1% 0.0%
Asian 0.7% NR 2.2% 2% 1.1%
Black or African American 32.4% 3.5% 1.2% 12% 2.4% Hispanic or Latino 2.1% NR 6.0% 7% 0.8% Native Hawaiian or Pacific Islander 0.0% NR 0.4% <1 0.2% White 58.3% 94.5% 86.3% 71% 94.0%
*NR = Not reported
SOURCE: State education department websites
These five districts vary across demographic characteristics. Okaloosa is the largest of the five, with a total student enrollment of nearly 25,000 compared with enrollments of 3,000– 6,000 in the other four districts. The size of the students with disabilities population ranged from 10 to 20 percent of total enrollment, with Alton and Hancock having the largest proportions of students with disabilities (19.6 and 19.2 percent, respectively), and Jenison and Scituate the smallest (10.5 and 12.8 percent, respectively). Alton, Hancock, and Okaloosa had relatively large percentages of their student population qualifying for free or reduced-price lunch (38–60 percent), and Scituate had the smallest percentage of students in this category (9 percent). Alton was the most racially diverse in terms of its student population, with 60 percent white and 32 percent African American students. The English language learner population was small in all five districts.
Alton, Illinois
Alton, Illinois, is a suburban district located in the southwest corner of Illinois, about 15 miles north of St. Louis, Missouri. Alton was selected for this study through nomination because of its focus on intensive intervention in behavior and recent evidence demonstrating positive behavioral outcomes for students with intensive needs. For example, since implementing intensive interventions for students with complex needs in 2006–07, Alton Middle School has seen a reduction in the percentage of students with six or more office discipline referrals, from 59 percent to 6 percent (Illinois PBIS Network, 2011). Alton enrolls 6,276 students in Grades K–12, including 1,230 (19.6 percent) students with disabilities. The district has seven elementary schools, one middle school, and one high school. Sixty percent of the students are of low socioeconomic status. Less than 1 percent of students are English language learners or limited English proficient. The district is 58 percent white, 30 percent African American, and 2 percent Hispanic. The majority of students met or exceeded proficiency targets on their No Child Left Behind (NCLB) state assessment in 2011 in reading (64 percent) and mathematics (67 percent). Twenty-six percent of students with disabilities met proficiency in reading and 36 percent met proficiency in mathematics. This district represented the one exception among the group in that performance for students with disabilities was below the state average. However, our focus in gathering data from Alton was on their implementation of and success with intensive intervention in behavior rather than academics. Given the general lack of information from sites implementing intensive intervention in behavior, NCII thought it was appropriate and important to include this district.
NCII staff visited Alton in May 2012 and conducted four interviews or focus groups with the following people:
•
The superintendent, director of special education, and PBIS external coach•
Two elementary school principals, one middle school principal, and an assistantprincipal from a high school
•
One high school principal and two social workers•
One parentHancock, West Virginia
Hancock, West Virginia, is a rural district located at the northernmost tip of West Virginia. Hancock was selected for this study through NCII’s statistical analysis, which placed Hancock among the top-ranked districts in the state in terms of the extent to which reading and mathematics performance for students with disabilities was higher than predicted. Specifically, between 2006 and 2011, an average of 31 percent of students
period of 26 percent and 29 percent, respectively. In addition, Hancock was ranked first among all districts in the state when the statistical model controlled for achievement during the prior year. In other words, Hancock not only showed consistently high performance for its special education population during the past five years, but had consistently strong growth
in overall student performance as well.
Hancock enrolls 4,308 students in prekindergarten through Grade 12, including 830 (19 percent) students with disabilities. The district has five elementary schools, two middle schools, two high schools, and one career and technical center. Ninety-five percent of students in Hancock County are white, 3 percent are African American, and 1 percent are multi-racial. Fifty-three percent of students are of low socioeconomic status and less than 0.01 percent have limited English proficiency.
NCII staff visited Hancock in May 2012 and conducted six interviews or focus groups with the following people:
•
The district school psychologist•
The district special education director and director of elementary curriculum and instruction•
One elementary school principal•
The middle school interventionist•
Two elementary school special education teachers•
One elementary school parentJenison, Michigan
Jenison, Michigan, is a suburban district located about five miles west of Grand Rapids, Michigan. Jenison was selected for this study through nomination because of its successful involvement with Michigan’s Integrated Behavior and Learning Support Initiative (MiBLSi). As an MiBLSi site, Jenison has received ongoing training and technical assistance on an RTI model that integrates school-wide implementation of PBIS and reading intervention.
Jenison enrolls 4,652 students in Grades K–12, including 488 (10.5 percent) students with disabilities. The district has six elementary schools, one middle school, and two middle/high schools. The district’s students are 86 percent white, 6 percent Hispanic, 2 percent Asian, and 1 percent African American. Twenty-one percent of the students are economically disadvantaged. Less than 1 percent of the students are English language learners. In 2011–12, the percentage of students with disabilities meeting proficiency targets exceeded the state percentages for both English language arts (74 percent versus 52 percent) and mathematics (47 percent versus 32 percent).
NCII staff visited Jenison in August 2012 and conducted five interviews or focus groups with the following people:
•
The school psychologist/RTI coach and special education director•
The director of personnel/curriculum, special education director, and school psychologist/RTI coach•
One elementary school principal•
A second elementary school principal•
The elementary school early intervention specialist, special education teacher, general education teacher, and school psychologist/RTI coachOkaloosa, Florida
Okaloosa, Florida, is a small city district stretching from the Alabama border in the north to the Gulf of Mexico in the south, and is the home to several Air Force and Army facilities. According to NCII’s statistical analysis of achievement data, Okaloosa was the top-ranked district in Florida in terms of the gap between the actual and predicted academic performance for students with disabilities during the past five years. Specifically, between 2006 and 2011, an average of 45 percent of students with disabilities met or exceeded proficiency targets in reading and 51 percent did so in mathematics. These percentages exceeded the state averages during this same time period of 28 percent and 33 percent, respectively.
The Okaloosa County School District enrolls 24,695 students in Grades K–12, including 3,457 (14 percent) students with disabilities, and operates 33 neighborhood public schools, which include two K–12 schools, one K–8 school, 19 elementary schools, seven middle schools, and four high schools. Students in Okaloosa are predominately white (71 percent), followed by African American (12 percent), Hispanic (7 percent), and Asian (2 percent). Thirty-eight percent are economically disadvantaged and 1 percent are English language learners.
NCII staff visited Okaloosa in May 2012 and conducted eight interviews or focus groups with the following people:
•
The district director of student intervention services•
The superintendent, RTI coordinator, exceptional education and student services coordinator, school psychologist, chief officer of Quality Assurance and Curriculum Support, curriculum supervisor, and director of student services•
An elementary school principal and literacy coach•
A high school principal and an assistant principal•
Two high school special education teachers•
Two parents of elementary school students•
Two parents of high school studentsScituate, Massachusetts
Scituate, Massachusetts, is a suburban district located 25 miles south of Boston. Scituate was selected for this study because of NCII’s statistical analysis, which showed consistently strong academic performance for students with disabilities during the past five years, relative to expected performance and to other similar districts in the state. In 2011, 51 percent and 36 percent of students with disabilities, respectively, met or exceeded state proficiency targets in reading and mathematics. This compares with the state average during the same year of 30 percent in reading and 22 percent in mathematics.
Scituate enrolls 3,275 students in Grades K–12, including 419 (12.8 percent) students with disabilities. The district has four elementary schools, one middle school, and one high school. The overwhelming majority of students in Scituate are white (94 percent). Nine percent of students are of low socioeconomic status and less than 1 percent are English language learners. Among the five districts visited, Scituate has the highest percentage of students overall meeting proficiency targets, with 88 percent deemed proficient in reading and 81 percent in mathematics in 2011.
NCII staff visited Scituate in May 2012, and conducted six interviews or focus groups with the following people:
•
The director of special education, reading/English language arts (ELA) department head, and mathematics department head•
Two elementary school principals, one middle school principal, and one elementary team leader•
One elementary school psychologist, one elementary speech therapist, and four elementary special education teachers•
Two elementary special education teachers and an inclusion coach•
One elementary school psychologistFindings
The findings from this study reflect the most common themes that emerged from the data across all five districts. These findings describe factors that facilitated success for these districts, as well as challenges that the districts were struggling with in the implementation of intensive intervention. All of the findings offer lessons that other districts can learn from when planning for, implementing, and working to sustain their own initiatives to provide intensive intervention for students with the most severe and persistent learning and/or behavioral needs. The seven key findings for this study were as follows:
1. In all sites, intensive intervention was defined as a component of a multi-tiered system of support (MTSS). These systems provided an infrastructure to support services for students with the most intensive needs, including those with disabilities, within the general education system.
2. The use of data to drive instructional decision making was pervasive in all sites, especially with respect to academic progress monitoring. By contrast, the use of diagnostic assessment data and behavioral progress-monitoring data was less defined and consistent.
3. All sites placed a heavy emphasis on capacity-building practices related to intensive intervention, including creating and maintaining broad stakeholder buy-in, building staff expertise, being flexible with scheduling, and making connections between intensive intervention and other related initiatives.
4. Meaningful engagement and involvement of families in decisions about program planning was important for supporting implementation of intensive intervention. 5. Identification and service delivery for special education occurred separately from
and after a student received intensive intervention within the tiered intervention system.
6. Staff defined intensive intervention as a process involving adaptation of a secondary intervention (Tier 2), consistent with components of NCII’s DBI framework. However, staff spoke more frequently and concretely about making
quantitative rather than qualitative adaptations to interventions.
7. Although all sites described using secondary intervention programs (Tier 2) as a foundation for intensifying intervention, fidelity of implementation of these programs was inconsistent.
FINDING 1: In all sites, intensive intervention was defined as a
component of a multi-tiered system of support (MTSS). These
systems provided an infrastructure to support services for
students with the most intensive needs, including those with
disabilities, within the general education system.
When selecting sites for this study, NCII did not include having an MTSS (such as RTI or PBIS) in place as one of its selection criteria. Instead, sites were selected based on strong outcomes for students with disabilities. Nonetheless, all five of the knowledge development sites did have an MTSS, and interviewees consistently described their MTSS as the vehicle through which they supported students who had the most intensive academic and behavioral needs. For example, students with the most intensive needs were frequently described as being in the top or third tier of support and as being previously nonresponsive to other interventions. Staff from multiple schools described the general process of a student moving between tiers of support as adding interventions and/or increasing the intensity of support when progress-monitoring data showed that current support was not enough. For example, one district administrator described the general process, noting that more intensive interventions were “layered on” when students were not responding to Tier 1 or 2 interventions.
On the academic side, all five districts implemented RTI. With respect to behavior, all five districts used some version of PBIS. Although the districts varied in terms of their experience with RTI or PBIS, staff in these districts provided similar descriptions of their RTI or PBIS systems as overarching frameworks that guide their approach to instructing all students. For example, when asked to describe the extent to which they use RTI, one principal responded, “It’s everything that we do….It’s every decision we make, whether it’s staffing resources or money to buy new programs.” For all of these districts, having academic and behavioral multi-tiered systems in place supported their implementation of intensive intervention in two ways. First, it provided them with a team structure that facilitated systematic and data-based identification and intervention decisions for students with the most intensive needs. Second, it provided a way for them to promote a shared responsibility for students with disabilities among general and special educators.
Team Structure
All sites relied on a team- and data-based decision-making approach to implement their RTI and PBIS systems. Teams consisting of special education and general education staff reviewed data on students not progressing in the core curriculum, and made decisions about who should receive intensive intervention, as well as what that intensive intervention should look like. Each site used a different name for its team meetings, but the general purpose and function were the same. In Hancock, each school had grade-level professional learning communities (PLCs), in which teachers and administrators met once a week to
review data and make decisions about which students were in need of more intensive intervention. Weekly data review meetings in Jenison, weekly RTI meetings in Okaloosa, and weekly Instructional Support Team (IST) meetings in Scituate served the same function. In Alton, each school had three separate teams that corresponded with the three tiers of the PBIS framework—a universal team, secondary team, and tertiary team. The tertiary team consisted of social workers and guidance counselors who met monthly with a PBIS coach to review data on students potentially in need of intensive behavioral intervention. In addition to providing a structure for reviewing data and making decisions about intervention, interviewees consistently praised the value of the team meetings and their effectiveness in building consensus and support among staff regarding serving students with the most intensive needs. A principal in Jenison said,
Those data review meetings, I can’t tell you how powerful those are. And truly, there is a lot of team-based decision making, a lot of buy-in, because they’re part of that. And then there’s also that opportunity to talk with our colleagues and feel comfortable saying this student is not as successful as I would like to see them be.
The director of special education in Hancock said, “I think the PLC approach has been dramatic in having everybody take ownership of the kids.”
Shared Responsibility for Students With Disabilities
In each of the five sites, RTI and PBIS were seen as general education initiatives, with special education and general education staff jointly taking on responsibility for all students. Staff described the involvement of general educators in their MTSS as instrumental to their success in implementing intensive intervention. In Scituate for example, the special education director initiated RTI six years prior to our site visit and described how implementation had evolved during that time: “Not only is special
education doing it [RTI], general education is…it’s becoming less and less separate…it’s almost blending. I mean, you can see it blending into just really one department eventually over time…it’s definitely more unified.” She shared a saying that reflects her district’s shared vision around serving students with intensive needs: “We’re all on the same team. We all own these kids and we all have to figure it out together.” An administrator in
Jenison spoke highly of the district’s shared ownership between general and special educators for student progress, saying, “They own these kids. They own those results.” A school psychologist from Hancock said that her advice to other districts looking to
implement intensive intervention would be “to get your gened teachers onboard with you.” A district administrator in Alton, when asked what she thought would happen if PBIS was framed as a special education initiative, said, “I feel like we’d lose buy-in. Because the beauty of this system that we’ve created is everybody buys in.”
FINDING 2: The use of data to drive instructional decision
making was pervasive in all sites, especially with respect
to academic progress monitoring. By contrast, the use of
diagnostic assessment data and behavioral progress-monitoring
data was less defined and consistent.
In all sites, academic progress monitoring was a well-established practice, with staff reporting that, for students in need of intensive intervention, they used a consistent set of tools and conducted progress monitoring at least weekly. By contrast, progress monitoring in behavior was less defined and consistently used. This was partly due to the fact that there were fewer available tools for monitoring progress in behavior than in academics. In these five districts, approaches to progress monitoring for students in need of intensive behavioral intervention included office discipline referrals (ODRs) and teacher-created direct behavior rating tools individualized for students.
Academic Progress Monitoring
In Hancock, Jenison, and Scituate, all staff with whom we spoke reported using DIBELS for progress monitoring in reading. For progress monitoring in mathematics, staff in Hancock used STAR Math, in Jenison they used easyCBM, and in Scituate they used AIMSweb. Staff in Okaloosa reported using weekly assessments that may include cold reads, Discovery Education Assessment probes, or classroom tests. Across all four of these sites, the use of data to monitor progress and drive instructional decision making was pervasive. In addition to the district-provided progress-monitoring tools, teachers reported using a variety of sources of formative assessment data to inform their understanding of students’ progress and needs. As one district administrator in Jenison explained, “We are looking at DIBELS as one of our sources. I’d say it’s probably the dominant source. But we’ve emphasized that that’s not the only, you know, that we don’t want to use just one source in the first place.” Teachers in Okaloosa said that they brought with them to their weekly RTI meetings “any assessments, formative assessments… to show the growth or not growth over time.” In Jenison and Scituate, interviewees described the importance of having all staff (special education and general education teachers) using academic progress-monitoring data as part of their normal routine. A principal in Scituate stated that “progress monitoring could be done by the specialists or it could be done by the classroom teachers” because all teachers had been trained. In Jenison, a district administrator explained that:
Most of our teachers that are doing progress monitoring in some level are intervention specialists... But we also require all of our gen ed teachers to do some kids. And so I think that’s been a huge component of it. I really think…that’s been a positive. Principals in Jenison agreed that progress monitoring is “definitely a shared responsibility.”
Behavioral Progress Monitoring
Progress-monitoring data in behavior, on the other hand, were less consistently collected and used than in academics. None of the districts reported using a commercial behavioral progress-monitoring tool, although a school psychologist in Hancock did mention that they had looked into AIMSweb’s behavior monitoring tool and were hoping the county would purchase it. The most common forms of behavioral progress-monitoring data were ODRs and teacher-developed tools that track target behaviors.
In Hancock, principals and teachers noted that the classroom teachers tallied target behaviors, and these data were used to monitor the extent to which student behavior was changing over time. In Jenison, a district administrator said, “As far as tracking [behavioral] outcomes… we don’t have any really formal way of doing that.” The administrator explained that the district used ODRs, attendance and suspension data, and the PBIS Network’s School-wide Information System (SWIS) to track major and minor behaviors that occurred each day. A principal explained that when students get to Tier 3, “If they’re most intensive, we graph their individual plans, whatever it is, with their goals…daily.” Another principal said, “We have target behaviors, usually two. We track scatter plots of whens, wheres, what was happening before.” In Okaloosa, an elementary school administrator reported that teachers would pick a target behavior and then “chart that child’s behavior against the rest of the class.” A teacher further explained, “We listen and try to focus on that one target behavior, and then specify the documentation based on that target behavior, whether it’s a checklist or a tick chart, something like that, so we can just focus on that one behavior.”
In Scituate, the director of special education said, “The data collection used for the academic piece is far… more proficient than the behavioral.” A principal agreed, saying, “If it’s academic, you’re definitely progress monitoring to see what the differences are and if you need to alter your approach along the way. The behavior is more anecdotal, I think, than having a nice clean-cut statistical piece.” In one school, an interventionist had created her own system for tracking student behaviors as follows:
We would take data on all the behaviors that we are monitoring…frequency data... how often do they exhibit a target behavior. Are they yelling out in class? Are they being non-compliant? Is there any aggression, stuff like that….So I track their data. You plot it out and you can see spikes in their behavior and you can track that back to certain things, sometimes… You track when they get high, when they get low, what’s working, where were they sitting when their behavior was kind of more under control, and if you really look carefully you can find a lot of little things in that. This teacher tracked data on a daily basis for the students she worked with, but there was no evidence that this kind of progress monitoring in behavior was consistently applied
In Alton, where behavioral intervention was the focus of our visit, staff struggled with how to monitor progress of students with the most intensive level of need. Staff reviewed ODRs weekly and sometimes daily, depending on the child, but for some students, interventionists created their own progress-monitoring systems based on individual goals. Interviewees described difficulties in determining “appropriate” progress. One social worker explained,
At the high school, it’s been a struggle for us because, for the secondary and check-in/ check-out student…if they’re not responding with no referrals in 4 weeks, then they’re not being successful or they’re not viewed as responding, which to me, at a high school level, seems crazy. …You know, I have a student…(who) never came to school, he had all Fs, sagged every day, had nothing. (Now) he’s coming to school, he’s in the work program, he has As and Bs, he sags every day, but to me, that’s an improvement. But maybe in the eyes of some it might not be, and people still get frustrated with him because he might still be lazy, this and that, but [to me]…that’s a huge improvement. So, I think we kind of have to look at it like that. Like, there may be a student whose referrals have reduced just, you know, instead of having seven at the first quarter, she now has four. To me, that’s an improvement.
The issue of using data to determine whether or not a student is responding was a constant source of conversation in Alton, and one that had not yet been fully resolved.
Diagnostic Assessment Data
Although it was clear that progress monitoring (particularly academic) was an important component of intensive intervention in all five sites, the extent to which staff collected and used diagnostic assessment as part of intensive intervention was less clear. Staff talked generally about gathering and analyzing data to drive instructional decision making, but these decisions were generally about who needed intensive intervention and about when it was necessary to make an intervention change, rather than about
what kind of intervention change to make.
There were a few instances in which staff made reference to specialists in their schools using diagnostic assessment data to identify specific skill deficits. For example, a principal in Scituate explained,
At any point, any students who “pop,” the specialists meet with the teams and go through the data. And then they start digging deeper into any students who pop, who aren’t on IEPs already. And the other data—I mean we use a lot of real data, classroom data, whole journals, tests—our reading specialist will often bring the kids down and have that person take a test with her so that she can see their thought processes. In Hancock, a special education teacher said, “When I think, oh, this may be a problem, that’s when I call the speech therapist and say… ‘can you do some more deeper testing?’ She can do more than I can do.” Other special education teachers in Hancock described
skills they’re weak in, and then she’ll work with them. She’ll tell me what to do with them. She’ll work with them. She’s kind of in-charge of that area. I don’t have to do the STAR Math. She’ll do that for us.”
In all five districts, interviewees mentioned using functional behavioral analysis (FBA) as a diagnostic assessment tool for identifying appropriate interventions for students with intensive behavioral needs, but some described challenges in implementing FBA. One administrator described FBA as “the weakest link,” and another said, “To do an FBA correctly, it just takes a really good amount of time, and it’s been a real challenge for our department to get those done and meet the urgency that the teachers have.”
FINDING 3: All sites placed a heavy emphasis on capacity-building
practices related to intensive intervention, including creating and
maintaining broad stakeholder buy-in, building staff expertise,
being flexible with scheduling, and making connections between
intensive intervention and other related initiatives.
Interviewees from all five sites described the need to build internal capacity to address challenges associated with the implementation of intensive intervention. More specifically, they acknowledged the need for sufficient funding, resources, and training to effectively serve students with the most intensive needs. Representatives from all sites described experiencing funding cuts and the associated challenges, in particular having to ask, motivate, and support staff to do more with less. A district administrator described the situation as “treading water while trying to build up systems and support systems to make life easier at the same time.” Leaders in these sites prioritized the need to build internal staff capacity to sustain implementation of intensive intervention. The data from the knowledge development sites revealed four key strategies that leaders used in their approach to capacity building: (1) create staff buy-in around a common vision, priorities and strategic objectives; (2) enhance collective staff expertise and professional development opportunities; (3) promote flexible scheduling arrangements that allow sufficient time for staff collaboration and service delivery; and (4) connect intensive intervention to other related initiatives.
Common Vision and Buy-In
The importance of creating staff buy-in around a common vision, priorities, and strategic objectives emerged as a common theme among districts: “Buy-in is huge,” explained one administrator. Another administrator explained their district’s success by saying, “It goes back to the close teaming in the district and that we’re all buying in to the one vision.” Principals echoed this sentiment and one added, “Buy-in is an ongoing challenge. [We]
When asked to describe their overall vision as it related to students with disabilities, many staff described the vision as one of inclusiveness, where the staff feel a sense of accountability for all students. Some described the vision as it related to achievement and outcomes: “We hold ourselves accountable for the proficiency and progression of all students. That is a belief statement and it’s just not words on paper.” Others were very specific about placement in the general education setting: “We’re a full-inclusion school district,” “the vision is that they [students with disabilities] be educated to the maximum extent possible in a gened setting,” and “we have the philosophy of we’re going to do whatever it takes to keep that kid as successful as we can in their general education classroom.” One teacher described the district’s vision as directly related to students with intensive needs: “We have a burning desire to teach children who need
remediation. We do. It’s like our goal. It’s our focus.”
In practice, these inclusive visions described by interviewees required gaining buy-in from general education staff, and several interviewees noted that this was challenging, mostly because training and responsibilities for general education staff had often been framed as separate from special education. Various interviewees described how general educators had previously been left out of trainings related to students with disabilities, looking at individual student data, and delivering interventions as these areas were viewed as special education activities only. An administrator described how his/her school’s intervention team used to be: “We didn’t always (involve general educators). We just had the principal, school psych, and the intervention specialist, and we’d consult with teachers as needed.” However, as described earlier in this report, the framing of intensive intervention as a component of an MTSS was helpful in getting general education staff committed and involved in educating students with intensive needs. In particular, general educators had become more involved and invested in making decisions about students with intensive needs because they were participating in regular data review meetings.
Another successful strategy for increasing buy-in was to demonstrate to staff the effectiveness of intensive intervention. One principal shared that buy-in had been a challenge for many teachers in his school until they could see for themselves the effectiveness of new practices in their classrooms and school. He explained,
For my staff, you have to prove it. They’re very much proof-based and so implementing any kind of change is a little bit slower process because… they want to see that this really works, and they’re not going to accept me telling them it really works. They want to see that it works.
Administration in this district added that when teachers recognized the effectiveness of these practices for students with intensive needs, they were more apt to buy-in to those practices. “As we’ve gotten the more challenging kids, teachers have recognized and seen the effectiveness of those practices, so it’s made it more sustainable.”
Building Staff Expertise
Interviewees in all five sites spoke about the importance of utilizing professional development opportunities, and capitalizing on existing staff expertise for implementing and sustaining intensive interventions. District staff pointed to opportunities for professional development as crucial in terms of enhancing collective staff expertise. In addition, many interviewees named specific teachers, specialists, and administrators whose expertise has had a strong impact on their ability to meet the needs of all students. In all five districts, administrators relied heavily on a train-the-trainer model of professional development, in which small groups of staff would receive training and then deliver that same training, or an aspect of that training, to other staff. This strategy was described as a cost-effective way to reach all staff with necessary professional development, as well as a way to build greater in-house expertise and capacity among staff.
Administrative staff members in all five districts were very intentional in selecting staff to deliver professional development, capitalizing on existing expertise to build overall capacity. Literacy specialists, mathematics specialists, coaches, school psychologists, and school principals were all mentioned as key staff members involved in providing professional development to other staff. An Okaloosa administrator said,
We try to take some of our specialists like our literacy coaches and our staffing specialist, and those individuals get special training to meet the needs of all of our students, and we try to do a cross-support…so that we’re more targeted and effective. A school psychologist in Scituate said, “I’m always doing little refreshers at staff meetings that I think are helpful for the general staff classroom teachers and whatnot.” An elementary school principal in Jenison commented, “Some of our administrators are our trainers for different areas.”
In Hancock, Okaloosa, and Scituate, special education teachers also delivered much of the professional development, through formal and informal means. For example, if teachers learned something valuable at a conference or outside workshop that was not attended by other staff, they shared what they learned afterwards in a faculty meeting or some other venue. As a teacher in Hancock explained,
We take that to the other special education teachers also within the county. I mean, so we’re always sharing. We may go to a professional development something, but we are sharing our information with all the other special education teachers in the county…we share that with the regular education teachers too.
In Scituate, the special education teachers and school psychologists interviewed described sharing their expertise on a regular basis with other teachers, often informally. One principal explained,
We lean on some of the expertise in our building. In the past couple of years, we’ve been probably lucky to secure some very talented people…. My intensive sped teacher…she’s able to help kind of in a more informally professional development piece, talking to the staff during faculty meetings about different parts of behavior or consulting with a classroom teacher who’s having problems and [is] unsure. The expertise…I’d say that’s part of school culture when you respect each other. Another staff member in Scituate described a more formal model of sharing expertise:
At least once a year… district-wide there have been teachers who have put on a workshop. And then you can pick from the workshops that are offered and you go and get informed by a peer. [The peer will say]… “this is working great for me, and for us, and in this school and in this classroom, and here’s how we do it.” And you really get engaged that way.
In Jenison, principals explained that their different areas of expertise (e.g., reading and mathematics) had allowed them to serve as “local experts” in these respective subject areas. In addition, administrators in this district used existing staff expertise by providing opportunities for staff to receive additional professional development to continue enhancing their expertise. In turn, these staff provided training to the rest of the staff in their
respective areas.
The notion of using in-district staff to deliver professional development was universally described as important and instrumental to the success of these districts in implementing intensive intervention. As one administrator noted,
See, that’s the problem of public education; we’ve always had pockets of people that were doing great things and superstars… [and] didn’t even want to share. We just wanted to keep it close to home. But now, what we do is we push it out to everyone in our district.
Flexible Scheduling
Staff from all five districts mentioned that scheduling was a major challenge to ensuring that students with intensive needs were receiving the best intervention from the most skilled interventionists. An intervention specialist in Hancock declared, “time and scheduling” to be two of the biggest challenges for schools supporting students with intensive needs, and an interventionist in Jenison remarked, “I think my biggest hurdle is scheduling… It’s really
hard to just find the time to give them everything that they need.” In the face of numerous scheduling challenges, the notion of flexible schedules emerged as a key factor in ensuring efficient and effective delivery of intensive interventions.
Staff from all five districts described various flexible approaches to modifying schedules in some capacity to allow time for intervention service delivery. Schedules were altered in a number of ways; for instance, adding instructional supports before and after school, and creating hybrid schedules so that concurrent school-wide mathematics and English language arts blocks facilitated cross-grade-level grouping for students requiring additional supports. During the interviews, interventionists and principals described struggles in creating a schedule with appropriate staff and interventions for students. A Hancock principal explained,
I have to be honest that, as good as I can make it sound, we are based on time, space and teachers. So some kids are going to just have to fit wherever we can try to put them in. We have been able to do some flexible grouping within grade levels.
Staff across sites noted that changing interventions and groupings based on student data is a part of intensive intervention that requires ongoing flexibility with respect to schedules. The use of flexible scheduling allowed schools to be more responsive to student needs in their intervention delivery. Leaders at a school in Jenison took a unique approach to managing a flexible schedule. As the principal described, “We have built a schedule that’s flexible enough to change resources, to change direction, to make sure that our students are getting what they need.” Staff described this schedule, which was displayed via a “big board” that was posted in a public place in the school. The board contained a daily schedule of who was providing what intervention, during which class, and in what space. Interviewees in the district explained that this process had gradually instilled a greater sense of flexibility in the school culture, as teachers had grown of anticipate changes after new rounds of data were analyzed. An added benefit was increased buy-in and commitment among general education staff: “I think this process of the big board has really helped expedite that culture change, too, including the gened teachers in that process….They know the groups, the needs of all the students in the school, not just their grade.“
One of the other ways that districts reported using schedule flexibility to respond to student needs was by changing the teachers of intervention groups to match the neediest students to teachers with the most expertise. An administrator explained that her goal in scheduling was “to remove obstacles so that the people that have the most expertise in terms of supporting and helping students are able to do the very best that they can.” She added, “We move people where we need to move them,” explaining that new student data could signal the team to rearrange the schedule, including interventionists, at any point.