France
© Springer 2005. Printed in the Netherlands 221
An Evaluation of Techniques
for Reducing Spatial Interference
in Single Display Groupware
Theophanis Tsandilas and Ravin Balakrishnan
Department of Computer Science, University of Toronto{fanis, ravin}@dgp.toronto.edu
Abstract. When several users interact with Single Display Groupware (SDG) (Stewart et
al., 1999) applications over a shared display, the potential exists for one user’s actions to spatially interfere with another’s (Tse et al., 2004; Zanella and Greenberg, 2001). We empirically evaluate four techniques for mitigating spatial interference in SDG: shared display with object ownership, spatially split display, shared display with uniform trans-parency between users’ data, and shared display with gradient transtrans-parency from one edge of the display to the other. Apart from time and error performance measures, we also consider the impact of each technique on user’s voluntary partitioning of the avail-able display space. Results show that the best approach in terms of performance is to share the entire display with appropriate use of transparency techniques for minimizing interference, and allow users to decide for themselves how they wish to partition the space, rather than pre-partitioning it for them. Results also show that complete sharing may result in misuse of screen space and demonstrate the potential of gradient transency as a technique that effectively balances costs and benefits of both sharing and par-titioning.
Introduction
Single Display Groupware (SDG) (Bederson et al., 1999; Stewart et al., 1999) enable multiple physically co-located people to interact concurrently using a sin-gle shared display, but with each user having their own input devices. In an SDG environment using indirect input technologies such as mice, physical contact or
interference between users are typically minimal and thus the body cues and so-cial protocols used to mediate shared-space interaction in the physical world (Pinelle et al., 2003) are less likely to be sufficient to prevent possible interfer-ence in the virtual realm. For example, one user could, perhaps inadvertently, ac-tivate a window that obstructs another user’s work area on a shared display.
Tse et al. (2004) examined the problem of spatial interference in SDG to de-termine whether users tend to naturally separate their workspaces and avoid any interference without the need for verbal negotiation or the use of special interac-tion techniques. They conducted a user study in which pairs of users completed a series of collaborative tracing and drawing exercises. The experiment showed that interference was rare as collaborators naturally organized their interaction with the shared display to minimize spatial overlap. This result indicates that the role of techniques that resolve interference in shared displays is less important, and designers should rather focus on how to exploit and promote the implicit parti-tioning naturally made by users.
The above result was based on a specific type of application where tasks could be split into partial subtasks that could be completed within a small space. There-fore, users did not have any reason to interfere. Morris et al. (2004) report, how-ever, that observations of groups of people interacting with SDG have shown that conflicts between users’ actions often arise, which may be either accidental or in-tentional. For instance, interference may be unavoidable when a task involves handling large objects such as whole windows and users interact close to each other. As Hutchings and Stasko (2004) observe, everyday interaction involves coordination of multiple windows and space management is an important issue even in single-user displays. Besides, we believe that the interesting question is not whether collaborators in SDG would naturally try to avoid interference when its cost is high, but whether the performance of collaborators could improve by applying interaction techniques that reduce the cost of interference.
In addition, there may be situations in which multiple people interact with the same display to perform tasks that do not involve collaboration. For instance, such situations may arise in front of public displays. As users may be strangers, social protocols may not be strong and interaction techniques may be needed to prevent users from dominating the space of the display. Moreover, the physical location of a user in front of a display may not be explicit or determined in ad-vance. Vogel and Balakrishnan (2004) suggest that interaction styles may change as the user transitions from distant to close interaction with a shared public dis-play. During this process, the new user will possibly have to interfere with the workspace of existing users and even negotiate or compete for screen space.
Thus, although interference in SDG may not always occur, there are enough scenarios in which they do pose a problem. As such, it is important to design SDG systems with appropriate techniques for minimizing interference, with a sound understanding of the relative strengths and weaknesses of the techniques.
Researchers have developed interface components that reduce interference, e.g., (Gutwin et al., 2003; Shoemaker and Inkpen, 2002; Yerazunis and Carbone, 2001; Zanella and Greenberg, 2001) − discussed in the next section, and evalu-ated them with reference to the standard completely shared display baseline in terms of task performance. However, there has not been a systematic evaluation of how multiple different techniques for reducing spatial interference in SDG per-form relative to one another, and perhaps more importantly how they influence the natural partitioning of display space. Our present work is an attempt to pro-vide some empirical data in this regard.
Related Work
An overview of problems arising when multiple people use a single display was presented by Bederson et al. (1999) and Stewart et al. (1999). Their work focused on collaboration in front of a single display and mainly investigated navigation conflicts that arise when users try to navigate in different areas of the shared data space. They suggested the following solutions to address navigation conflicts: (1) use a social protocol to negotiate and manage conflicts; (2) use a locking mecha-nism that prevents a user from navigating when another user is working; (3) use dynamic views to provide temporarily decoupled views; (4) split the display into one area per user; and (5) disallow any navigation. Shoemaker and Inkpen (2002), on the other hand, suggested that different users should be provided a different channel of output so that privacy is preserved and interaction conflicts are re-solved. This, however, requires users to wear special CrystalEyes glasses. A simi-lar approach was adopted by Yerazunis and Carbone (2001). Morris et al. (2004) proposed a set of coordination policies to resolve conflicts. Their work focused on conflicts caused by global user actions or by the access and manipulation of ob-jects rather than conflicts arising from spatial interference.
The problem of spatial interference in SDG was examined by Zanella and Greenberg (2001), who proposed the use of transparent widgets. They conducted an experimental study in which pairs of users played a type of game. The first user in each pair tried to complete a simple drawing task. The second user tried to disturb the task of the first user by popping up and clicking either an opaque or a transparent menu. As expected, the transparent menus reduced interference and improved the performance of the interfered player. A limitation of the above ex-periment is that it simulated a worst-case scenario where interference occurred constantly rather than the more realistic situation where interference is more in-termittent. Further, interference was not caused by any real need of users for more space and, as a result, the experiment did not examine the trade-off between screen space and interference. Also, the experiment did not examine how trans-parency could promote space separation. Our present work investigates this im-plication of using transparency.
The use of transparency as a means of reducing interference between overlap-ping workspaces has also been investigated in personal displays. Harrison et al. (1995a, 1995b) suggested the use of semi-transparent interface objects to support both focused and divided attention. Gutwin et al. (2003), on the other hand, ex-plored the notion of dynamic transparency which adjusts the level of transparency with respect the position of the user’s cursor. According to Tse et al. (2004), dy-namic transparency could be used to impose separation between the workspace of two users working on the same display. However, this argument was not further elaborated on or experimentally evaluated. Our present work investigates the value of object-centric dynamic transparency.
Techniques for Reducing Spatial Interference
Building upon previous work (Gutwin et al., 2003; Harrison et al., 1995a; Harri-son et al., 1995b; Hutchings and Stasko, 2004; Tse et al., 2004; Zanella and Greenberg, 2001), we identify three main techniques for managing screen space such that interference between the workspace of two or more concurrent users is minimized:
Shared screen. Users are allowed to utilize the entire screen, but can only
in-teract with objects that are owned by them or globally shared. The advantage of this technique is that it allows users to move freely around the display and define by themselves the boundaries of their workspace. Its efficiency, however, highly depends on social protocols. It does not prevent situations where “greedy” users extend their workspace into large areas of the screen, thus intruding into the workspace of other users and disturbing them.
Split screen. Splitting the screen into one area per user ensures that
interfer-ence between the workspaces of two users cannot occur. Splitting can be initiated either by the SDG system according to a splitting protocol or by its actual users. For instance, the Dynamo system (Izadi et al., 2003) allows users to interactively define private regions on a shared display. Splitting eliminates interaction con-flicts, but it restricts users into the space that is allocated to them. Traditional techniques of space navigation such as panning and zooming can relax the prob-lem of limited space.
Layers. Each user is provided with a different layer of interaction as shown in
Figure 1. Each layer may be visible to multiple users, but its contents can only be manipulated by its owner. In a collaborative environment a layer could belong to more than a single user. Interference between layers can be reduced by control-ling the transparency of the top layer. We extend the uniform transparency used by Zanella and Greenberg (2001), by proposing several unique ways in which transparency can be applied, as discussed in the following sections.
bottom layer
workspace of the 1stuser
workspace of the 2nduser top layer
bottom layer
workspace of the 1stuser
workspace of the 2nduser top layer
Figure 1. Splitting interaction into layers
Uniform Transparency on Overlapping Areas
Interference between layers can be reduced by simply applying transparency on the areas of the top layer which overlap with areas of the bottom layer. As dem-onstrated in Figure 2, the appearance of objects is not affected as long as there is no overlap between them. The main advantage of this technique is that users are allowed to use the whole space of the display while the use of transparency is lim-ited to overlapping areas. This can be considered as object-centric dynamic trans-parency. The disadvantage of the technique is that since there is no defined sepa-ration between the working areas of any two users, greedy users can utilize more of the display and dominate over others who seek to avoid interference.
bottom layer top layer blending result overlapping area bottom layer top layer blending result overlapping area
Figure 2. Applying transparency (alpha = 50%) to the areas of the top layer that overlap with areas of the bottom layer.
Varying Levels of Transparency
Another option is to divide the display into two or more partitions using varying levels of transparency. Each user has “transparency dominance” in one portion of the display, within which their content is displayed with maximum opacity while
other users’ content is displayed more transparently underneath. Consequently, users are encouraged to restrict their working space to the area which provides most visibility to their data. However, users can still use the other portions of the display to place objects that are temporarily inactive or out of the current focus of their ongoing task.
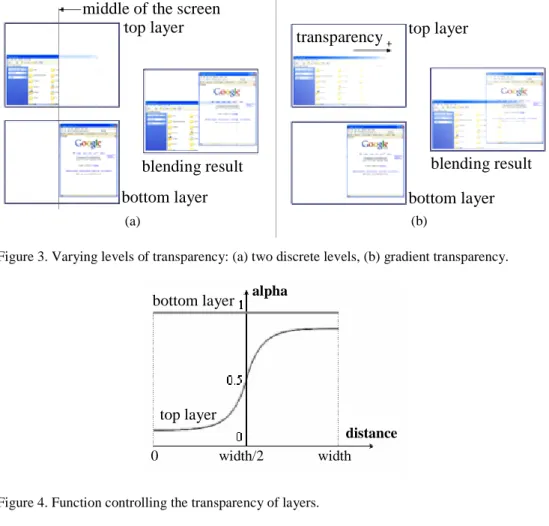
Figure 3 shows two techniques that divide a workspace using transparency. The first technique applies two levels of transparency to different halves of the top layer (Figure 3a). As a result, the transition between the two workspaces is discontinuous. The second technique (Figure 3b) adjusts the transparency level using a continuous function, which is shown in Figure 4. As a result, transparency smoothly decreases as users’ interaction moves away from their area of domi-nance.
middle of the screen top layer
bottom layer blending result middle of the screen
top layer bottom layer blending result (a) top layer blending result bottom layer transparency top layer
blending result bottom layer transparency
(b)
Figure 3. Varying levels of transparency: (a) two discrete levels, (b) gradient transparency.
bottom layer width/2 0 distance alpha top layer width bottom layer width/2 0 distance alpha top layer width
Figure 4. Function controlling the transparency of layers.
The above techniques have been designed so that no user has advantage over the other user. However, transparency levels could be adjusted in favour of a particu-lar user. This might be useful when the task of this user requires additional space or has a high priority. Conversely, high transparency levels could be used to pe-nalize aggressive users.
Taxonomy of Techniques
Figure 5 presents a taxonomy of techniques used to manage interference when multiple users work on the same display. The techniques are examined with re-spect to two main factors: (1) level of interference, and (2) level of sharing. There is trade-off between these two factors. Separation may result in less freedom in how to manage space and eventually decrease user performance. On the other hand, sharing results in more overlapping between users’ workspace which may translate into more interference and reduced user performance. Completely shar-ing and completely partitionshar-ing a display are the two extreme cases. The goal of transparency-based techniques is to reduce the gap between these extremes and improve user performance.
Figure 5. Taxonomy of techniques
Experiment
Goals
We conducted a controlled experiment to evaluate the role of different display partitioning and transparency techniques in reducing interference between the workspace of two users sharing a single display. More specifically, we examined four different techniques: (1) shared display (SHARED), (2) split display (SPLIT), (3) display with uniform transparency on overlapping content (TRANS), and (4) display with decreasing gradient transparency from one vertical edge to the other (GRAD). Following Zanella and Greenberg (2001), we hypothesized that transparency would reduce interference and, as a result, would improve task performance. Similarly to the above work and to other approaches that have stud-ied the effects of transparency (Gutwin et al., 2003; Harrison et al., 1995b), we used task-completion time as the main measure of user performance.
The experiment isolated situations in which the trade-off between space free-dom and interference becomes a significant factor in user performance. Such situations can emerge even in cases where users collaborate. As opposed to the
shared display x uniform transparency x split display x in te rf er en c e partitioning sharing decreasing transparency x shared display x uniform transparency x split display x in te rf er en c e partitioning sharing decreasing transparency x
experiment in Zanella and Greenberg (2001) where interference was reinforced by the rules of a competitive game, our experiment was designed so that interfer-ence naturally emerges as a result of the nearness between the users' working spaces as well as the space limitations posed by the display. In addition, our ex-periment examined transparency to a finer level of granularity and investigated how the different techniques promote space separation.
Apparatus
Two-mouse interaction was implemented using the MID package (Hourcade and Bederson, 1999). Since MID supports only older versions of the Windows operat-ing system (Windows 98/ME), we used MID’s capability of sendoperat-ing mouse events through a TCP/IP socket connection. As a result, our experimental system required two different machines being connected through a TCP/IP connection. The main components of the experimental software ran on a 2GHz P4 PC with Windows XP. This machine had a Dell UtraSharp 18-inch Flat Panel LCD Moni-tor, which was used to display the workspace of both users. The mouse of this machine was used by the user sitting at the left side of the monitor. The second mouse was provided by a Dell laptop running Windows XP and was used by the user sitting at the right side of the monitor. The laptop ran software responsible for sending events from the second mouse device to the main application. The software was built on Java 2 SDK, version 1.4.2. We employed Jazz’s (Bederson et al., 2000) multilayer architecture to separate the surface of interaction between multiple users and developed cameras that affected the transparency of visual ob-jects. The selection of the particular platform was also directed by future plans to develop zooming-based interaction techniques to reduce interference in SDG.
The experiment was run on a low screen resolution 800x600, as high-screen resolutions resulted in slight delays in the case of the two transparency tech-niques. The reason for such delays is that current versions of Java 2D did not sup-port hardware acceleration in the presence of multiple transparency levels. Future versions of Java will possibly address this problem. We note that the low resolu-tion used by the experimental system did not add any bias against any of the four techniques as object sizes were selected with respect to this resolution. In addi-tion, the experimental task did not involve tiny font sizes or pictures so the low resolution did not affect the legibility of objects.
Task
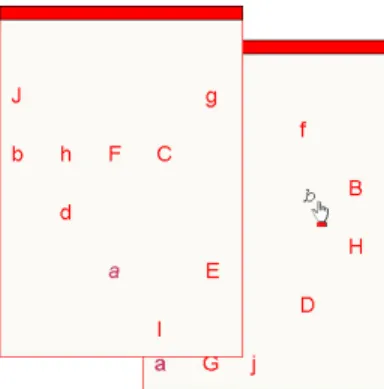
The experimental task consisted of a series of drag-and-drop subtasks. More spe-cifically, each user owned two windows. The movement of a window was con-strained by the size of the display (800x600 pixels). The model of activation and movement of a window was identical to the model used by popular operating sys-tems such as Microsoft Windows. As shown in Figure 6, each window contained
10 characters randomly positioned within the main area of the window. Charac-ters could be either upper-case letCharac-ters (‘A’-‘J’) or lower-case letCharac-ters (‘a’-‘j’). The user’s task was to match the characters between the two windows. Matching was performed by dragging a lower-case character from one window and releasing it on top of the corresponding upper-case character on the other window. The task was completed after the user matched all the 10 letters in alphabetical order.
Figure 6. Experimental task. User drags lowercase characters in alphabetical order from one win-dow and drops it on the matching uppercase character in the other winwin-dow. In this example, after finishing with ‘a/A’ the user drags ‘b’ to match it with ‘B’.
The size of windows was 270x390 pixels. This size was selected so that al-though completing the task in half of the display’s space (400x600) was feasible, completing the task using the whole display was significantly faster. The above task is representative of common computer tasks that require a relatively large space in order to be completed, such as copy-and-paste and drag-and-drop actions between different windows. In contrast to Zanella and Greenberg (2001) where the experimental task simulated a worst-case scenario, where users were continu-ally interrupted with interfering pop-up objects, our task simulates the more real-istic situation where two users try to accomplish their tasks as fast as possible within a limited screen space deciding on their own whether they should interfere or not.
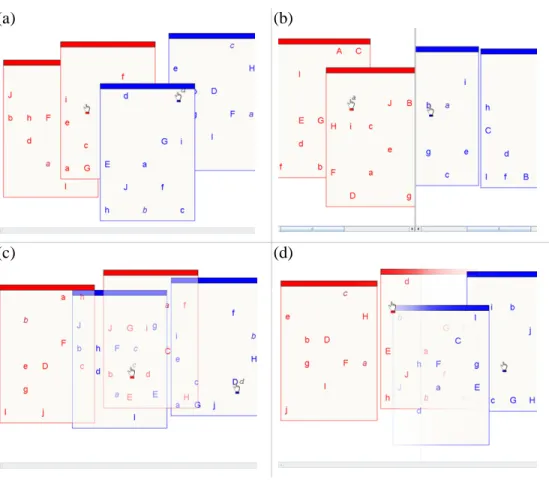
Figure 7 shows screenshots of the experimental setup when both users try to complete the task, using the four different display techniques. The borders and content of the windows owned by the user sitting at the left side of the monitor (Red Player) were coloured red, and the borders and content of the windows owned by the other user (Blue Player) were coloured blue. In the case of the shared display, when users clicked on top of a window that they owned, this win-dow was brought into focus possibly covering the view of the other user. Dead-locks were avoided by allowing windows to be activated even if hidden by win-dows of a different colour. As shown in the figure, the split display was enhanced with a scrolling mechanism, which allowed users to use a total space equivalent to
the entire display (800x600 pixels). Scrolling could be quickly performed by dragging the mouse left or right while pressing the right mouse button.
Participants
16 undergraduate students, 13 male and 3 female, 18-23 years old, participated in the experiment. All the participants attended a first year undergraduate course in Computers Science. They were randomly grouped into 8 pairs. In total, there were 5 male-to-male pairs and 3 male-to-female pairs.
Design
A full factorial design with repeated measures was used. Each pair of participants completed 18 similar tasks for all the four evaluated techniques. For each task, a different arrangement of the letters in a window was set. Also for each task, win-dows were differently positioned around the left side (left user) or right side (right
(a) (b)
(c) (d)
Figure 7. Evaluated techniques. (a) Shared display (SHARED), (b) split display with scrolling (SPLIT), (c) uniform transparency layered display (TRANS), (d) display with decreasing gradient transparency from one vertical edge to the other (GRAD).
user) of the screen. The order in which the 18 tasks were performed was random-ized for each technique and for each pair of participants. The order in which the pairs were exposed to the techniques was balanced using a Latin square. More specifically, each technique appeared exactly twice as first, second, third and fourth in the sequence. In summary, the experiment was designed as follows:
8 pairs of participants (16 participants) × 4 techniques ×
18 tasks per technique = 576 tasks in total
For each technique, in addition to the 18 main tasks, participants had to complete 3 practice tasks.
Measures
We examined two dependent variables measuring user performance: (1) task-completion time, and (2) number of errors. For task task-completion time, we define
MaxTime as the time taken by the user who was the slowest for the applicable
task, and MinTime as the time taken by the faster user for the same task. We
de-fine Errors as the sum − across both users − of the number of user attempts to drag and drop an incorrect letter and unsuccessful user attempts to drop a correct letter to the appropriate position.
In addition to time and errors, we measured the maximum screen space (Width) in pixels occupied by a user when completing a particular task. For a
par-ticular user, Width was measured as the distance from the side of the screen which
was closer to physical location of the user. The maximum value that Width could
have was 800 pixels and was measured only until the fastest user (“winner”) completed his or her task, i.e., it was measured only for the time that both users were active.
Procedure
The experiment was performed in a single session lasting 70-80 minutes. Partici-pants were asked to complete their tasks as fast as possible without being con-cerned about whether they disturbed the workspace of the other user. The purpose of this instruction was to guide user behaviour and discourage users from adopt-ing non-optimal strategies. Participants were neither encouraged nor discouraged from interfering. They were rather left to decide on their own about which space-management strategy would best facilitate their task. This behaviour may seem artificial, since social protocols would possibly discourage users from disturbing each other even if such a selfish behaviour helped them to complete their task faster. However, if we know that a particular interaction technique improves the
performance of both users when they act selfishly, then we can also conclude that the same technique will improve user performance in other situations.
Participants were asked to rest after each task. After a user’s task was finished, his or her windows were locked, and the user had to wait for the task of the other user to be completed. Both participants in a pair had to agree in order to continue to the next task. At the end of the experiment, participants completed a question-naire asking them to report how competitively or cooperatively they behaved dur-ing the experiment, to rank the four techniques, and give free-form comments.
Results
Measurements for 4 out of the 576 tasks were missing. ANOVA tests were pformed after replacing missing values by the mean scores (time or number of er-rors) performed by the same participant for the same technique. We also exam-ined outliers independently for each type of user (left-sided and right sided) and each technique. A value was considered as an outlier if it appeared three standard deviations away from the corresponding mean value. Rather than completely ig-nored, outliers were replaced by the worst (maximum) non-outlier score per-formed by any of the two users for the given technique. They accounted for 2.1% of the time measurements and 3.7% of the error measurements.
As the distributions of the time measurements were skewed, significance tests were performed on the inverse of the time measurements 1/Time, which represent task-completion frequencies. This approach ensured the reliability of the
signifi-cance tests since the resulting distributions were very close to normal. Clearly, a fast performance corresponds to a high task-completion frequency. Deviations from normality observed for the error distributions could not be corrected with simple transformations. However, additional statistics (mean, median, range) dis-cernable in the boxplot of Figure 9 support the results of the significance tests.
Task Completion Time
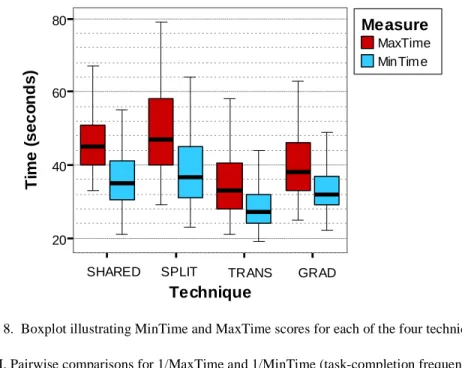
Figure 8 shows the mean times performed by the “winners” and “losers” of the tasks for all the four techniques. There was a significant main effect for tech-niques on 1/MinTime (F3,21=19.625, p<.001). Their effect on 1/MaxTime was also significant (F1.619,11.336 = 13.38, p=.002) 1.
As shown in Figure 8, TRANS was the fastest technique, followed by GRADS, while SPLIT was the slowest one. Post-hoc pairwise comparisons showed that mean differences were significant for the pairs (SHARED, TRANS), (SPLIT, TRANS), (SPLIT, GRAD), and (TRANS, GRAD). No significant differ-ence was found between SHARED and SPLIT and between SHARED and
1 Wherever degrees of freedom are reported as decimal numbers, the Greenhouse-Geisser’s correction has been used to correct violations of the sphericity assumption.
GRAD. Table I summarizes these results. The differences are clearer in the case of the 1/MinTime measure, as MinTime measures the time in which both users
were active and interference was more intense. In addition, MaxTime was more
vulnerable to outliers and noise. We can notice, though, that both measures follow similar trends, which shows that all the techniques helped or hindered the task of both “winners” and “losers” in the same way.
We should note that the overall mean times were similar for Red and Blue Player (38.9 vs. 38.1 seconds, respectively). As a result, we did not observe any significant main effect of the type of the player on 1/Time (F1,14 = .002, p=.969).
MaxTime MinTim e Measure Technique 20 40 60 80 Ti m e ( s e c o n ds )
SHARED SPLIT TRANS GRAD
Figure 8. Boxplot illustrating MinTime and MaxTime scores for each of the four techniques. Table I. Pairwise comparisons for 1/MaxTime and 1/MinTime (task-completion frequencies)
Techn (1) Techn (2) Sig.
a (1/MaxTime) Sig. a (1/MinTime) SHARED SPLIT 1.000 1.000 SHARED TRANS .069 .021 * SHARED GRAD 1.000 .299 SPLIT TRANS .004 * < .001 * SPLIT GRAD < .001 * .024 * TRANS GRAD .206 .036 *
a. Computed using Bonferroni’s adjustment. * The mean difference is significant at the .05 level.
Besides, we did not observe any significant interaction effect between the type of player and the tested techniques (F3,42 = .670, p=.575).
Errors
Figure 9 illustrates the mean number of errors made by users when using each technique. There was a significant main effect for technique on the number of er-rors (F3,21=98.480, p<.0001). Table II presents the results of pairwise compari-sons between the techniques. All pairs except (TRANS, GRAD) showed signifi-cant differences between the techniques. In summary, the SHARED technique
Red Player Blue Player Player Technique 0.0 2.5 5.0 7.5 10.0 N u m b e r of E rr o rs
SHARED SPLIT TRANS GRAD
Figure 9. Boxplot illustrating the number of errors for each of the four techniques. Table II. Pairwise comparisons for Errors
Technique (1) Technique (2) Sig. a (Errors)
SHARED SPLIT .002 * SHARED TRANS < .001 * SHARED GRAD < .001 * SPLIT TRANS < .001 * SPLIT GRAD .002 * TRANS GRAD 1.000 *
a. Computed using Bonferroni’s adjustment. * The mean difference is significant at the .05 level.
was the worst in terms of number of errors made by users, while the SPLIT tech-nique was the second worst. The mean number of errors for the two transparency techniques was similar.
Use of Screen Space
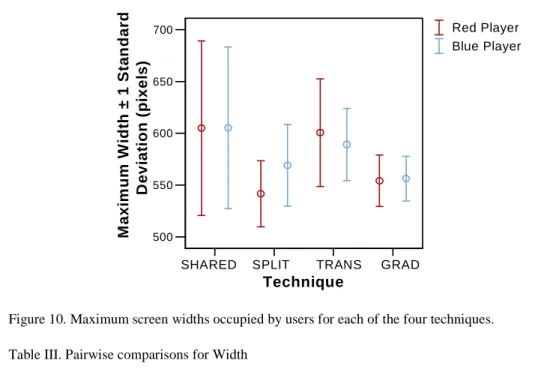
Figure 10 illustrates the variance of Width among the techniques. Users typically
utilized a space larger than the half of the screen (400 pixels) as this strategy fa-cilitated their tasks. The greatest screen-space consumption was made when the two sharing techniques were used (SHARED & TRANS). This means that users
1. SHARE 2. SPLIT 3. TRANS 4. GRAD Technique 500 550 600 650 700 M a xi m u m W idt h ± 1 Sta n dard D e v iat ion (p ix el s) Red Player Blue Player
SHARED SPLIT TRANS GRAD
Figure 10. Maximum screen widths occupied by users for each of the four techniques. Table III. Pairwise comparisons for Width
Technique (1) Technique (2) Sig.
a (Width) Red Player Sig. a (Width) Blue Player SHARED SPLIT .027 * .003 * SHARED TRANS 1.000 .431 SHARED GRAD .257 .002 * SPLIT TRANS .004 * .021 * SPLIT GRAD .728 .196 TRANS GRAD .046 * * <.001 *
a. Computed using Bonferroni’s adjustment. * The mean difference is significant at the .05 level.
did not try to limit interaction to a small area close to their side as such a strategy did not seem to be effective in terms of speed. On the other hand, the two splitting techniques (SPLIT & GRAD) provided less freedom to the users. As a result, user interaction was limited in a smaller area of the screen. The ANOVA test showed a significant main effect of the technique variable on Width (F1.543,10.804 = 10.734,
p=.004 for Red Player, and F3,21 = 27.523, p<.0001 for Blue Player). In addition, pairwise comparisons showed significant differences for the following pairs of techniques: (SHARED, SPLIT), (TRANS, SPLIT) and (TRANS, GRAD) for both Red Player and Blue Player, and (SHARED, GRAD) for Blue Player. These re-sults are demonstrated in Table III.
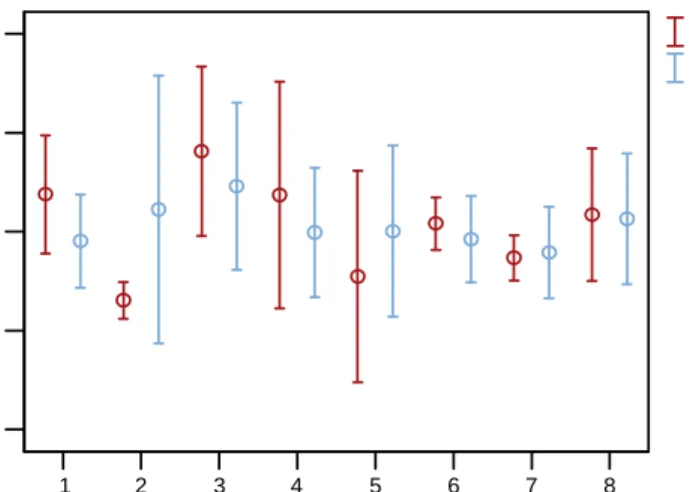
An interesting result is the great variance of maximum widths in the case of the SHARED technique. This could be attributed to users employing different strate-gies of screen space usage depending on the attitude of the “opponent” user, as indicated in Figure 11. Interestingly, users of the same pair synchronized their strategies as corresponding mean values and variances appear to be similar. This implies that users did not allow their “opponents” to dominate the space as such an approach would result in a slower performance. Exception to this phenomenon was the strategies adopted by the users of the second pair: Red Player was very conservative with screen usage, while Blue Player was rather aggressive.
Observations and Subjective User Feedback
We observed a variety of different behaviour demonstrated by participants. Al-though participants were instructed to act selfishly, it seems that social protocols were not totally disregarded. Most participants exhibited friendly, sharing, behav-iour while a few were highly competitive. Surprisingly, a participant commented that she got annoyed by the “lack of consideration” of the other user.
1 2 3 4 5 6 7 8 Pair of Players 400 500 600 700 800 M a xi m u m W id th ± 1 S tandar d D e vi at io n (p ixe ls ) Red Player Blue Player
The difference in participants’ attitudes was also demonstrated by their an-swers to the questionnaire. Four participants declared that they strongly agree or agree with the statement “I always tried not to disturb the other player”, while six participants strongly disagreed or disagreed with the statement. Six participants were neutral. Likewise, seven participants said that they strongly agree or agree with the statement “I interfered with the other player as long as this facilitated my task”. Three participants disagreed, while six were neutral. Participants were also asked to rank the four techniques that they used. Although the great majority (11 of 16) ranked the SHARED technique as the worst, no clear preference for the other techniques could be inferred.
Discussion and Future Directions
Space-Usage Strategies
Our results indicate that when space was not restricted, users did not necessarily divide the large shared space into completely separate individual ones, but rather worked in partially separate areas with significant overlap (Figure 10 & 11). This result contrasts with the observations by Tse et al. (2004) and indicates that the type of task can significantly impact space usage and interference strategies. We acknowledge, however, that as the experimental procedure directed users to adopt optimal strategies in terms of performance, social protocols may have not had the effect that they would have in real situations. An interesting question that future work needs to explore is whether and to what extend users would naturally adapt their space-usage strategies to the interaction technique used to handle interfer-ence. Would users decide to overlap their workspaces given that such an approach would improve their combined utility? If not, how could designers of SDG en-courage users to revise traditional social protocols and adopt strategies that would optimize their tasks?
Sharing versus Partitioning
According to our results, performance was worst in terms of the time measure, when the system split the screen into two separate areas (SPLIT condition). Scrolling added an additional cost which delayed the completion of the tasks. However, the SHARED condition resulted in high error rates, which together with participants’ subjective answers indicate that the latter’s performance was actually the worst one. On the other hand, providing interaction layers with uni-form transparency on overlapping content was particularly beneficial, as indicated by the fastest performance times and lowest errors in our TRANS condition. The new gradient transparency technique we developed was not as effective as uni-form transparency in terms of task peruni-formance time, but had similarly low error
rates. Although this result advocates against the explicit partitioning of the screen when transparency is used, separation may be beneficial in several cases. The GRAD condition resulted in a more economical use of space, and thus, it could be used to discourage aggressive users from dominating the display. Explicit parti-tioning, however, assumes the system’s knowledge about the position of users. The answer to the dilemma between sharing and partitioning a display may also depend on how much collaboration between users a task involves. We have worked on implementations that employ more than two layers of interaction. This allows the coexistence of both shared surfaces, which are more suitable for col-laborative tasks, and gradually fading surfaces, which are more suitable for inde-pendent tasks. In future work, we plan to assess the usefulness of these implemen-tations.
Limitations of Transparency
Results show that transparency-based techniques reduced interference and im-proved user performance. Nevertheless, we should be careful about how to gener-alize this result. In our experiment, the distribution of targets was relatively sparse and windows had simple backgrounds. The effectiveness of transparency has shown to reduce when background complexity becomes high (Gutwin et al., 2003). Several techniques could relax this limitation. Figure 12 demonstrates im-plementations of magic lenses (Bier et al., 1993) which locally reduce the trans-parency level of a region surrounding the cursor of a user (Figure 12 (a)) or the transparency level of a whole object (Figure 12 (b)). Dynamic transparency
(Gutwin et al., 2003), context-aware free-space transparency (Ishak and Feiner,
2004), and multiblending (Baudisch and Gutwin, 2004) are additional techniques
that could be used to effectively handle the trade-off between legibility of content and interference in SDG applications.
An additional limitation of our experiment is that colour was used to differen-tiate between objects of the two players (red and blue). The value of transparency could plausibly decrease if no colour separation was used as there would be an additional overhead for recognizing which objects belonged to whom. However, in real usage, users will probably be quite aware of the objects that they are
cur-(a) (b)
rently working on, and usage context will further aid in object identification. Also, simple techniques can be used to reduce this problem, for example by sub-tly and uniquely highlighting each user’s objects. Detailed investigation of this issue is worthy of future research.
Conclusions
We have presented a controlled study investigating the impact of four space shar-ing techniques in SDG. Our study focused on situations where interference be-tween users naturally emerges as a result of space limitations imposed by the dis-play. Our results have clearly shown the value of using transparency “when needed” for facilitating overlapping use of space in an effective manner. Taken as a whole, our results suggest that the best strategy for space management in SDG is to allow users to share the entire display with appropriate use of transparency techniques for minimizing interference, and decide for themselves how they wish to partition the space, rather than pre-partitioning it for them. On the other hand, gradient transparency results in more economical usage of space and therefore could be possibly used to effectively balance between user performance and space misuse. Future work needs to test the implications of our results in realistic col-laborative environments and explore legibility issues concerning the use of trans-parency. We are also planning to test the application of the proposed techniques in displays shared by more than two users and explore techniques for reducing interference in SDG that do not use transparency, for example, techniques based on zooming.
Acknowledgments
Special thanks to Matthew Boulos for his help in recruiting participants and John Hancock for setting up the experimental hardware. We also thank all the people who participated in our user studies, Anastasios Kementsietsidis and members of the DGP Lab for their valuable feedback.
References
Baudisch, P., and Gutwin, C. (2004). 'Multiblending: displaying overlapping windows simultane-ously without the drawbacks of alpha blending', ACM CHI Conference on Human Factors in Computing Systems, pp. 367-374, ACM Press.
Bederson, B. B., Meyer, J., and Good, L. (2000). 'Jazz: an Extensible Zoomable user interface graphics toolkit in Java', ACM UIST Symposium on User Interface and Software Technol-ogy, pp. 171-180, ACM Press.
Bederson, B. B., Stewart, J., and Druin, A. (1999). 'Single Display Groupware', Technical Report CS-TR-4086, University of Maryland, USA.
Bier, E. A., Stone, M. C., Pier, K., Buxton, W., and DeRose, T. D. (1993). 'Toolglass and Magic Lenses: The See-Through Interface', ACM SIGGRAPH Conference on Computer Graphics and Interactive Techniques, pp. 73-80, ACM Press.
Gutwin, C., Dyck, J., and Fedak, C. (2003). 'The Effects of Dynamic Transparency on Targeting Performance', Conference on Graphics Interface, pp. 101-110.
Harrison, B. L., Ishii, H., Vicente, K. J., and Buxton, W. A. S. (1995a). 'Transparent Layered User Interfaces: An Evaluation of a Display Design Space to Enhance Focused and Divided At-tention', ACM CHI Conference on Human Factors in Computing Systems, pp. 317-324, ACM Press.
Harrison, B. L., Kurtenbach, G., and Vicente, K. J. (1995b). 'An experimental evaluation of trans-parent user interface tools and information content', ACM UIST Symposium on User Inter-face and Software Technology, pp. 81-90, ACM Press.
Hourcade, J. P., and Bederson, B. B. (1999). 'Architecture and Implementation of a Java Package for Multiple Input Devices (MID)', Tech Report CS-TR-4018, University of Maryland, USA.
Hutchings, D. R., and Stasko, J. (2004). 'Revisiting display space management: Understanding current practice to inform next-generation design', Conference on Graphics Interface, pp. 127-134.
Ishak, E. W., and Feiner, S. K. (2004). 'Interacting with hidden content using content-aware free-space transparency', ACM UIST Symposium on User Interface and Software Technology, pp. 189-192, ACM Press.
Izadi, S., Brignull, H., Rodden, T., Rogers, Y., and Underwood, M. (2003). 'Dynamo: a public interactive surface supporting the cooperative sharing and exchange of media', ACM UIST Symposium on User Interface and Software Technology, pp. 159-168, ACM Press.
Morris, M. R., Ryall, K., Shen, C., Forlines, C., and Vernier, F. (2004). 'Beyond "social proto-cols": multi-user coordination policies for co-located groupware', ACM CSCW Conference on Computer Supported Cooperative Work, pp. 262-265, ACM Press.
Pinelle, D., Gutwin, C., and Greenberg, S. (2003). 'Task analysis for groupware usability evalua-tion: Modeling shared-workspace tasks with the mechanics of collaboration', ACM Transac-tions on Computer-Human Interaction, vol. 10, no. 4, pp. 281-311.
Shoemaker, G., and Inkpen, K. (2002). 'Single display privacyware: augmenting public displays with private information', ACM CHI Conference on Human Factors in Computing Systems, pp. 522-529, ACM Press.
Stewart, J., Bederson, B. B., and Druin, A. (1999). 'Single display groupware: a model for co-present collaboration', ACM CHI Conference on Human Factors in Computing Systems, pp. 286-293, ACM Press.
Tse, E., Histon, J., Scott, S. D., and Greenberg, S. (2004). 'Avoiding interference: how people use spatial separation and partitioning in SDG workspaces', ACM CSCW Conference on Com-puter Supported Cooperative Work, pp. 252-261, ACM Press.
Vogel, D., and Balakrishnan, R. (2004). 'Interactive public ambient displays: transitioning from implicit to explicit, public to personal, interaction with multiple users', ACM UIST Sympo-sium on User Interface Software and Technology, pp. 137-146, ACM Press.
Yerazunis, W. S., and Carbone, M. S. (2001). 'Privacy-Enhanced Displays by Time-Masking Im-ages', OzCHI Australian Conference on Computer-Human Interaction.
Zanella, A., and Greenberg, S. (2001). 'Reducing Interference in Single Display Groupware through Transparency', ECSCW European Conference on Computer Supported Cooperative Work, pp. 339-358, Kluwer Academic Publishers.