UNIVERSITY COLLEGE LONDON
Efficient Targeted Optimisation for the
Design of Pressure Swing Adsorption
Systems for CO2 Capture in Power
Plants
by
Joakim Henrik Beck
A Thesis Submitted for the Degree of Doctor of Philosophy
at the University College London.
Department of Chemical Engineering University College London (UCL)
I, Joakim Henrik Beck confirm that the work presented in this thesis is my own. Where information has been derived from other sources, I confirm that this has been
indicated in the thesis.
Abstract
Pressure swing adsorption (PSA) is a cyclic adsorption process for gas separation and purifica-tion, and can be used in a variety of industrial applications, for example, hydrogen purification and dehydration. PSA is, due to its low operational cost and its ability to efficiently separate CO2from flue gas, a promising candidate for post-combustion carbon capture in power plants,
which is an important link in the Carbon Capture and Storage technology chain. PSA offers many design possibilities, but to optimise the performance of a PSA system over a wide range of design choices, by experimental means, is typically too costly, in terms of time and resources required. To address this challenge, computer experiments are used to emulate the real system and to predict the performance. The system of PDAEs that describes the PSA process behaviour is however typically computationally expensive to simulate, especially as the cyclic steady state condition has to be met. Over the past decade, significant progress has been made in compu-tational strategies for PSA design, but more efficient optimisation procedures are needed. One popular class of optimisation methods are the Evolutionary algorithms (EAs). EAs are however less efficient for computationally expensive models. The use of surrogate models in optimisa-tion is an exciting research direcoptimisa-tion that allows the strengths of EAs to be used for expensive models. A surrogate based optimisation (SBO) procedure is here developed for the design of PSA systems. The procedure is applicable for constrained and multi-objective optimisation. This SBO procedure relies on Kriging, a popular surrogate model, and is used with EAs.
The main application of this work is the design of PSA systems for CO2 capture. A
2-bed/6-step PSA system for CO2separation is used as an example. The cycle configuration used
A special thanks goes to Prof. Eric S. Fraga, for his guidance, patience, and encouragement over these years of dissertation work. I also thank Dr. Serge Guillas for his valuable advice in the work related to statistical science.
I wish to acknowledge the Engineering and Physical Sciences Research Council for pro-viding financial support over the duration of this project (grants EP/F034520/1, Innovative Gas Separations for Carbon Capture, IGSCC). I thank Prof. Stefano Brandani and Dr. Daniel Friedrich for our collaborative work during this project, as well as for providing computer code used in this work for simulating pressure swing adsorption processes. I also thank Dr. Audrius Varoneckas for insightful discussions on high-dimensional visualisation for process design. I also wish to thank all my collaborators for making research a lot of fun; especially Dr. Lorenzo Tamellini for friendship and for our enjoyable research collaboration.
My parents, whose love, never-ending support, and encouragement, have been a source of strength for me over these years, I cannot thank you enough.
I would like to thank my loving family. My children, whom continue to remind me to keep everything in perspective, as well as inspire me. I must acknowledge my wife and best friend, Amina, more than anyone, without whose love this would not have been possible. You support me, inspire me, and put a smile on my face when I need one. My love, this thesis is dedicated to you and our children.
Contents
1 Introduction 15
1.1 Carbon Capture and Storage . . . 15
1.2 CO2capture . . . 17
1.3 CO2separation techniques . . . 19
1.4 The operation of PSA cycles . . . 25
1.4.1 Process steps . . . 25
1.5 Challenges with PSA design . . . 27
1.5.1 Design of complex PSA cycles . . . 28
1.6 Problem statement . . . 29
1.7 Objectives of the project and outline of the thesis . . . 30
2 Modelling and Simulation of PSA Processes 33 2.1 Principles of adsorption . . . 33
2.1.1 Adsorption equilibrium . . . 35
2.1.2 Mass transfer and diffusion in adsorbents . . . 36
2.2 Mathematical modelling of adsorption beds . . . 37
2.2.1 Intra-particle mass transfer model . . . 38
2.2.2 Adsorption equilibrium model . . . 40
2.2.3 Material balances . . . 40
2.2.4 Energy balances . . . 41
2.2.5 Momentum balance . . . 42
2.3 Computer simulation of PSA processes . . . 42
2.3.1 The CSS solution to the PSA model . . . 43
2.3.2 The computational model . . . 44
2.3.4 Numerical techniques for fast determination of CSS . . . 47
2.3.5 The Unibed approach: multiple-bed model reduction . . . 50
2.4 Summary . . . 51
3 Computer-aided Design of PSA Systems 52 3.1 Optimisation strategies for the design of PSA cycles . . . 52
3.1.1 Black-box optimisation . . . 54
3.1.2 Complete discretisation optimisation . . . 54
3.1.3 Simultaneous tailored optimisation . . . 55
3.1.4 Simplified optimisation . . . 55
3.2 Optimisation methods in literature for PSA problems . . . 57
3.2.1 Gradient-based optimisation . . . 57
3.2.2 Derivative-free optimisation . . . 60
3.2.3 Multi-objective optimisation . . . 61
3.3 Evolutionary algorithms . . . 68
3.3.1 The Nondominated Sorting Genetic Algorithm II . . . 70
3.4 Discussion and concluding remarks . . . 71
4 Surrogate Models for Optimisation of PSA Systems 73 4.1 Motivation . . . 73
4.2 Surrogate modelling . . . 76
4.3 Surrogate models in optimisation . . . 77
4.4 Kriging surrogate model . . . 78
4.5 Surrogate-Based Optimisation (SBO): a step-by-step procedure for PSA . . . . 82
4.6 Parallel implementation . . . 94
4.7 Dual-Piston PSA case study . . . 96
4.7.1 The Dual-Piston PSA . . . 96
4.7.2 The modelling and simulation of DP-PSA . . . 97
4.7.3 Case Setup . . . 99
4.7.4 Optimisation implementation details . . . 101
4.7.5 Preliminary analysis . . . 102
4.7.6 Numerical results . . . 104
Contents 7
5 Surrogate-based Optimisation for Multi-Criteria PSA Design 109
5.1 Optimal design of PSA cycles . . . 111
5.2 Surrogate based criteria for multiple objectives and constraints . . . 112
5.2.1 Surrogate based evolutionary multi-objective optimisation . . . 113
5.2.2 MOEGO: a multi-objective expected improvement criterion . . . 113
5.2.3 Surrogate based criteria for constrained optimisation . . . 115
5.3 Premature convergence . . . 117
5.4 Failure in PSA simulator response . . . 118
5.5 Transformed Kriging for purity and recovery computations . . . 120
5.6 Summary . . . 120
6 Surrogate-based Multi-Criteria Design: CO2Capture by PSA 123 6.1 Introduction . . . 123
6.2 The 2-bed/6-step PSA system . . . 124
6.2.1 Model equations . . . 127
6.3 SBO setup for different PSA design problem formulations . . . 131
6.4 Preliminary analysis . . . 134
6.5 Global sensitivity analysis on a small initial training data . . . 137
6.5.1 Global sensitivity analysis with Sobol’ indices . . . 138
6.5.2 Use of gPC for computing Sobol’ indices . . . 139
6.5.3 gPC on Kriging using a small initial training data: GSA on PSA . . . . 143
6.6 SBO performance . . . 146
6.6.1 Case I: Maximise CO2purity . . . 146
6.6.2 Case II: Maximise CO2purity with>90%CO2recovery . . . 147
6.6.3 Case III: Maximise CO2purity and recovery . . . 148
6.6.4 Case IV: Maximise CO2purity and recovery, and minimise power con-sumption . . . 155
6.6.5 Comparison in terms of computation effort . . . 157
6.7 Concluding remarks . . . 158
7 Conclusions and Future Work 160 7.1 Conclusions . . . 160
Appendices 163
List of Figures
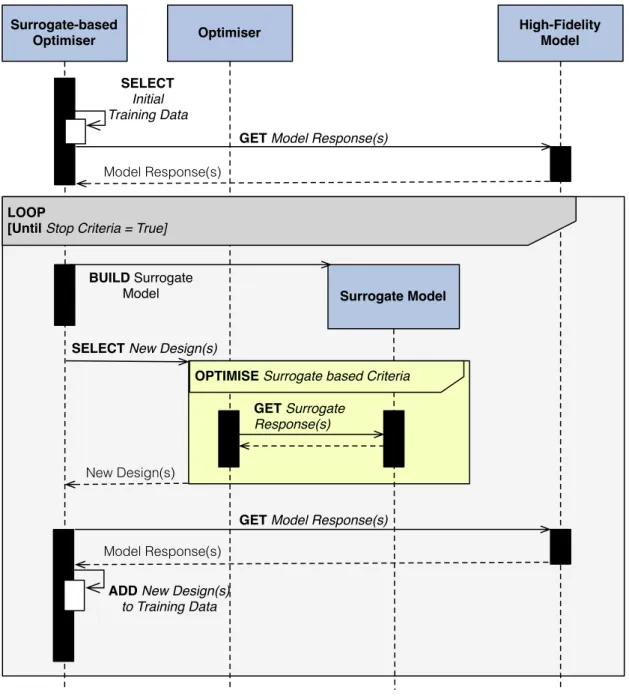
1.1 The diagram, originally published in [FFP+08], illustrates three types of carbon capture systems: post-combustion, pre-combustion, and oxy-combustion. . . . 18 1.2 Membrane separation. . . 21 1.3 A simplified illustration of the principles of adsorption, when gas molecules are
in close proximity to the solid surface with selectivity towards the molecules. . 22 1.4 Schematic of 2-bed/4-step PSA system with a first-generation Skarstrom
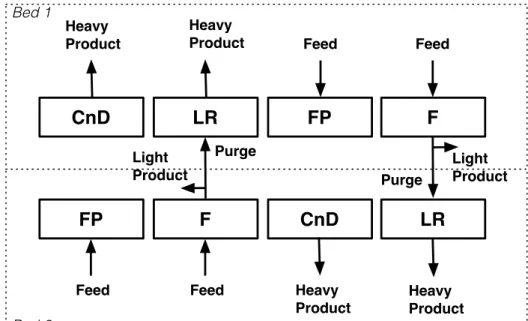
cy-cle. The steps included are feed pressurisation (FP), feed (F), countercurrent depressurisation (CnD), and light reflux (LR). . . 26
2.1 Unibed system of a 2-bed/4-step PSA system with classical Skarstrom cycle. The process steps included are feed pressurisation (FP), feed (F), countercurrent depressurisation (CnD), and light reflux (LR). . . 51
3.1 Left: 2D example of the design solutions in the objective space (Purity versus Recovery), with red dots representing non-dominated solutions. Right: 3D ex-ample of the solutions in the objective space, which also includes the Power consumption. The data used in the plot is from a 2-bed/6-step PSA system under investigation in Chapter 6. . . 62 3.2 Minimise φ = p (x1−1)2+ (x2−1)2, p (x1+ 1)2+ (x2+ 1)2 T over support x = (x1, x2)T ∈ [−2,2]2. An example of a Pareto front
approxi-mation, and illustration of the hypervolume indicator S(P) of the Pareto front, P. The Pareto front P consists of the nondominated solutions, which are marked in red. The true Pareto front (blue dashed-line) is the hyperline segment from (0,2√2)T to (2√2,0)T. The reference point for S(P) is marked in green, and located at(1.8√2,1.8√2)T. . . 67
3.3 An illustration of the NSGA-II layers of non-dominated solutions. The data is taken from a NSGA-II-based optimisation, where purity and recovery are maximised simultaneously. The first layer is the Pareto front, and second layer the Pareto front of the solutions when the solutions of the first layer have been excluded, and so on. . . 70
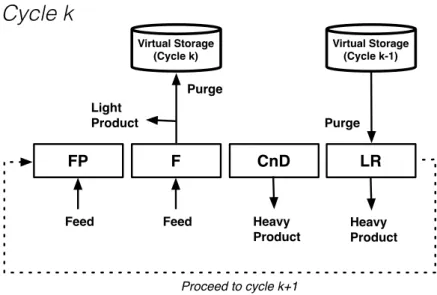
4.1 Direct approach with surrogate models . . . 78 4.2 Kriging mean predictions for two simple examples. The translucent area is
the 95% confidence band. Top: 1D Santner2003 function,τ2 = 10−11 and
ξ1 = 0.14. Bottom: 2D Branin function, withτ2= 10−11andξ= (0.37,1.46)T. 80
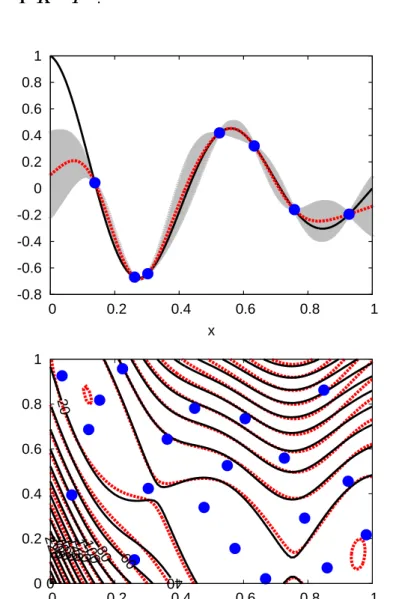
4.3 A sequential diagram of the interaction between the surrogate model, the opti-miser, and the detailed model, representing the core of conventional surrogate-based optimisation (SBO). . . 84 4.4 Examples of classical experimental designs in a two-dimensional domain:
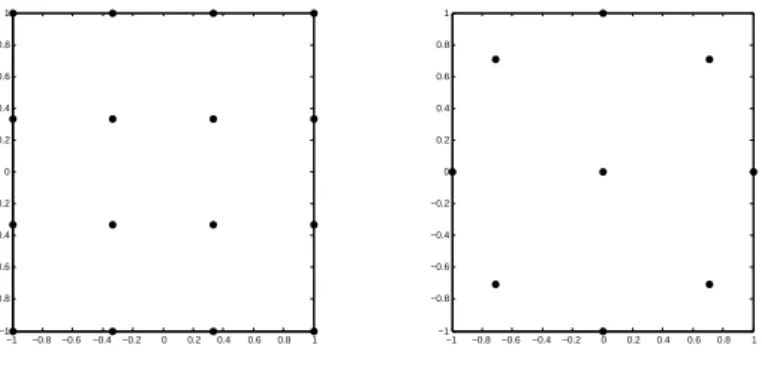
full-factorial design (Left) and central composite design (Right). . . 86 4.5 A LHD (m= 16) sampled in a 3-D design space. . . 88 4.6 2-D Examples of LHDs. Left: One-shot LHD. Middle: MmLHD selected from
107 LHDs, Right: mMLHD selected from104LHDs. . . . 89
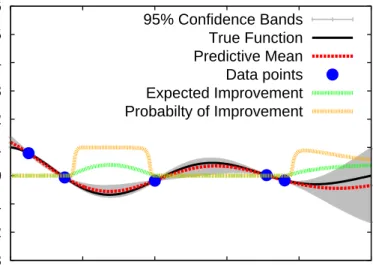
4.7 Illustrative example: Expected Improvement, and Probability of Improvement withyref =ymin−0.4|ymin|as reference point. . . 92 4.8 Illustration of CPU utilization of 8 CPUs for a single batch of 8 design points
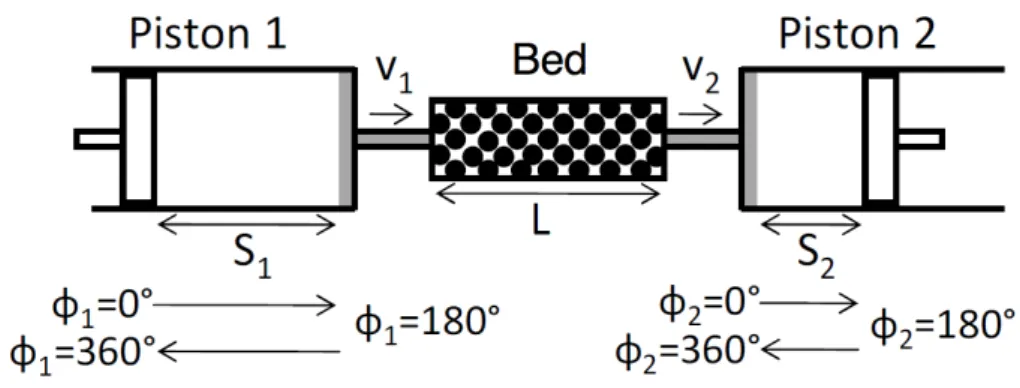
for evaluation by the detailed PSA model. Red lines represents active CPU usage, whereas blue lines represents idle CPU. . . 95 4.9 Dual-Piston PSA System . . . 97 4.10 Pathwalk along a hyperline segment between two random distant points in the
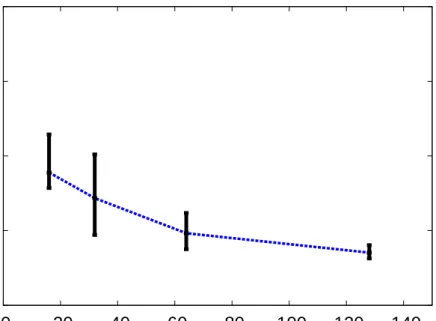
six-dimensional design spaceXD. . . 103 4.11 Kriging as an approximation for the DP-PSA model. The RMSE
approxima-tion error (4.21) is displayed with error bars based on averages over 10 sets of training data of sizes 16, 32, 64 and 128. . . 103 4.12 Computational results with GA, SbGA and EGO . . . 105
List of Figures 11
4.13 Parallel coordinate system for visualisation of the most promising design solu-tions obtained when using SbGA. The best solution is displayed for the initial design and some selected iterations, as well as an overkill solution (89.5%Purity).106 4.14 RadViz visualization for the design points explored for the different approaches:
SbGA (black), EGO (blue), GA (red), and best solution (green). . . 106 4.15 parallel coordinate system for the design solutions obtained using SbGA, when
100 design points have been explored. The solutions from the five different initial data sets (of size 16) are presented. Moreover, the best solution found (89.5%Purity) is included for comparison. . . 107
5.1 Schematic of a 2-bed/4-step PSA. The process steps are: feed pressurisation (FP), feed (F), countercurrent depressurisation (CnD), and light reflux (LR). . . 111 5.2 From the Pareto front computed with NSGA-II on the Kriging model (Top),
the solutions that also are non-dominated by the Pareto set of the current set of PSA simulation responses (Bottom) are considered to be promising candidates for design point selection. . . 114 5.3 An illustrative example of Deb’s constraint handling, where a set of ten design
points is sorted with the aim to maximise the product purity, while the product recovery is specified as an inequality constraint (recovery>90%). . . 116 5.4 Standard deviation estimate with Kriging over the design space for Branin
function. The design sites are marked in green. The correlation lengths are ξ= (0.37,1.46)T, withτ = 10−11. Left: ALM. Right: ALC. . . 118 5.5 Top: The Pareto front approximation generated by responses from the
Krig-ing predictor. Bottom: The Pareto front approximation generated by the transformed-Kriging. This illustates the benefit of using Kriging in the trans-formed space when performing multi-objective PSA optimisation, when there are physical constraints for any of the objective functions. . . 121 6.1 2-bed/6-step PSA Skarstrom Cycle . . . 125 6.2 Pathwalk along a hyperline segment in the design space for the product purity. . 135 6.3 NRMSE for the Kriging model to training data for product purity, recovery, and
power consumption calculated using the detailed PSA simulator. The error bars represent the variability over ten sets of training data (min-mean-max). . . 136
6.4 2D example of a Smolyak sparse gridω= 4using Gauss-Legendre points . . . 142 6.5 Error convergence for the total effects forx1 andx2 on the Ishigami test
func-tion, a typical benchmark in global sensitivity analysis. Left: ST1 and Right: ST2. . . 143 6.6 Total effects calculated with Sobol’ indices for each of the six design variables
(given as averages over 5 different training data of sizes 32, 64, and 128) on the quantities of interest via the Kriging model. . . 144 6.7 Total effects calculated with Sobol’ indices (given as averages over 5 different
training data of sizes 32, 64, and 128) via the Kriging model for the product purity, with all the correlation parametersξj set to2 (Left). This reveals that still these total sensitivity measures under isotropic correlation structure (Left) are similar to those obtained in the anisotropic case where the correlation pa-rametersξwere the MLE esimates (Right). . . 145 6.8 The use of the real-coded GA on CO2 purity in the product, with and without
the use of a Kriging model. . . 147 6.9 Comparison of real-coded GA-Ch and the SbGA-Ch-ALM, both using Deb’s
constraint handling. . . 148 6.10 Comparison of different strategies for solving the CO2purity vs recovery
prob-lem: Top left: 64 points, right: 96. Bottom left: 176, right: 256. The results for each strategy is the collection of their Pareto fronts from five different initial training data. . . 149 6.11 MOEGO and SbNSGA-ALM for the purity-recovery, that started with the same
initial training data of size 16. . . 150 6.12 A simple optimisation problem (not the PSA problem) to illustrate the effect
of the correlation parameter choice,ξ = (1,1)T (Top) andξ = (70.7,70.7)T (Bottom), on the MOEGO performance. The intial training data consists of 10initial evaluations (design solutions), and10additional selected sequentially with MOEGO. . . 150 6.13 Purity vs Recovery: Comparison of NSGA-II, using 1600 design points, and
SbNSGAII, as well as SbNSGAII-ALM, are using 336 design points. The re-sults presented are the five Pareto fronts produced from using five different starting training data. . . 151
List of Figures 13
6.14 The correlation between the system’s power consumption andmin{ypurity(x), yrecovery(x)}. The design solutions are from a single NSGAII run (1600 design solutions). . . 152 6.15 Purity vs Recovery: Comparison of NSGAII utilizing a budget of 1600 design
points, and SbNSGAII, as well as SbNSGAII-ALM, a budget of 336 design points. The results presented are all the evaluations explored by the strategies. The power consumption per mole is also represented by the color of the Pareto front. . . 152 6.16 Pareto front divided into segments (Top Left) defined by different colours.
Rad-Viz (Top Right) and the parallel coordinates (Bottom) visualisation together show that the design solutions associated with different Pareto front segments are clustered. . . 154 6.17 Sensitivity analysis using scatter plots for results obtained with SbNSGAII for
three objectives, using800design solutions. . . 155 6.18 Optimised with the Pareto approach for three objectives: product purity,
re-covery, and power consumption. The results are the Pareto front approximation presented as a scatter plot for SbNSGAII-ALM (Top) with336points, and orig-inal NSGA-II (Bottom) with1600points. The dark grey points are the solutions satisfying product purity>70%, and recovery>85%. . . 156
4.1 The model equations related to the pistons. . . 98
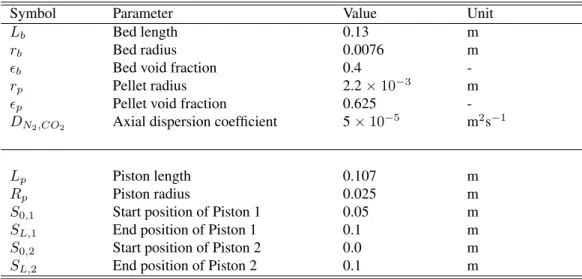
4.2 Adsorption bed and piston parameters for the DP-PSA unit. . . 100
4.3 Decision variables for the DP-PSA optimisation problem. . . 100
4.4 CPU time for Kriging construction for DP-PSA case study, using training data of size m with six-dimensional data points. The CPU time is presented as averages over five runs. . . 104
4.5 Optimisation results for DP-PSA case study . . . 105
6.1 Stem positions for the valves amounting to the different steps. The numbers represent the fraction of the corresponding valve which is open. . . 126
6.2 System parameters for the PSA unit. . . 126
6.3 The model equations for the modelling of the adsorption bed. . . 128
6.4 Nomenclature . . . 129
6.5 Design variables for the PSA design problem. . . 131
6.6 The computation of the total effects of the design variables, see Eq. (6.30), on the Kriging model, with gPC expansion on sparse grids. The Kriging model is applied for the product purity, and used a training data set of size128. . . 144
Chapter 1
Introduction
Pressure swing adsorption (PSA) is a gas separation technique that has been studied for sev-eral decades, and can be seen as a cost-effective alternative to more traditional gas separation techniques, such as absorption. PSA has more recently emerged as a promising technique for separating out CO2 from flue gas, and therefore of interest to Carbon Capture and Storage
(CCS). PSA processes offer much flexibility in terms of process design, and have been shown to be promising for a wide range of applications. PSA units have already been installed world-wide, as home medical oxygen generators and air brake drying systems, but also for industrial hydrogen purification and air fractionation. Because of the complex nature of PSA processes, and the wide range of design possibilities, computer experiments are typically used to emulate PSA processes. To design PSA systems has been shown to be a challenging problem, mainly because the computer simulations are computationally expensive to run. There is a need for more efficient optimisation routines that can handle the design problem, especially for large-scale industrial applications. The application of interest in this study is carbon capture in power plants. In this chapter we provide the motivation for our work, and the scope. The final section will present the outline of this thesis.
1.1
Carbon Capture and Storage
There has been an increased interest in understanding the impacts of climate change and global warming, which have been observed over the past century. The scientific consensus is that global warming is due to the greenhouse effect, which is an effect intensified by the ever in-creasing global CO2emissions. Fossil-fuel power plants are accountable for approximitely one
third of the total CO2emitted from man-made sources [AT05]. To achieve a satisfactory level of
from the power plants. A possible mid-term goal could be to make better use of fuel in power generation and transportation, whereas the long-term challenge is to instead use alternative en-ergy sources such as nuclear, solar, and wind power [AT05]. Fossil-fuel based power plants are responsible for 80 % of the global energy supply, with the coal-fired ones supplying as much as 42 % [MIT07, Adm10]. Coal-fired power plants are expected to continue to cover a large portion of the global energy supply for decades to come.
An initiative for achieving the near and mid-term goals is “Carbon Capture and Stor-age” (CCS), a strategy by the internationally joint Intergovernmental Panel on Climate Change (IPCC). The IPCC has been awarded the Nobel Peace Prize for 2007, a recognition “for their efforts to build up and disseminate greater knowledge about man made climate change, and to lay the foundations for the measures that are needed to counteract such change.” CCS is a pro-cess that, as a first step, uses gas separation to extract compressed CO2 of high purity from an
industrial source, followed by transportation of the captured CO2to a geologic storage reservoir
(such as saline formations and oil or gas fields) or an ocean storage, for instance, and finally sequestration for long-term storage and isolation [IPC05]. The Climate Change Act 2008 (c.27) from the Parliament of the United Kingdom, includes a mandate to achieve a reduction in CO2
emissions by at least 80 % for 2050. The baseline for comparison is the emission level recorded in 1990. In 2009 a UK research consortium was formed, under the name Innovative Gas Sepa-rations for Carbon Capture (IGSCC) and funded by the British Research Council EPSRC. The IGSCC aims to develop novel materials and processes for gas separation based on absorption, adsorption and membrane processes for CCS and investigate their capability based on technical performance, energy consumption, economical cost and sustainability. Our work is a part of the IGSCC effort. There are a few CCS technologies that are considered feasible from a scientific perspective. The CCS problem is however not only a scientific problem, it is also an econom-ical one, since one of the criteconom-ical objectives is to find a CCS technology that is economeconom-ically viable. The capture system is required to meet certain economical limitations. According to U.S. Department of Energy, a feasible CCS technology should capture 90 % of the CO2
emis-sions while keeping the resulting increase in electricity cost below 10 to 20 % (depending on CCS type) [oFEoS99]. For CCS the costs associated with the transportation, storage, verifi-cation and monitoring operations have been estimated to represent only one fourth of the total cost, whereas the remaining cost is related to the separation process [FFP+08, ER09].
1.2. CO2capture 17
1.2
CO
2capture
The main challenges for CO2separation techniques are the low concentration of CO2in flue gas,
and the occurrence of contaminant gases (oxygen, water vapour, sulphur oxides, and nitrogen) which makes CO2 separation more difficult and might also lead to degradation of material
and corrosion of equipment. A CO2 capture system can be used for post-combustion,
pre-combustion, or oxy-combustion.
Post-combustion
In post-combustion capture the CO2 is separated from flue gas exiting from the combustion
chamber. The flue gas composition is typically about 74 % N2, 15 % CO2, 7 % H2O, 3 % O2,
and with a small fraction (less than 1%) of other particulates (e.g., SOx, NOx). The exhaust flue gas from the combustion is normally at ambient temperature and atmospheric pressure. In the combustion process, with air as the oxygen source, the following chemical reaction occurs
CxHy+ x+y 4 O2 →Heat+xCO2+ y 2 H2O,
where stoichiometric coefficients x and y depend on the type of fossil fuel.
Pre-combustion
In pre-combustion capture the carbon dioxide is fully or partially separated from the hydrocar-bon fuel gas, e.g. methane or gasified coal, to produce hydrogen-rich fuel gas for hydrogen combustion. Pre-combustion is a gasification process of coal (by partial oxidation reactors or coke oven gas units) that produces syngas, which consists of monoxide (CO), hydrogen (H2),
carbon dioxide (CO2), and water (H2O), along with small amounts of CH4and H2S,
occasion-ally. A CO shift converter is here installed to generate a CO2/H2gas mixture out of a significant
portion of the CO and H2O involved. Much attention has in recent years been towards
pre-combustion capture because of its low capital cost when compared to post-pre-combustion capture [IPC05]. Also, the pre-combustion technology can be used in modern Integrated Gasification Combined Cycle (IGCC) power plants with gasification. For IGCC plants that burn methane the following chemical reactions occur before the CO2separation unit:
2CH4+
1
2O2+H2O ↔5H2+ 2CO (auto thermal reforming reaction), and
The resulting syngas is highly concentrated in CO2 and at a high pressure. Oxy-combustion
The fossil fuel is burned in an oxygen stream that contains little or noN2. Oxy-combustion
capture can be applied to existing PC power plants. A major drawback is that the air separation step before combustion is energy demanding. Oxy-combustion is outside the scope of this work, but we refer the interested reader to [FFP+08, ER09].
Figure 1.1: The diagram, originally published in [FFP+08], illustrates three types of carbon capture systems: post-combustion, pre-combustion, and oxy-combustion.
Discussion
Combustion is a high-temperature process operating in the regime of atmospheric pressure. A barrier to the implementation of post-combustion carbon capture is that the CO2partial pressure
is low in flue gas and much energy is therefore required by the separation process. For pre-combustion, on the other hand, the capture of CO2from fuel gas leads to a significantly higher
CO2partial pressure and hence lower operational cost. The UK government has announced that
they will allocate 1 billion GBP to support a CCS demonstration project of building a fossil-fuel power plant by 2014/15 [fBISB07]. The project plans to build a coal-fired power plant with a post-combustion technology. However, one prerequisite was that the CCS technology adopted should be viable to retrofit to pulverised coal-fired power plants. Post-combustion systems can
1.3. CO2separation techniques 19
be retrofitted to coal-fired power plants, whereas pre-combustion systems cannot. On the other hand pre-combustion is suitable for use in the more recent IGCC plants. In conclusion the post-combustion approach is favored over pre-combustion as a near-term solution, whereas the pre-combustion approach has in recent years been investigated as a long-term option.
1.3
CO
2separation techniques
The choice of separation technique is very much problem-specific. A CO2separation technique
should be capable to deliver high-purity streams of CO2at an acceptable economic cost. There
exists a wide range of applicable commercial technologies for the separation of CO2from
gas-mixtures: absorption into a liquid, adsorption on a solid, membranes, cryogenic liquefaction, or hybrid systems of some of the aforementioned. Even though the focal point of this thesis is pressure swing adsorption (PSA), we will here also present an overview of some alternative techniques, namely absorption and membranes. After that, we will justify the choice of PSA as a feasible option to achieve cost-effective separation of CO2 for post-combustion carbon
capture in power plants.
Absorption separation
Separating CO2from a gas mixture stream (e.g., flue or fuel gas) through absorption is a process
that in principle scrubs CO2from the gas. A necessary property of the solvent is to favourably
dissolve CO2 above the other components in the gas mixture [AT05]. The other components
of the gas mixture are referred to as carrier components. In the succeeding regeneration step the CO2-rich solution is feed into a regeneration column, where the CO2is removed from the
solution and the solvent is regenerated so that it can be reused for a new load of gas mixture. Absorption is best at low temperature and high pressure, whereas regeneration is best under the inverted conditions. The typical pressure level in an absorption process is atmospheric pressure, but could be designed differently to achieve a better performance.
An absorption process can be classified as either “chemical absorption” or “physical ab-sorption.” A chemical absorption process reacts chemically with the gas mixture and is suitable for low pressure applications such as post-combustion, whereas a physical absorption process only reacts physically with the gas and is suitable for high pressure applications given the high partial pressure [ER09]. Physical absorption processes also suffer from fewer issues related to the solvent, such as degradation, compared to chemical absorption. A common chemical liq-uid solvent for CO2 separation is monoethanolamine (MEA), which is regarded as an efficient
option in terms of performance versus economical cost. MEA absorption is among the most promising [AT05]. Although, other options such as adsorption and membrane systems have po-tential of surpassing the performance of MEA absorption, if more efficient and commerciable materials would be developed [AT05]. Other examples of chemical solvents for CO2separation
are diethanolamine (DEA), dissopropanolamine (DIPA), methydiethanolamine (MDEA), digly-colamine (DGA), alkaline liquid, and ammonia. Whereas for physical absorption, no efficient sorbent has been commercialised [FFP+08]. Two examples of sorbents for physical absorption are chilled methanol and glycol ethers [ER09].
Absorption techniques are the most well-established in the industry, in particular for natu-ral gas sweetening and H2 recovery from syngas in the petrochemical industry [AT05, ER09].
In addition, absorption is also established for separating CO2; in chemical process industry,
absorption based separation is used to purify products via the removal of CO2to enforce
pro-cess and final product requirements. There exists a range of solvents with good regeneration attributes, especially MEA absorption displays a high selectivity to CO2along with the capacity
to generate a product stream with CO2concentration above95%[AT05, LKL+09]. Whereas on
the other hand the main disadvantages are solvent degradation [LKL+09];equipment corrosion due to the high level of oxygen concentration; secondary evaporation of amines due to high va-por pressure as amines react with CO2[LKL+09, ER09], and the energy intensive regeneration
[AT05]. A remark, 70-80 % of the operational expense is due to the large temperature change required in transition between the adsorption and regeneration steps [AT05, LKL+09].
Membrane separation
Membrane separation processes are simple to implement, but the development and choice of appropriate membrane are on the other hand challenging. Permeable membranes (see, e.g., [LKL+09]) follow the principle of selective permeation. Permeability is a measure of at what rate a gas component will propagate, and can be interpeted as the reciprocal resistance against mass transfer by the medium, in this case the membrane. The permeability depends on the membrane structure, the nature of the permeant species (size, shape, and polarity), and the interaction between the permeant species and the membrane.
In the permeation process a gas mixture stream is feed onto the membrane surface and gas components with higher permeation rate will pass faster through the membrane than compo-nents with lower permeation rate. The permeation rate depends on the partial pressure differ-ence between each side of the membrane. In most applications the purpose is to allow passage
1.3. CO2separation techniques 21
membrane
driving force
Figure 1.2: Membrane separation.
for a single component through the membrane, while rejecting passage of all other components involved in the gas mixture. There are three types of membranes for gas separation: polymeric, inorganic and biological. Only the first two will be discussed here. Polymeric can be divided into two categories: glassy and rubbery; similarly, inorganic membranes can be classified as either porous or dense.
Membranes are selected that exhibit a high permeation rate for CO2, but a low rate for
the other components involved. Some popular CO2-permeant polymeric membranes for
post-combustion are PolarisTM and PIMs (see, e.g., [BM10, MLWB10]). In practice, polymeric membranes have been the most prominent in industry, for instance applied for purposes such as food and beverage processing, liquid desalination, and gas separation. Inorganic membranes have not been as extensively studied for CO2separation as polymetric membranes, but still have
had some progress [YXF+08]. Examples of inorganic materials for membranes are alumina, carbon, glass, metal, silica, zeolite and zirconia. As discussed in [AT05], the recent interest towards inorganic membranes is a product of the increased use of inorganic membranes for fuel cell and membrane reactor applications. What is specially attractive with inorganic membranes is their thermal and chemical stability [LKL+09]. It could be argued that the best CO2-selective
inorganic membrane candidate to date is the zeolite membrane [LKL+09].
Membrane techniques have the advantages of being simple (no moving parts, compact, easy to operate, control and scale-up), suitable for retrofitting in existing power plants, requiring little maintenance, environmentally friendly, and have a low energy demand since they are based on organic and biological systems and therefore have no phase change [FFP+08]. The
challenges are however the limited development of durable membrane supports of large surface area, “membrane wetting,” the fact that impurities in the gas stream can congest the membranes.
Adsorption separation
Adsorption is a process that attempts to force selected gas molecules in a gas mixture to be trapped close to a solid surface. When a gas molecule is near a solid surface, the molecules in the solid will apply an attractive force on the gas molecule that will reduce its potential energy. As a result the gas molecule density will be greater closer to the surface in the free-gas phase (see Figure 1.3).
Figure 1.3: A simplified illustration of the principles of adsorption, when gas molecules are in close proximity to the solid surface with selectivity towards the molecules.
“Physical adsorption” is when the forces in the interaction between the adsorbing molecule and the surface are weak (van der Waals forces) and the adsorbate and the adsorbent are kept distinct; in contrast to what is known as “chemisorption,” which is when the interaction forces are strong enough for transfer or sharing of electrons between the adsorbate and the adsorbent. In practise most adsorption separation processes rely on physical adsorption [RFK93]. Exam-ples of physical adsorption separation processes are pressure swing adsorption (PSA), vacuum swing adsorption (VSA), and thermal swing adsorption (TSA). Chemisorption on the other hand is regarded as an economically unattractive option because of its observed low capacity in applications.
Pressure swing adsorption
The pressure swing adsorption (PSA) process [RFK93] is a periodic adsorption process and is considered a viable energy and cost-efficient option which can be used for CO2 separation
from flue as well as fuel gas (see, e.g., [AT05, Sir06, HAW08, LKL+09]). PSA processes have been applied for small, medium and large-scale purification and separation applications. As
1.3. CO2separation techniques 23
reported in 2006, at least a few hundred thousand PSA units have been installed world-wide [Sir06], mainly at the small-scale, for example as home medical oxygen generators and air-brake drying systems, but also implemented at medium- and large-scale for H2purification and
air fractionation.
The main characteristic of a PSA process is to “swing” between adsorption and desorption process steps by increasing and decreasing the pressure in the system, respectively. PSA has attracted a lot of attention, as it is considered to be a cost-effective option for medium-scale op-erations [FFB09b]. PSA systems also have the ability to perform regeneration of the adsorbent bed without the need to request an interruption of the process. The vacuum swing adsorption (VSA) process, a type of PSA, has attracted much attention in the industry because of its sim-ple design, low cost, and minimal corrosion and contamination [RFK93]. VSA is operating under mild conditions compared to other types of PSA systems. PSA processes are tradition-ally operated with a pressurised feed, whereas VSA processes are by definition carried out at near-ambient pressure with the gas driven by vacuum control. Another adsorption technique with similar characteristics as VSA/PSA is temperature swing adsorption (TSA). TSA varies the bed temperature in order to swing between the process of adsorption and desorption. The regeneration step from low to high temperature is however more energy demanding and slower compared to the one based on pressure swing. TSA is thus not as attractive as PSA from an economical and productivity perspective.
Adsorption processes allow regeneration to be executed on the fly, the systems can there-fore consist of a series of process steps that either release (desorbe) or capture (adsorbe) the selective components. It is possible to use multiple “beds”, with “interconnections” which al-low gas fal-low between the beds. The wide range of design possibilities of PSA systems has made the design of PSA systems a matter of study [BJF05, ABZ10b].
There are two types of adsorption surfaces: solid adsorbents and porous adsorbents. With the solid adsorbents there are many challenges that need to be addressed for large-scale opera-tions: it requires large volume of adsorbents; it exhibits a rapid decline in adsorption capacity, and there is a need for a regeneration process operated under large temperature swing conditions [LKL+09]. For porous adsorbents, 13X zeolite is currently commercially utilised for removal of CO2 in an air separation process. A drawback with 13X zeolite is that it suffers from
co-adsorption with water, i.e., 13X zeolite in the presence of water will lead to reduced co-adsorption capacity [LKL+09]. In contrast to lab-scale experiments, it is hard to rapidly change pressure
and temperatures in large-scale adsorbent beds, and as pointed out in [LKL+09], it is important to develop and identify regeneration methods with strong suitability for large-scale operation. Also, more studies have to address the impact of gas impurities for the capacity, selectivity, and stability of the adsorption process [LKL+09].
PSA systems are considered to be promising for separation of CO2 in large-scale
opera-tions. Recently there have been studies investigating PSA for both pre- and post-combustion [ABZ10b, ABZ10a].
Discussion
All the techniques presented for separating CO2from gas streams in a power plant setting have
some issues that need to be addressed, or investigated. For example, liquid absorption with MEA may be viewed as the most promising CO2 separation technique in a large-scale power
plant setting [AT05], but this perception is typically based purely on the separation performance, and not in the light of the economic and environmental issues associated with it, which are important factors to consider. The key argument against absorption as a separation option for CO2is its high energy demand. Also, there has been opposition against amine-based absorption,
as it may lead to environmental issues if the amine compounds are not properly contained. Membranes based methods need to prove themselves before being considered for large-scale applications. As seen in this section, there exist several alternative techniques for separation of CO2from flue gas and syngas.
However, only a handful are feasible for CCS, because most do not reach an adequate sep-aration performance, or do not satisfy the requirements for acceptable economic conditions. The use of membranes is an option because of its simple use and low economic cost, but the gas streams in power plants have a very large volumetric flowrate, and there are no commercia-ble membrane materials to date that can withstand such enormous loading. A lot of attention has recently been devoted towards adsorption processes, in particular to PSA. PSA is a very promising technique for CCS, as it is considered to be a cost-efficient option with a technical performance comparable to absorption processes. Even though membrane based separation methods also have received a lot of attention in recent years, PSA is the more likely out of the two to be viable in the near future.
1.4. The operation of PSA cycles 25
1.4
The operation of PSA cycles
In the PSA process, gas enters the adsorbent bed at high pressure (adsorption), and the feed-gas components most preferred by the adsorbent material become adsorbed. The remaining gas mixture not adsorbed passes through the bed and becomes the raffinate (light product). Eventually regeneration needs to be carried out in the bed by lowering the bed pressure so that the heavy gas components, which have been adsorbed, can be removed. This process is called desorption. The gas mixture released from the bed is the heavy product, which can either be removed or used as purge. Bed regeneration requires no interruption or restart of the process. PSA processes are thus continuous and cyclic. For a given system, all cycles are identically configurated and specified in terms of process steps executed in a sequential manner. PSA processes are operating at cyclic steady state (CSS). CSS is the state when the physical conditions at the end of a cycle are identical to those at the beginning of the cycle. To reach CSS from start-up could take hundreds or even thousands of cycles [THW+01, BJF05]. PSA systems typically involve multiple adsorption beds with connecting streams. Common practise is to use the same sequence of steps for all beds but in shifted phase. In a multi-bed system a purge stream can be introduced during the desorption process to enhance regeneration.
1.4.1 Process steps
There are four basic PSA step types: pressurisation, depressurisation, adsorption, and desorp-tion. A pressurisation step is characterised by high-pressure gas entering the bed while not permitting any gas to leave. A depressurisation step is characterised by no gas entering the bed while allowing gas to effuce at one bed end. An adsorption step is characterised by a high-pressure bed suitable for adsorption, with both ingoing and outgoing gas streams. The desorption steps operate in the same fashion as the adsorption step, but at low pressure so that desorption will take place.
A 2-bed/4-step PSA system is shown in Figure 2.1. This exact PSA system was designed by Charles W. Skarstrom in 1960, after which it was named the Skarstrom cycle, and is the earliest account of a PSA system [Ska60]. In the first step of Bed 2 the bed is pressurised with a gas mixture feed at high pressure. The second step is adsorption with a high pressure feed in which the gas mixture enriched in weakly-adsorbed components passes through the bed (light product). A fraction of the light product is channeled into a purge stream for the light reflux step of Bed 1. Bed 2 then performs countercurrent depressurisation in which the pressure within the
FP
F
CnD
LR
Feed Feed Heavy
Product Heavy Product
CnD
LR
FP
F
Light Product Purge Light Product Purge Bed 1 Bed 2 Feed Feed Heavy Product Heavy ProductFigure 1.4: Schematic of 2-bed/4-step PSA system with a first-generation Skarstrom cycle. The steps included are feed pressurisation (FP), feed (F), countercurrent depressurisation (CnD), and light reflux (LR).
bed decreases as the gas mixture in the bed effuse (heavy product). The fourth and final step of the cycle in Bed 2 is desorption with a purge stream from the adsorption step of Bed 1, in which the heavy product is removed. The cycle is then repeated. As both beds have identical cycle configurations, the same process as in Bed 2 also occurs in Bed 1, but in shifted phase.
Here follows a list of process steps covering some of the most used (see, e.g., [RMER08, ABZ10b]): countercurrent depressurisation (CnD); cocurrent depressurisation (CoD); feed pressurisation (FP); feed or adsorption (F); feed plus recycle (F+R); heavy product pressurisa-tion (HPP); heavy reflux (HR); light end equalisapressurisa-tion (LEE); light product pressurisapressurisa-tion (LPP); light reflux (LR); null, delay or idle (N); recycle of the heavy product (R), and recovery (REC). LPP represents the case when the light product from a highly pressurised bed, typically before depressurisation, is utilised to partially pressurise another bed. CnD is depressurisation with the same flow direction as the adsorption flow, whereas CoD is in counter-flow to the adsorp-tion. Pressure equalisation steps are used to conserve energy [CSMM03]. They reuse gas that already is at high pressure in one bed to pressurise low-pressure beds in the system. A remark, the maximal number of equalisation steps that could fit inside a PSA system is equal to the number of beds. The use of pressure equalisation first appeared in [Ber66], using a modified Skarstrom cycle with a pressure equalisation step, and can significant reduce the power
con-1.5. Challenges with PSA design 27
sumption of the system. The null/idle step, which represents the bed in an idle mode (that is, a state awaiting interaction with other beds), is sometimes necessary to include so that the beds are synchronised [MER11]. More sophisticated cycles could be designed with more elaborate bed interconnections. As an example, a 5-bed/11-step PSA system was designed in [JFB04], which included six pressure equalisation steps and one idle step, for an industrial application of PSA forH2bulk separation with H2-N2-CO2-CO-CH4feed gas mixture.
Here follows a few examples of different types of PSA cycles:
• Stripping reflux:A stripping reflux cycle produces an enriched light product and a heavy waste product.
• heavy reflux: In contrast to stripping reflux, a PSA cycle classified as a heavy reflux [Wil82] is characterised by a light waste product of the gas mixture, and an enriched heavy product.
• Duplex reflux[DGH95]: A compromise between a stripping and heavy reflux cycle. It relies on a 2-bed system setup, for which one bed operating at high pressure whilst the other operating at low pressure. This leads to an enriched product at an intermediate pressure for the product streams at both bed ends. The feed stream can also enter at an intermediate position of the bed.
1.5
Challenges with PSA design
There are few important research directions that are persuited for PSA design for carbon capture [BJF05, ABZ10b, DVB12], for example, synthesizing novel adsorbent materials, improving the accuracy of the mathematical models describing PSA processes, developing computationally-efficient simulation and optimisation methods, and putting forward more systematic ways of choosing cycle schedule for specific tasks. The challenges related to synthesizing adsorbents, and improving the mathematical model for PSA processes, are outside the scope of our work. When designing a PSA system we have some design parameters that we are allowed to manip-ulated, such as valve constants, bed pressures, cycle times, bed dimensions, among others. The optimisation procedure will search through the design space of possible design configurations until we find the design that produces the “optimal” PSA system. The performance is often assessed based on some design criterion, for example, the purity of the product, or the system’s power consumption.
PSA cycles.
1.5.1 Design of complex PSA cycles
A PSA cycle is described by the sequence of steps that the beds undergo. It is often assumed that the sequence of process steps to be performed in the PSA cycle is given, but this is not necessarily the case because each step is characterised by the connections between the steps (if open or closed), the feed, and the light and heavy product tanks.
Given the sequence of process steps, the graphical approach by Ritter et al. [MER10, MER11] can be used for complex PSA cycle scheduling. This approach, based on [Chi88], can easily generate and identify all PSA cycle schedules for the given sequence of process steps, under some constraints. This graphical framework divides the total cycle time into a set of unit cells such that the duration of any process step is required to be a multiple of the duration of a single unit cell, that is, a process step occupies one or several unit cells. The approach can generate all possible multi-bed systems with a given sequence of steps, even delay steps will be enforced appropriately to syncronise the beds.
PSA processes are very flexible, and the choice of process steps can be included as part of the cycle scheduling, as in [ABZ10b, ABZ10a], where a two-bed superstructure is proposed for pre- and post-combustion for CO2 capture. In this design framework only two beds are
consid-ered, but that may not be a problem, as we later will see with the unibed approach [KFH+94]. Many PSA schedules can be represented by a 2-bed structure. The 2-bed superstructure does not represent all possible bed interconnections, but many promising designs are likely to be explored. A bed is only allowed to interact with one other bed, no more, and all process steps can be classified as either adsorbing or desorbing. An advantage with this 2-bed superstructure is that the bed process behaviour is variable controlled, which means that only continuous deci-sion variables are present, which avoids the need for mixed-integer programming. Here follows two more strategies worth mentioning. Fiandaca et al. [FFB09a] for multi-bed PSA cycles for CO2capture, where the cycle connections, and the associated valve constants, are generated at
random between the process steps, the feed, and the light and heavy product tanks. In contrast, Nikolic et al. [NKG09] proposed a “state transition network” (STN) graph that describes all possible state transitions in a PSA system. In the STN, “states” are represented by process steps (e.g., found in [MER11]) and “state transitions” are decisions when a change of state should happen. In a STN, an initial state has to be specified, the authors suggest a co- or counter-current pressurisation or pressure equalisation step as the best candidate, in general. The STN
proce-1.6. Problem statement 29
dure is as follows: begin in the initial state, a state transition is then decided by the optimiser in accordance with feasible transitions in the STN graph and under which conditions a transition occurs under the current state. For example, a pressurisation step can only be followed by the adsorption step, whereas the adsorption step can be followed by depressurisation, desorption, pressure equalisation, and others. However, the proposed STN graph does not include all of the most interesting state transitions [Aga10]. All of these strategies for PSA cycle scheduling make assumptions that restrict the search space. They provide a systematic way that can be used to identify viable PSA cycle schedules. The choice of the framework should be driven by the specifics of the problem at hand. Fiandaca et al. [FFB09a] provided the most general framework, but it can turn out to be an inefficient approach if the search space is not restricted enough to avoid excessive search in less interesting parts of the parameter space. Actually, the search space should not be too large, because of the computational expense associated with the simulation of PSA processes. This calls for efficient optimisation methods.
1.6
Problem statement
The focus of this thesis is PSA for post-combustion carbon capture, which is of great interest for the CCS process. We address the computational aspects that currently prohibit large-scale optimisation for PSA design. Although there are optimisation procedures that are considered adaquate for optimisation of PSA cycles, there are more difficult design problems for large-scale industrial applications that need to be addressed. In particular, this work is driven by the realisation that the PSA system is the key component for carbon capture in power plants, and should be assessed computationally as a carbon capture module in a power plant model. The performance will be evaluated online and should be designed while interacting dynamically with the other components of the power plant model. The PSA model is likely the most com-putationally expensive component of the carbon capture power plant model, and an efficient optimisation procedure should be able to take that into consideration.
To adress this, we have developed an optimisation procedure that is robust, and less time-consuming than preceding optimisation methods applied to the PSA optimisation problem. The proposed method relies on the surrogate model known as Kriging [Jon01]. Kriging is used as an approximation model for the simulation outputs (e.g. purity, recovery, and power consump-tion) over the entire search space. We have proposed a Surrogate-based Optimisation (SBO) procedure, where the Kriging has been utilised in various ways to guide the optimiser more
efficiently. Several modifications have been suggested to make the SBO procedure highly ro-bust and useful for constrained optimisation and for multi-objective optimisation. The use of a Kriging surrogate model should be able to signficantly reduce the computational time to run the PSA model, especially if a surrogate model is used to approximate the PSA component in the full power plant model with carbon capture.
The Kriging has been used in the work by Faruque Hasan et al. [HKF+11] for a sim-ple PSA case examsim-ple for CO2 capture, but the implementation is not robust. An alternative
approximation-based optimisation method is given in [ABZ09], using reduced-order modelling (ROM) for hydrogen purification. This method is limited to tight search domains, and the robustness is questionable due to the low-resolution approximation involved. We have also de-veloped a strategy for fast global sensitivity analysis, based on Kriging and polynomial chaos expansion [BBMF13], that can be used for screening design variables before the optimisation.
This new efficient PSA optimisation using surrogate models allows a much larger number of design configurations and adsorbent materials to be investigated, over a wide range of op-erating conditions, which would help in the CCS effort. For demonstration, we have selected two relevant, but also challenging, PSA examples, one is a dual-piston PSA and the other is a 2-bed/6-step PSA. which will show the efficiency of our proposed SBO procedure. This proce-dure can be used with most, if not all, computer simulation strategies currently used for PSA.
Furthermore, the proposed method is also capable of efficiently performing multi-criteria optimisation. Few studies have addressed multi-criteria design for PSA, which for some appli-cations can be a very important design problem.
An efficient implementation can make it possible to run a model plant online and the costs in operation of a power plant with and w/o carbon capture can be compared in an efficient manner. A single model run of a surrogate model typically takes a matter of seconds, or less, whereas a single model run of a rigorous PSA model can take hours, or even days. A model run means the computer simulation of the PSA model for a single design configuration. The use of surrogate models can lead to huge computational savings, which will be explored in this work.
1.7
Objectives of the project and outline of the thesis
In this thesis the main goal is to develop efficient optimisation procedures for challenging PSA design problem formulations, and demonstrate them for PSA design, in the context of CO2
1.7. Objectives of the project and outline of the thesis 31
to the CCS process). Our work has been presented in seven chapters, and the outline of the chapters are as follows:
In Chapter 2, the principles of adsorption are presented, which include adsorption equilib-rium and mass transfer, followed by the mathematical models describing dynamic behaviour of a PSA process. The computer simulation strategies are described, as well as the discretisation of the mathematical models that set the scene for PSA simulation. In Chapter 3 we present the most used optimisation strategies for PSA. The final section presents the main concept of evo-lutionary algorithms which will be used throughout this work. Chapter 4 introduces surrogate modelling, and formally develop a surrogate-based optimisation (SBO) procedure using Krig-ing, given as a step-by-step strategy. Each step of the procedure is discussed in detail, and the goal is to achieve a computationally-efficient optimisation method. Because the PSA simula-tions are computationally expensive, the SBO method attempts to find the global optimum while using as few PSA simulator runs as possible. The Kriging surrogate model is presented, along with some adjustments that improve the numerical stability and predictive quality. Two SBO methods have been proposed, surrogate-based GA and the popular EGO (efficent global opti-misation). The SBO methods are carried out for a dual-piston PSA design study with six design variables varied during the optimisation. The SBO methods and a real-coded GA algorithm are compared against each other. The dual-piston PSA is an interesting system used for testing and characterising adsorbent materials. This is the first design study for a dual-piston PSA system. In Chapter 5 we extend the SBO procedure presented earlier to cases where we have multiple objectives, and expensive design constraints. The procedure is extended to evolutionary multi-objective optimisation (EMO), and to multi-multi-objective efficient global optimisation (MOEGO). The EMO of choice in our work is the popular NSGA-II. In addition, we have taken a technique from active learning, and applied it to sequentially improve the global accuracy of the Kriging model, and in turn the robustness of the SBO because it will promote exploration. A novel modification is also made to the Kriging surrogate model to ensure the physical constraints of the product purity and recovery (since they are ratios) are enforced for the Kriging predictions made. This is, in fact, particularly important for multi-objective optimisation, as illustrated with a few examples. The failed simulation runs are utilised to improve robustness by allowing the SBO methods to learn where the PSA simulator may fail. Chapter 6 illustrates the SBO pro-cedure for multi-criteria design on a challenging 2-bed/4-step PSA Skarstrom system. For the multi-objective problems, the SBO methods are compared to NSGA-II. The SBO procedure is
put to the test over a variety of design problem formulations. This chapter includes the first PSA optimisation study where we have three objectives optimised simultaneously, that is, the product purity, recovery, and power consumption. Finally, we summarise the contributions of this thesis, and discuss directions for future work in Chapter 7.
Chapter 2
Modelling and Simulation of PSA Processes
Pressure swing adsorption (PSA) is a cylic adsorption process suitable for gas separation and purification. In this process, some feed-gas mixture is passed through a bed packed with some adsorbent material. The adsorbent bed is packed with some adsorbent that should preferentially adsorb one or more components of the feed gas, which share similar characteristics, while the remaining gas passes through the bed. This is a complex process where the choice of adsorbent material is a critical factor. Hence, in order to understand the modelling and simulation of ad-sorbent beds, and in the end the design of such systems, it is important to first have an adequate understanding of the adsorption principles. An introduction to the adsorption principles that underpin the adsorption bed process is given in the following section. Then we present math-ematical models that are used to describe the process dynamics involved. The main equations involved are the ones that describe the conservation of mass and energy, pressure profiles, and adsorption kinetics in the adsorbent bed. These models tend to be rigorous, and consist of cou-pled non-linear partial differential equations (PDEs) in space and time, as well as non-linear algebraic equations representing non-isothermal heat effects and adsorption isotherms. Finally, we provide an overview of computational simulation strategies for the solution of PSA models. The computer simulations performed rely on the spatial and temporal discretisation applied to the mathematical system.
2.1
Principles of adsorption
The adsorption forces that may arise between the surface of the adsorbent material and the surrounding gas molecules depend on the interplay between them. In this section the principles of adsorption are explained in order to show the importance of the choice of adsorbent material for PSA. First the three most influential factors for adsorption are described.
Selectivity. An adsorbent is desired to have a high affinity between the adsorbing molecule and the adsorbent surface. This corresponds to a high selectivity. An adsorbent has either equilibrium or kinetic selectivity. The equilibrium selectivity is when the separation depends on the difference in the equilibrium affinities. For equilibrium-selective adsorbents the impact of the mass transfer resistance is significant. Kinetic selectivity on the other hand depends on the difference in adsorption rates. For kinetic-selective adsorbents the kinetic factors are the predominant ones.
Capacity. The larger the surface area of the adsorbent, the higher the adsorption capacity. An adsorbent with low adsorption capacity tends to require a larger, more costly bed.
Physical strength. The degradation of the sorbent causes the adsorbent particles and its capacity to deteriorate over time. The strength mainly depends on the manufacturing of the adsorbents, pretreatment, and material properties.
The pore size influences the characteristics of the adsorbent, for example, the adsorption and desorption rates. The pore size distribution determines the level of resistance an adsorbed molecule needs to overcome to escape the attractive force from the solid surface. In a microp-ore the adsorbed molecule cannot leave the solid surface, even when positioned at the center of the pore. Whereas in mesopores and macropores, adsorbed molecules at the center of the pore are considered “free” as they experience little or no attractive force. Macropores have a con-siderably smaller surface area than the full pore volume, which allows the adsorbed molecules to penetrate at the center of the pore into the interior. Pores are often classified according to their size [Bur76]: micropores with diameters< 2 nm; mescopores with between 2 and 50 nm, and macropores >50 nm. For homogeneous adsorbents, the pore structure is the same throughout the entire particle, and therefore the pore size distribution is unimodal. For com-posite adsorbents, the structure is non-homogeneous, and a clustering of microporous particles often tends to bind together. The non-homogeneous structure yields a bimodal pore size dis-tribution where micropores within the particles connected through the macropores within the pellet. In equilibrium-controlled adsorption a wide pore size distribution could be acceptable; as opposed to kinetic-controlled adsorption which uses a narrow distribution of pore size as the selectivity mainly depends on steric hindrance and less on material properties. Several tech-niques to achieve control over the pore size are discussed in the book [RFK93], e.g., enforcing ion exhange and silanation. The layer of adsorbed molecules at the solid surface may be seen as a single thermodynamic phase.
2.1. Principles of adsorption 35
2.1.1 Adsorption equilibrium
The state of equilibrium between the gas phase and the adsorbed layer phase at the surface and the convergence towards equilibrium are described by the laws of thermodynamics. Physical adsorption is an exothermic process; thus adsorption is favorable at low temperature, in con-trast to desorption which is favorable at high temperature. At low concentration the adsorption equilibrium relationship could be described in a linear form by Henry’s Law:
q =Kcorq=K0p. (2.1)
Here K (and K0) is the Henry constant; q is the amount adsorbed; p is the pressure, and c
is the concentration of the sorbate in the fluid phase. The temperature-dependent relationship between the Henry constant and adsorption equilibrium could be described by the van’t Hoff equation: K0=K00exp −∆H RgT , andK =K0exp −∆U RgT , (2.2)
where T is the temperature; ∆H = ∆U −RgT is the total energy change on adsorption, andRg is the universal gas constant. At high concentration levels the adsorption equilibrium relationship exhibits nonlinearity, making the linear Henry’s law not ideal.
An adsorption isotherm describes the equilibrium of the sorption at the solid surface at constant temperature. Isotherm models depend on the type of underlying sorption. Brunauer’s classification [Rut84] divides isotherms into five classes of isotherm curve shapes. See below for a selection of popular adsorption isotherm models:
• Langmuir isotherm: q∗ qs = b c−1+b (2.3) • Freundlich isotherm: q∗ =bcα−1 (2.4) • Langmuir-Freundlich isotherm: q∗ qs = b c−α−1 +b (2.5)
• The extended Langmuir isotherm (for multicomponent sorption): q∗i qs = bipi 1 +PNc j=1bjpj (2.6)
• The loading ratio correlation (LRC) isotherm:
qi∗ qs = bip α−i1 i 1 +PNc j=1bjp α−j1 j (2.7)
whereαi, αj >0are correction factors,Nc the number of components, andiandjare
the component numbers.
Hereq∗is the saturated limit to the amount adsorbedq, andpjis the partial pressure for compo-nentj. To account for the effects of non-isothermality, the equilibrium constants are typically temperature dependent. For example, the Langmuir isotherm constant, b, can depend on the temperature as follows: b=b0exp −∆H RgT (2.8) The Langmuir model has shown to be a good fit for isotherms for many adsorption re-lated applications [RFK93]. Moreover, the Langmuir model is consistent with Henry’s law in the low-concentration regime. Langmuir-Freundlich isotherm is a good fit in the high-concentration regime, but becomes less reliable in the so-called “Henry’s law” regime. Freundlich-based isotherms have correction parameters that provide more degrees of freedom in their parametrization.
2.1.2 Mass transfer and diffusion in adsorbents
The resistance to mass transfer is different in homogeneous and composite adsorbents because of their differences in pore structure. In a composite adsorpent there are three kinds of resistance to mass transfer: external film resistance, macropore diffusion, and micropore diffusion.
External fluid film resistance. The external fluid film encircle the adsorption pellet and causes resistance to mass transfer. Although the external film resistance is recognised as a contributer to the overall resistance, it is often negligible when compared to the internal diffusional resistances.
Macropore diffusion.The mass transfer resistance appearing as a result of macropore diffu-sion depends on the ratio between the diameter of the pores and the mean free path. When the
2.2. Mathematical modelling of adsorption beds 37
pores have a diameter considerably larger than the mean free path (1/dpore <0.1[PG97]),
the diffusion in the macropores becomes similar to molecular diffusion. The molecular dif-fusivity is characterised by
Dm ∝
T1.7
p√M, (2.9)
whereDmis the molecular diffusivity, and M is the molecular weight. When on the other hand pores are small (i.e., dl
pore > 10 [PG97]) and at low pressure, the diffusion accounts for the resistance created by collisions between the diffusing molecules and the pore wall, known as Knudsen diffusion. The Knudsen diffusivity [PG97] can be described as
DK = 48.5dpore T M 12 . (2.10)
Heredpore is the diameter of the pore. In the transition region between molecular diffusion
and the Knudsen diffusion, where both are considered important, an effective diffusivity can be calculated by 1 Deff = 1 DK + 1 Dm , (2.11) whereDK, DM >0.
Micropore diffusion. The micropore diffusion is the diffusion in pores with a diameter size of the same magnitude as the one for the diffusing molecule. In micropore diffusion the diffusing molecule is unable to leave the force field of the pore wall. All molecules are in the adsorbed phase, becase in the “small” pores there is no distinction between adsorbed molecules and gaseous molecules in the central region of the pore. This is a big difference to macropore adsorbents. Moreover, the micropore diffusivity is found to vary with the temper-ature as described by the Arrhenius equation
D0=D∞exp − E RgT , (2.12)
whereD0is the corrected diffusivity,D∞is the diffusivity in the limitT → ∞, andEis the
activation energy for the process.
2.2
Mathematical modelling of adsorption beds
Mathematical models for describing adsorption and desorption processes are well-established and are considered to be in good agreement with experiments [RFK93, LHR99]. The full set
of mathematical equations is typically a large, coupled, nonlinear system of equations. See the following list of mathematical equations required to describe processes in fixed-adsorption beds:
• Infra-particle mass transfer model for describing the adsorbate uptake rate by pellets;
• Adsorption equilibrium model;
• A material balance for each component;
• An energy balance for the gas, solid and the adsorbed phase;
• The relation between the pressure drop and the gas velocity (momentum balance). Together these equations form a set of coupled partial differential and algebraic equations (PDAEs). We also need to specify initial conditions for the state, as well as the periodic bound-ary conditions. Besides the governing equations, many models can be differentiated based on the following model choices [RFK93]:
• plug flow or axially dispersed plug flow pattern;
• isothermal or non-isothermal (if accounting for heat effects);
• constant or linear change in fluid velocity along the bed, and
• the pressure drop along the bed (if assuming linear drop).
The remainder of this section will describe the details of the mathematical modelling of PSA processes in fixed-adsorption beds. For more details, we recommend [WL03] and refer-ences therein.
2.2.1 Intra-particle mass transfer model
Here follows a brief account of three commonly used mass transfer models, which describe the resistance to mass transfer occuring in a particle while the gas and adsorbate phase are in local thermal equilibrium (see, e.g.,[AB05, CMM06]): Fickian diffusion model, dusty gas (DG) model, and linear driving force (LDF) model. The models relate the mass transfer rate between the gas and the adsorbate phase to the fluxes in the pores and in the surface. The Fickian diffusion model and the DG model are closely related, for instance, both incorporate the molecular diffusion, Knudsen diffusion, and viscous flux.
Here follows the equations for the intra-particle mass balance in the Fickian model and the DG-model [CMM06]: the intra-particle mass balance for componentican be written as
εp RgT dpi dt +ρs dqi dt =− 1 rs d dt(r s[ pNip+Nis]), (2.13)
2.2. Mathematical modelling of adsorption beds 39
where pi is the partial pressure; q is the amount adsorbed; εp is particle porosity; T is the temperature;Rg is the gas constant; trepresents the time dependency;r is the coordinate of the particle in a spherical coordinate system, andsis the geometry factor (0=slab, 1=cylinder, and 2=sphere). Here the termsNp andNsrepresent the fluxes in the pores and in the surface, respectively. TheNsterm accounts for the surface diffusion flux and is given
![Figure 1.1: The diagram, originally published in [FFP + 08], illustrates three types of carbon capture systems: post-combustion, pre-combustion, and oxy-combustion.](https://thumb-us.123doks.com/thumbv2/123dok_us/808744.2602260/18.892.230.713.324.725/figure-diagram-originally-published-illustrates-combustion-combustion-combustion.webp)