Business-oriented Analysis of a Social Network of
University Students
Informative value of individual and relational data compared through group detection
Vincent Labatut
Computer Science Department Galatasaray University Istanbul, Turkey [email protected]
Jean-Michel Balasque
Business Department Galatasaray University Istanbul, Turkey [email protected]Abstract— Despites the great interest caused by social networks in Business Science, their analysis is rarely performed both in a global and systematic way in this field: most authors focus on parts of the studied network, or on a few nodes considered individually. This could be explained by the fact that practical extraction of social networks is a difficult and costly task, since the specific relational data it requires are often difficult to access and thereby expensive. One may ask if equivalent information could be extracted from less expensive individual data, i.e. data concerning single individuals instead of several ones. In this work, we try to tackle this problem through group detection. We gather both types of data from a population of students, and estimate groups separately using individual and relational data, leading to sets of clusters and communities, respectively. We found out there is no strong overlapping between them, meaning both types of data do not convey the same information in this specific context, and can therefore be considered as complementary. However, a link, even if weak, exists and appears when we identify the most discriminant attributes relatively to the communities. Implications in Business Science include community prediction using individual data.
Keywords-Social Networks; Business Science; Cluster Analysis; Community Detection; Community Comparison; Individual Data; Relational Data
I. INTRODUCTION
Bringing new insights in decision-making analysis, social networks have raised a great interest in the scientific community. In Marketing Science, and more generally in all the fields of Business Science, the concept strength can be seen at different levels [1]. First, locally, by taking into account the interaction between a person and his precise relational context, it constitutes a good tool to better understand individual decisions. Second, at the level of a whole system, it provides a meaningful analysis basis and offers the necessary information to improve both global organization and individual activities management. In Business sciences, the main point in both research and practice has been the possible benefits a person or a firm can get from social networks. Consequently, their analysis has been considered primarily in a utilitarian perspective, with a particular emphasis on their impact on the nature and efficiency of information dissemination. Their role was noticeably studied in the context of competitiveness in the
construction sector [2], firm innovativeness [3], investors attraction for venture capital [4], effective use of their social capital [5] in the labor market [6], and administrative boards decision [7], among others. In Marketing Science, the focus has been put more on speed of information diffusion, with a major interest in word-of-mouth [8], changes of opinions and adoption of innovations inside groups of people (mainly consumers and potential consumers) [9-11] or diffusion of specific products [12].
In most of these studies, the analysis is centered on a single or a few persons, and consists in studying their most immediate connections in much detail. Even if the investigation concerns a whole social system (group or firm), the focus remains local. Some works study the role these individuals of interest have in the network. Other works analyze the possible effects of the social network on these individuals, and generalize the resulting observations to the rest of the network, or to some subgroups of persons. This approach can be criticized in several ways. First, influence processes within social networks vary considerably depending on the nature, structure and strength of the links that connect the considered persons. For instance, Steyer et al. [10] showed the efficiency of information dissemination processes, used for viral marketing, depends on the whole network structure. Van der Merwe [11] described its effect on the role of opinion leaders. According to various authors [13, 14], both opinion spreading and speed of innovation adoption depend on the considered network structure and density. Second, the interest of adopting a non-local approach is backed by several Marketing studies like [15], which, following a stream of Sociology studies, emphasized the necessity of taking sub-networks or cliques into account. These structures diffuse information faster: people belonging to them are more quickly and more deeply influenced, they rapidly adopt new products. So, from a managerial point of view, they are of higher interest. In the context of complex networks, this naturally leads to the notion of community, i.e. a group of nodes with denser relationships, compared to the rest of the network.
Burt [16] and Perry-Smith [17] showed structural holes improve the emergence of new ideas. In their analysis of firm innovativeness, Simon and Tellier [3] differentiated two kinds
hal-00633643, version 1 - 19 Oct 2011
Author manuscript, published in "International Conference on Advances in Social Networks Analysis and Mining (ASONAM), Odense : Denmark (2010)" DOI : 10.1109/ASONAM.2010.15
of innovativeness: exploitation and exploration. They showed groups with denser inner-connections were more efficient to diffuse ideas, but rupture innovations were less likely to happen in those parts of the firm. These denser groups can also be seen by people as stressful areas which constrain them too much, preventing any behavior opposed to the dominant one. In this context, people sometimes rely on persons not belonging to their community [18] or weakly connected [19]. Then, detecting communities can also, by contrast, reveal the zones of lower link density, or structural holes. It additionally allows a deeper study of the network structure by performing a centrality analysis. Indeed, people located in-between communities often play specific roles because of their central position [20]. Interestingly, this last point brings us back to the local approach, illustrating how complementary they are: a global approach can be used to locate persons of interest, which can then be studied more attentively.
Besides this complementary nature and the fact a global approach seems necessary to improve our understanding of social networks and their effects, it is rarely adopted in the fields of Marketing and Business Sciences. Moreover, when it is the case, authors generally do not use a systematic method. For instance, the works cited in the previous paragraphs [3, 17] do not use a precise definition of the concept of community and do not intend to identify all communities present in the studied network. We see two possible reasons for this. First, this kind of analysis is computationally far more demanding than local approaches. It relies on relatively new tools (both theoretically and practically speaking), making intensive use of modern computers. Because of this novelty, they do not have penetrated Business Science deeply yet. Second, and more importantly, practical extraction of social networks is a difficult and costly task [21, 22], because the information it requires is often difficult to access and thereby expensive.
Let us consider data according to two axes: the cost axis and the individual vs. relational axis. In the latter, individual refers to data describing only one person, whereas relational points out data concerning two (or more) persons. On the first axis, we can distinguish three kinds of data, differing both by the nature of the information they convey and on how difficult and costly they are to obtain. First, factual information is the most easily accessible; it corresponds to acknowledged, generally publicly available, facts. For individual data, we can cite for example social status, gender, age, etc. For relational data, it can take the form of communication streams such as email exchanges, lists of collaborations, etc. Second, what we call behavioral information can either result from observations or be obtained directly by interrogating the persons of interest. For individual data, it describes how some person reacts to a given situation, whereas for relational data, the concern will be put on interactions between people, for instance by measuring the time workers spend together in a firm. Third, sentimental information is related to feelings and thoughts. It is the most difficult to retrieve, since it cannot be accessed in other way than more or less direct questions. For individual data, it is for instance brands representations, firm image or products preferences. For relational data it corresponds to feelings (friendship, love, hate, admiration…) people have for each other. Sentimental relational data can be recovered through
questions of the sociometric form, where each person is asked to list his acquaintances and to quantify the strength and orientation of their relationships. This so-called sociometric approach is considered to be both the most efficient, in terms of quality of the retrieved relationships, and the most difficult to apply [21]. Extracting a social network requires relational data, which is globally more difficult and costly to gather than individual data [23]. Indeed, most available factual data focus on single persons (resumes, archives, surveys…), observing interactions in a whole population obviously requires more resources than concentrating on a single individual, and making people speak about others is an even more sensitive task than making them reveal personal details.
From this data-related difficulty regarding social networks extraction, a question arises: can the information conveyed by social networks be retrieved by other, less expensive, means? In this work, we try to tackle this issue through the angle of community detection. We analyze data coming from a survey conducted in a population of university students. Its questions targeted both relational data, with a sociometric approach, and individual data, including factual, behavioral and sentimental-centered questions. From the relational data, we extract a social network, in which we detect communities. In parallel, we apply a classic cluster analysis on individual data, in order to obtain clusters of students. The comparison of individual and relational information is performed through an analysis of similarities and differences between the two kinds of groups. We additionally tackle the problem of community composition by analyzing them in terms of individual data. In this article, we present only the first stage of our work, in which we restrict our analysis to factual individual data only, ignoring behavioral and sentimental individual data for now, for several reasons. First, according to our data typology, it is diametrically opposed to the sociometric approach used to build our social network (inexpensive individual vs. expensive relational data), and should therefore lead to contrasted results. Second, these data do not need any pre-processing and are straightforward to interpret. We hence hope to be able to determine if some attributes are more important than others in the composition of communities. This is important from a managerial perspective, because it is related to the mechanisms leading to the observed communities and would allow predicting community membership without requiring the costly process of relational data collection.
This article is organized as follow. In section two, we describe the survey we set to collect data, focusing on the parts used in the present work. We also give a short description of the tools used to analyze them: community detection, cluster analysis, and discriminant analysis. In section three, we present our results and compare the groups estimated on relational and individual data. We propose some arguments to explain how communities are related to individual information, and elaborate a discriminant model for student community membership. In the last section, we highlight the original points of our study, discuss its limitations and explain how it can be continued.
II. METHODS
We conducted two different analyses. The first is a comparison of groups estimated independently from the individual and relational data, resulting in so-called clusters and communities, respectively. The second is a study of the communities composition in terms of individual factual data. In this section, we describe first how we gathered the data, and which part of them was used in this study. We then present the methods used to estimate and compare groups of students. Finally, we briefly describe the discriminant analysis approach applied to study community composition.
A. Data Collection
The Galatasaray University (GSU) is a small Turkish public institution of about 2000 students, located in Istanbul, near the Bosphorus. It offers a wide variety of courses (sociology, economics, international studies, management, philosophy, computer science, engineering, law…) taught mainly in French. In Turkey, students enter universities after having passed a national competitive examination called ÖSS. The ranking they get at this occasion is very important, because it has a direct effect on the set of universities and departments they can choose to study in. The GSU is one of the top universities in several fields, and as such it attracts students with very high rankings. For most students, the name of the university itself is more important than the actual standard of the department they are going to enter. This particular university can also recruit students directly from Turkish French-speaking high schools, thanks to a specific internal examination. Approximately two thirds of the students are undergraduates and will get a Lisans (i.e. License, or BS) diploma, the rest being Master and PhD students. Each department has a promotion of about 30 students per level. Community and cultural life is highly developed; the university counts forty sports clubs or cultural associations. There is a very strong feeling of belonging to a group, enhanced by the fact the name Galatasaray also refers to a prestigious high school, a popular association football club, and various other cultural and sporting structures. After the university, very strong ties remain between GSU alumni, which usually help each other professionally.
In this context, we have conducted a study on the social network of current GSU students. A university can be considered as a relatively close system for students, in the sense most of their friends also belong to it, making it an appropriate field of investigation. Accordingly to the previous description, this seems to be particularly true for the GSU. Our study is based on a survey taking place at several periods, in order to be able to study some of the network dynamics. The results presented here are limited to data obtained during the first phase of the overall research project, which took place during spring 2009 and involved 224 respondents mainly at the Lisans level. We designed a questionnaire focusing on social and personal attributes, social interactions (especially in the daily university environment), purchasing behavior and favorite brands. The questions can be distributed into three different thematic parts, although this separation does not appear in the questionnaire, voluntarily. The first one concerns factual data: age, gender, clubs or associations membership, school situation, previous high-school. The second part focuses
on the student’s behavior relatively to his friends: nature of the communication means he uses (cell phone, Facebook, Skype...); and also concerning his shopping habits, information sources, buying behavior. The third part concerns his feelings about the university, his vision of his relationships with his friends, his desires, goals and favorite brands. All questions were designed to gather individual data, i.e. information limited to the student himself, except one, which was dedicated to relational data, i.e. data involving two students. We adopted a classic sociometric approach, consisting in asking the student to name the peers he finds the most important in his everyday life, and to quantify these relationships on a scale ranging from –5 (hate) to +5 (love). A website was created to gather the responses. Part of the required information was very personal and sensitive, so a specific procedure was set to guarantee perfect anonymity, replacing all names by meaningless codes.
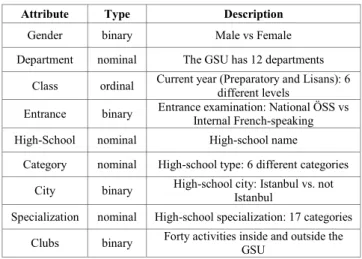
As stated before, in this work, we focus only on a part of the gathered data. First, the relational data (sociometric question) are used to build the social network, which, in turn, is used to identify communities. In this first study, we chose to analyze a simple network, i.e. containing undirected and unweighted links, for interpretation reasons and because all the well-proven community detection tools are dedicated to this type of networks. For this purpose, we ignored the strength and orientation of the relationships when we extracted the network. In other terms, a bilateral link is present between two network nodes when at least one of the considered students cited the other, or both cited each other. Consequently, the network contains more nodes (552) than we had respondents (224), since some cited persons did not answer during this phase of the survey. Second, factual individual data was used to estimate clusters of students, in order to be subsequently compared to communities. The complete list of factual individual attributes is given in table I. In the rest of the document, we will refer to these data simply as the attributes.
TABLE I. FACTUAL INDIVIDUAL ATTRIBUTES USED FOR BOTH CLUSTERING AND DISCRIMINANT ANALYSES
Attribute Type Description
Gender binary Male vs Female Department nominal The GSU has 12 departments
Class ordinal Current year (Preparatory and Lisans): 6 different levels Entrance binary Entrance examination: National ÖSS vs Internal French-speaking High-School nominal High-school name
Category nominal High-school type: 6 different categories City binary High-school city: Istanbul vs. not Istanbul Specialization nominal High-school specialization: 17 categories
Clubs binary Forty activities inside and outside the GSU
B. Groups Identification
We performed the clustering analysis using the Two-Step tool available in PASW 18 (SPSS Inc.). It is an implementation of a classic algorithm [24], able of processing both numeric and nominal data, which was our case. This implementation
optimizes a probabilistic criterion (AIC or BIC) to reduce the intra-cluster distance and increase the inter-cluster one. Different distance functions are available, log-likelihood or Euclidean distance; the log-likelihood has to be used when applied to nominal data. Unlike many clustering algorithms, this one is not hierarchical, so the clusters estimated at step k are not necessarily contained in those from step k+1 or k–1. This implementation is designed to estimate automatically the optimal number of clusters in terms of the selected probabilistic criterion. We applied Two-Step to all possible combinations of factual individual attributes, in order to get a wide range of partitions and be able to select the optimal one.
To identify network communities, we used a set of recent algorithms. Unlike for cluster analysis, there is no difficulty to select data here, since these algorithms can only be applied to the network extracted from the relational data. We chose to apply several algorithms in order to ensure community stability. Fast Greedy [25] is a hierarchical agglomerative algorithm relying on a greedy approach to optimize a network-specific criterion called modularity. Walktrap [26] is also a hierarchical agglomerative algorithm, but it uses a random walk-based definition of inter-node distance to identify communities. Edge-betweenness [27] is a hierarchical divisive approach based on a link centrality measure: it iteratively removes the most central links to discover the communities. Spinglass [28] is another method optimizing modularity, relying on an analogy between the statistical mechanics of complex networks and physical spin glass models. Modularity is a measure defined by Newman [25] to estimate the quality of a network partition. Its theoretical maximum value is one, but in practice, it is related to the network structure, and cannot be reached in all networks. When considering real-world networks, partitions whose modularity is at least 0.7 are considered to be very good [29, 30]. Modularity is also used in Fast Greedy Walktrap and Edge-betweenness to select the best cut in the generated hierarchy of partitions, and therefore determine the optimal number of communities. All four algorithms are available in the iGraph library [31].
To compare the groups estimated by the previously described approaches, we chose the adjusted Rand index (ARI), which is widely used to measure similarity between partitions of a given dataset. The original Rand index (RI) [32] is defined as RI=(a+d)/(a+b+c+d), where a (resp. d) corresponds to the number of pairs whose elements belong to the same (resp. different) group(s) in both partitions, and b (resp. c) to the number of pairs whose elements belong to the same group in the first (resp. second) partition, whereas they belong to different groups in the second (resp. first) one. The adjusted version [33] is defined as ARI=(RI–E)/(1–E), where E is the amount of similarity expected to be due to chance. The upper limit of this measure is 1 (the two partitions are exactly the same). The value 0 indicates a partial overlap, equivalent to
what would be observed if both partitions were random (i.e. RI=E). Negative values indicate a strong divergence between the partitions. The ARI was used first to compare the partitions estimated by the various community detection algorithms, and second to compare these same partitions with those resulting from the Two-Step cluster analysis.
The second part of our analysis consisted in elaborating a model of the composition of communities, on the basis of the attributes. We used the classic discriminant analysis algorithm implemented in PASW 18, which builds a predictive model for group membership, under the form of a set of classification functions. Each function is a linear combination of the attributes providing the highest separation between the reference groups. The model is constructed iteratively, by estimating the functions one-by-one. Each additional function is fitted to improve the overall quality of the model. The process ends when the maximal number of functions is reached (it depends on the number of attributes and groups), or when the model allows to successfully classify some proportion of instances. The model quality can be assessed by using it to process the groups for some instance set, and then comparing these estimations to the actual groups. Compared to other approaches, discriminant analysis has the advantage of explicitly highlighting which attributes are the most important to determine the group membership of an instance. As we stated in the introduction, group membership has an effect on decision making, so the predictive abilities of the model obtained from discriminant analysis has an indisputable interest in the field of Marketing and Business Science.
III. RESULTS AND DISCUSSION
A. Groups Analysis and Comparison
Our presentation of the results follows the approach we presented in section two. First, to identify clusters, we applied Two-Step on all possible combinations of attributes. We obtained the best results using the log-likelihood-based distance and the BIC (Bayesian information criterion) optimization criterion. In most cases, the data could not be discriminated and the process ended up with a single cluster as the optimal partition. This means the respondents’ distribution in the space of considered attributes was too homogeneous, with no areas of higher or lower density to allow clear separation. In other terms, these attributes were not conveying enough information to allow a proper clustering. In a few cases, significant clusters were identified, though. The best results were obtained using three attributes: Gender, Department, and Class, leading to an optimal number of 4 clusters. The fact the quality of the clusters depends strongly on the selected attributes is important, because it shows attributes are not equivalent, and the mentioned ones carry most of the factual individual information.
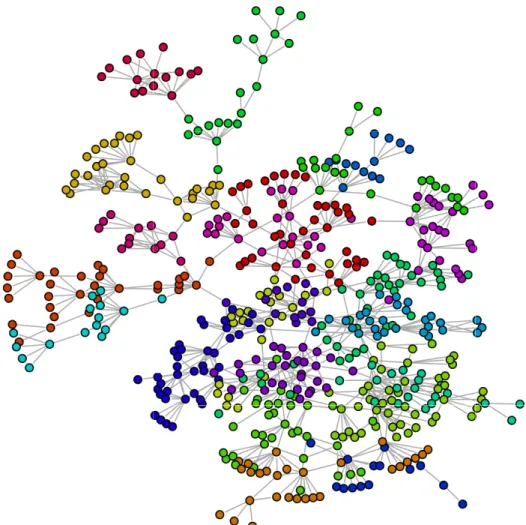
Before performing community detection social network extracted from our relational its isolated nodes. This is a classic proce algorithms consider separated compone communities, leading to many meaningless c such nodes are present. We applied Edge-Greedy, Spinglass and Walktrap to the unwe resulting network. The optimal partitio modularity contain 23, 22, 29 and respectively. The first three algorithms le partitions, with ARI values around 0.75. Walk with ARI values around 0.6 when co algorithms. We can conclude we have a g between most algorithms, and the detected rather stable. Consequently, we decided to partition to be compared with the clusters individual data. We chose the partition e Greedy, represented in fig. 1. Its modularity the highest value over all tested algorithms. F the smallest number of partitions and is th comparable to our 4 clusters.
Our first comparison consisted in consid partitions estimated by Two-Step and Fast G
Figure 1. Communities detected by the Fast Greedy a for this partition is 0.88, i.e. a high value, which has tw
n, we cleaned the data by removing edure, because all
ents as distinct communities when betweenness, Fast eighted undirected ons in terms of 37 communities, ead to very close
ktrap is a bit apart, mpared to other general agreement d communities are o select only one estimated on the estimated by Fast y is 0.88, which is Furthermore, it has herefore the most dering the optimal Greedy. That is, we
compared the previously m communities. The instances distributed in the resulting 4 indicates the partitions overlap confirmed by an ARI value o between the two partitions is obtained by chance. The clus students on the basis of their and Class) do not have meanin The fact individual and rel comparable groups seems to ind of our study, they do not convey In order to confirm this o additional comparisons by forc to form 4 communities and Greedy is a hierarchical straightforward to get only 4 different cut in the hierarchy of the resulting partition has a lo than the previous one (with 22 between these 4 communities Two-Step leads to an even lo could be expected, since the
lgorithm using the relational data. Each color represents a different wo meanings: the network has a communitiy structure and Fast Greed
nodes were discarded for clarity.
mentioned 4 clusters and 22 are more or less uniformly 4×22 confusion matrix, which very poorly. This observation is f 0.043, meaning the similarity very close to what would be sters that separate the best the attributes (Gender, Department ng relatively to the communities. lational data do not lead to dicate that, at least in the context y equivalent information. observation, we performed two cing Fast Greedy and Two-Step 22 clusters, respectively. Fast
approach, so it is rather 4 communities by selecting a f partitions it outputs. Of course, ower modularity (hence quality) 2 communities). The comparison and the 4 optimal clusters from ower ARI value of 0.001. This ese communities correspond to
community. The modularity processed dy managed to identify it well. Isolated
merges of the 22 communities considered at first. Two-Step is not hierarchical, so we had to apply the algorithm again, forcing it this time to estimate 22 clusters.
Unlike Fast Greedy, there is no reason, from the algorithm perspective, for these clusters to be related to the 4 previous ones. Again, we tested all possible combinations of attributes. It is noteworthy that 22 was never the optimal number of clusters, and the obtained partitions had generally poor quality in the sense they did not reach high BIC values. We then compared these partitions with Fast Greedy optimal partition of 22 communities. Most Two-Step partitions had poor ARI values, sometimes even worse than random partition (i.e. negative values). Nevertheless, four partitions led to ARI values significantly different from zero. Table II sums up the attributes used to estimate these clusters, and the ARI value resulting from their comparison with the communities. These values are intermediary, which seems to indicate the individual attributes used during the clustering process contain a part of the information underlying the network community structure. So on the one hand, we were able to use individual data to identify clusters which are relatively close to (or rather: not significantly different from) the communities estimated from relational data. But on the other hand, the corresponding partitions have very low quality when considering how they separate the space of attributes. Moreover, some of the selected attributes are highly correlated (Category, City and Specialization). This seems to confirm our previous observation regarding the difference in the nature of the information conveyed by the individual and relational data.
TABLE II. ADJUSTED RAND INDEX VALUES BETWEEN FOUR 22
CLUSTERS PARTITIONS ESTIMATED BY TWO-STEP, AND THE OPTIMAL FAST
GREEDY PARTITION (ONLY THE PARTITIONS WITH HIGHEST ARIS ARE REPRESENTED)
Considered Attributes ARI
Gender, Department, Class, Entrance, Category, City,
Specialization 0.423 Category, City, Specialization 0.291 Department, Class, Entrance 0.320 Gender, Department, Class, Entrance, Category, City,
Specializarion, Clubs 0.286
In summary, the various comparisons we conducted between the groups estimated by the cluster analysis approach and those identified by the community detection algorithms, generally lead to close to zero ARI values, meaning the overlap between the corresponding partitions is very low. However, in some specific cases, appropriate combinations of attributes resulted in ARI values significantly different from 0. Thus, a link, even if a tenuous one, seems to exist between some individual attributes and the communities derived from the relational data. The highest ARI value was obtained by taking into account a great deal of individual factual data, so this link is far from being obvious. The next step in our study consisted in performing a discriminant analysis to assess in which part the repartition of the students in the different communities is determined by their attributes.
B. Composition of the Communities
For the discriminant analysis, we used the communities as reference groups, in order to elaborate a model which would be able to estimate them, based on certain attributes. All attributes were used, since we opted for an exploratory approach. The selected algorithm automatically detects and discards correlated attributes, which are therefore not a problem here. Community sizes were used to compute the prior membership probabilities.
Only three attributes were found to be significantly discriminant. By order of decreasing significance, they are: the class (year of study in the university), the type of entrance examination (national or internal) and the university department. The other attributes did not convey any additional information useful for the prediction of the communities. The three most explicative attributes are only weakly correlated to each other (with values between −0.241 and 0.009). On their basis, the algorithm estimated a system of three functions, constituting the predictive model. For a given student, this model allows processing his membership probability for any community, the most probable one being considered as its estimated community. The overall comparison between estimated and actual communities gave a 37.2% success rate. This rate is very low, but still significantly different from zero, like the intermediate ARI values found in the previous section when comparing clusters and communities.
The fact the Class and Entrance attributes are more discriminant than the department could be explained by a specificity of the GSU. Students integrating this university come from all parts of Turkey; they have very different skills and levels, both from the academic and linguistic perspectives. In particular, some of them have been speaking French since nursery school, whereas others never practiced this language before entering the GSU. For this reason, before starting the actual Lisans degree, they must follow a preparatory class for one or two years, including an intensive French course. Most students recruited via the national examination do not speak French and have to follow the two-year-long preparation. All students which succeeded in the internal examination speak French and are prepared for only one year. During these preparatory years, all departments are mixed, because students do not follow yet specialized classes, but only French, methodological and common-core classes. We suppose this mixing make students develop cross-departmental relationships more easily. Moreover, this takes place during the first university years, and in a very specific context for many students: they are far from home (Turkey is a large country), and family is very important in the Turkish society. For all these reasons, we think these relationships last even after the end of the preparatory program, when students enter specific departments and are separated from most of their preparatory fellows. The class and entrance attributes are directly linked to the composition of the preparatory study groups, and this may be a reason why they are the most discriminant relatively to the observed student communities. The entrance attribute has additional implications, which can be linked to its observed discriminant power. First, due to their better understanding of the French language, students selected via the internal examination tend to stay together in their Lisans years. More
importantly, most of them come from a small set of French-speaking high-schools with very strong identities. For instance, the Galatasaray high-school (a centuries-old French-speaking public institution dating back to the Ottoman Empire) has a powerful association of alumni, very tightly bound to the diplomatic, political, industrial and business worlds. Finally, a social factor should also be mentioned, since most of these French-speaking high-schools are private and accessible only to middle and upper classes. Their standards of living, aims and preoccupations can be different from students selected through the national examination, some of which comes from very poor backgrounds. The fact is that students recruited through the two different examinations do not mix so much. The third discriminant attribute (Department) was more predictable, because spending daily hours together, working, interacting and sharing the same classroom make people closer and is favorable to the apparition of strong relationships (be it friendship or enmity).
Some factors have surprisingly no influence on the repartition between communities. Gender, which could be supposed to have a central role in student interaction, especially in the case of young persons evolving in a new environment, far from their home and family, does not seem to affect the way communities are formed. In a lesser degree, we expected high-school specialization (mathematics, literature…), and home city to have a noticeable effect. The life in Istanbul is clearly more cosmopolite, liberal, and culturally richer than in most parts of Turkey. For this reason, persons living in Istanbul sometimes have some sort of superior attitude towards people coming from rural environments, which can be aggravated by the differences of social status, and we expected this to appear in the composition of communities.
Of course, the scope of all these comments must be qualified, because they hold only for one third of the students, for which the mentioned discriminant attributes allow correctly predicting the community. For most of the population, we were not able to find a way to match communities and attributes, that is to find a link between the relational and individual data. This goes in the same direction than our results from the group comparisons, i.e. relational and individual data seem to convey different information, at least partially.
IV. CONCLUSION
We gathered data from a population of university students, using a survey. From these data, we retained only the individual factual and relational information, leaving the rest of the individual information for further exploration. We extracted a social network from the relational information, and detected 22 communities thanks to the Fast Greedy algorithm [25]. Each community is characterized by a denser interconnection compared to the rest of the network. In parallel, we applied the Two-Step clustering approach [24] on the individual data, leading to an optimal partition of 4 clusters for the considered students. Note all combinations of attributes were considered during this process. We compared these partitions using the adjusted Rand index (ARI) [33], and find out there was no significant overlapping between them. To our knowledge, this type of comparison was never performed before, at least in the domain of Business Science. We then extended our study by
comparing each optimal partition (clusters and communities) to non-optimal partitions obtained by forcing the number of groups to match the optimal opposite count (4 and 22, respectively). This resulted in close to zero ARI values when the communities were forced to 4, and intermediate values (around 0.3) but essentially poorly separated clusters when these were forced to 22. We concluded that, on these data, the information conveyed by the relational and factual individual data seem to differ significantly, at least in terms of groups of students.
The second part of our analysis aimed at identifying the most discriminant attributes relatively to the communities. For this purpose, we performed a discriminant analysis [24], using the communities as reference groups. We found out the year of study, the type of examination taken to enter the university and the current department were sufficient to correctly predict the community of 37.2% of the respondents. On the one hand, this low rate confirms our observation regarding the limited overlapping between clusters and communities. On the other hand, it can be considered as relatively high, regarding the fact only 3 attributes are used to select one community among 22 possible. Even if it is obvious they do not allow explaining completely how the students are distributed over the communities, we proposed some interpretations regarding why a community can be correctly predicted from these attributes for more than one third of the students. Indeed, being able to predict communities is of utmost interest in the fields of marketing and management. For example, young students are intense consumers of technological products such as mobile phones or MP3 players, or fashion product like clothes, jewels and make-up. Communities are supposed to have a strong effect on the buying process and decision making [12]. Consequently, any mean able to provide more information regarding potential client membership is extremely relevant and worthwhile.
We consider this work as a first step in the analysis of our field results. Consequently, it suffers from some limitations we plan to solve quickly in the forthcoming articles. First, we focused on the factual part of the individual information. The next step will consist in talking into account behavioral and/or sentimental individual data: maybe they convey the information necessary to define clusters exhibiting a better overlap with the communities. Second, we extracted the social network by considering only the presence of relationships between pairs of students: we ignored completely their orientation and strength. Consequently, the social network links are neither directed nor weighted. This first approach was partly constrained by the fact most community detection algorithms work only on this kind of network. This information is extremely important though, and could lead to very different communities, worth comparing with clusters. Another interesting point would be to allow a student to belong to several groups at the same time. But even less community detection algorithms allow this [34], and it also raises difficulties from the cluster analysis perspective.
Our work also suffers structural weaknesses, inherent to the context of the study. First, the survey was conducted in a small institution, with specific characteristics, which makes it difficult to generalize our results to any situation. This problem
could be addressed by performing similar studies in other contexts, and for this purpose we are trying to start collaborations with searchers from other universities. Second, and more importantly, the data we analyzed is far from being complete, since it represents a relatively small part of the total number of students in the GSU. This response rate is normal for such a survey, especially considering the fact students participate on their behalf only. To improve this rate, we conducted our survey again, one semester later (it is currently ongoing). This should both provide additional respondents, and add an interesting dynamic dimension to those who participated to both surveys.
REFERENCES
[1] C. Baret, I. Huault, and T. Picq, "Management et réseaux sociaux: Jeux d'ombres et de lumières sur les organisations," Revue Française de Gestion, vol. 32, pp. 93-106, Apr 2006.
[2] C. Comet, "Productivité et réseaux sociaux: Le cas des entreprises du bâtiment," Revue Française de Gestion, vol. 32, pp. 155-169, Apr 2006. [3] F. Simon and A. Tellier, "Créativité et réseaux sociaux dans
l’organisation ambidextre," Revue française de gestion, vol. 187, pp. 145- 159, 2008.
[4] M. Ferrary, "Apprentissage Collaboratif et réseaux d’investisseurs en capital-risque," Revue Française de Gestion, vol. 163, pp. 171-181, 2006. [5] B. Ranie-Didice, "Capital social des dirigeants et performance des
entreprises," Revue des Sciences de Gestion, vol. 231/232, pp. 131-135, Mai/Juin 2008.
[6] Y. Fondeur and F. Lhermitte, "Réseaux sociaux numériques et marché du travail," Revue de l’Ires, vol. 52, pp. 102-131, 2006.
[7] G. Guieu and P.-X. Meschi, "Conseils d’administrations et réseaux d’administration en Europe," Revue française de gestion, vol. 185, pp. 21-45, 2008.
[8] P. Dwyer, "Measuring the value of electronic word of mouth and its impact in consumer communities," Journal of Interactive Marketing, vol. 21, p. 16, spring 2007.
[9] J. Goldenberg, S. Han, D. R. Lehman, and Hong J.W., "The role of hubs in the adoption process," Journal of Marketing, vol. 73, pp. 1-13, March 2009.
[10] A. Steyer, R. Garcia-Bardidia, and P. Quester, "Modélisation de la structure sociale de groupes de discussion sur Internet: implications pour le contrôle du marketing viral," Recherches et Applications en Marketing,
vol. 22, 2007.
[11] R. van der Merwe and van Heerden G., "Finding and utilising opinion leaders: socail networks and the power of relationships," South Africa Journal of Business Management, vol. 40, pp. 65-73, 2009.
[12] K. Hyunsook, "Comparing fashion process networks and friendship networks in small groups of adolescents," Journal of Fashion Marketing andManagement, vol. 12, pp. 545-564, 2008.
[13] W. R. Hartmann, P. Manchanda, H. Nair, K. Hosanagar, and C. Tucker, "Modeling social interactions : identification, empirical methods and policy implications,," Marketing Letter, pp. 287-304, 2008.
[14] D. C. Watts and P. S. Dodds, "Influentials, networks and public opinion formation,," Journal of Consumer Research, vol. 34, pp. 441-458, December 2007.
[15] D. Iacobucci and N. Hopkins, "Modeling dyadic interactions and networks in marketing," Journal of Marketing Research, vol. 29, pp. 5-20, 1992.
[16] R. Burt, "Structural Holes and Good Ideas," American Journal of Sociology, vol. 110, pp. 349-399, 2004.
[17] J. E. Perry-Smith, "Social yet creative: The role of social relationships in facilitating individual creativity," Academy of Management Journal, vol. 49, pp. 85-101, 2006.
[18] D. Rose, J. Charbonneau, and P. Carrasco, "La constitution de liens faibles: une passerelle pour l'adaptation des immigrantes centro-americaines mères de jeunes enfants a Montréal " Canadian Ethnic Studies, vol. 33, pp. 73-91, 1999.
[19] M. Granovetter, "The Impact of Social Structure on Economic Outcomes," Journal of Economic Perspectives, vol. 19, pp. 33-50, 2005. [20] C. Sureh, G. Srividya, and K. Swetha, "Viral distribution potential based
on active node identification for ad distribution in viral networks," International Journal of Mobile Marketing, pp. 48-56, 2009.
[21] B. Chollet, "L’analyse des réseaux personnels dans les organisations : quelles données utiliser ?," Revue Finance Contrôle Stratégie, vol. 11, pp. 105-130, 2008.
[22] S. Doyle, "The role of social networks in marketing," Journal of Database Marketing & Customer Strategy Management, vol. 15, pp. 60-64, 2007. [23] Y. Evrard, B. Pras, and E. Roux, MARKET: Etudes et recherches en
Marketing, 2000.
[24] T. Zhang, R. Ramakrishnon, and M. Livny, "BIRCH: An efficient data clustering method for very large databases," in ACM SIGMOD Conference on Management of Data Montreal, Canada, 1996, pp. 103-114.
[25] M. E. J. Newman and M. Girvan, "Finding and evaluating community structure in networks," Physical Review E, vol. 69, pp. -, Feb 2004. [26] P. Pons and M. Latapy, "Computing communities in large networks using
random walks," Computer and Information Sciences - Iscis 2005, Proceedings, vol. 3733, pp. 284-293, 2005.
[27] M. Girvan and M. E. J. Newman, "Community structure in social and biological networks," Proceedings of the National Academy of Sciences of the United States of America, vol. 99, pp. 7821-7826, Jun 11 2002. [28] J. Reichardt and S. Bornholdt, "Statistical mechanics of community
detection," Phys. Rev. E, vol. 74, p. 016110, 2006.
[29] M. Tasgin, A. Herdagdelen, and H. Bingol, "Community Detection in Complex Networks Using Genetic Algorithms," arXiv, vol. 0711.0491, 2007.
[30] M. E. J. Newman, "Modularity and community structure in networks," PNAS USA, vol. 103, pp. 8577-8582, 2006.
[31] G. Csardi and T. Nepusz, "The igraph software package for complex network research," InterJournal, vol. 695, 2006.
[32] W. M. Rand, "Objective Criteria for the Evaluation of Clustering Methods," Journal of the American Statistical Association, vol. 66, pp. 846-850, Dec 1971.
[33] L. Hubert and P. Arabie, "Comparing partitions," Journal of Classification, vol. 2, pp. 193-218, 1985.
[34] I. Derenyi, G. Palla, and T. Vicsek, "Clique percolation in random networks," Phys Rev Lett, vol. 94, Apr 29 2005.