University of Nebraska at Omaha
DigitalCommons@UNO
Interdisciplinary Informatics Faculty Proceedings &
Presentations
School of Interdisciplinary Informatics
2011
Evaluation of essential genes in correlation
networks using measures of centrality
Kathryn Dempsey Cooper
University of Nebraska at Omaha, [email protected]
Hesham Ali
University of Nebraska at Omaha, [email protected]
Follow this and additional works at:
https://digitalcommons.unomaha.edu/
interdiscipinformaticsfacproc
Part of the
Genetics and Genomics Commons
, and the
Numerical Analysis and Scientific
Computing Commons
This Conference Proceeding is brought to you for free and open access by the School of Interdisciplinary Informatics at DigitalCommons@UNO. It has been accepted for inclusion in Interdisciplinary Informatics Faculty Proceedings & Presentations by an authorized administrator of DigitalCommons@UNO. For more information, please contact [email protected].
Recommended Citation
Cooper, Kathryn Dempsey and Ali, Hesham, "Evaluation of essential genes in correlation networks using measures of centrality" (2011).Interdisciplinary Informatics Faculty Proceedings & Presentations. 16.
Evaluation of essential genes in Correlation Networks
using Measures of Centrality
Kathryn Dempsey and Hesham Ali
College of Information Science & Technology, University of Nebraska at Omaha Department of Pathology & Microbiology, University of Nebraska Medical Center
Abstract—Correlation networks are emerging as powerful tools for modeling relationships in high-throughput data such as gene expression. Other types of biological networks, such as protein-protein interaction networks, are popular targets of study in network theory, and previous analysis has revealed that network structures identified using graph theoretic techniques often relate to certain biological functions. Structures such as highly connected nodes and groups of nodes have been found to correspond to essential genes and protein complexes, respectively. The correlation network, which measures the level of co-variation of gene expression levels, shares some structural properties with other types of biological networks. We created several correlation networks using publicly available gene expression data, and identified critical groups of nodes using graph theoretic properties used previously in other biological network studies. We found that some measures of network centrality can reveal genes of impact such as essential genes, suggesting that the correlation network can prove to be a powerful tool for modeling gene expression data. In addition, our method highlights the biological impact of nodes a set of high centrality nodes identified by combined measures of centrality to validate the link between structure and function in the notoriously noisy correlation network.
Keywords-Correlation network, centrality, essential genes I. INTRODUCTION
The advent of high-throughput “omics” technologies has created an imminent need for tools that can sort noise from causative mechanisms, essentially gathering knowledge from data. The ability to process large datasets and uncover specific, detailed mechanisms behind observed phenotypical changes has become a type of “holy grail” in systems biology. The complexity and size of available high-throughput data presents a problem whose solution will undoubtedly require an extensively complex solution. The identification of graph theoretical concepts to describe models of cellular systems remains in relative infancy and thus standards are still being established. Our objective is to highlight the usability of correlation networks in the modeling of gene expression data by identifying key network structures within the correlation network.
Application of graph theory to biological network models is rapidly becoming a popular tool for modeling any type of biological relationship. The KEGG pathway data contains hundreds of thousands of experimentally identified protein-protein interactions that describe a protein-protein interaction network (PPI). Mutwil et al. 2010 used a correlation network to identify essential genes in A. thaliana
and verified the essentiality of those nodes with mutagenesis studies. Multiple methods for clustering and partitioning data have been implemented and successfully used to identify clusters of genes in protein-protein interaction networks that work together to produce some function within a cell. Most of the progress made in identifying critical functional mechanisms in networks built from high-throughput data has arisen from connection of function to structures important for network robustness. For example, hub nodes in a PPI represent proteins that interact with many different proteins at a given time or environment. Further, while multiple types of networks have been studied extensively, exploration of many of these concepts in the correlation network has not yet been accomplished.
A correlation network is a graph model built of edges and nodes, where nodes represent genes and a set of sample expression levels for that gene, and an edge represents the level of correlation between the two expression patterns. Different measurements of correlation have been used to build these networks, such as the partial correlation coefficient (Reverter et al. 2008, Watson-Haigh et al. 2010), the Spearman correlation coefficient (Ewens et al. 2005), or more commonly, the Pearson correlation coefficient (Zhang
et al. 2005, Dong et al. 2007, Gill et al. 2010, Mutwil et al.
2010). The network built from a dataset where all nodes (genes) are connected to each other is called a complete network, Kn (where n is equal to the number of nodes/genes
in the network). In Kn network, the number of edges is equal to n(n-1)/2; this implies that in the case of datasets with a large number of genes, analysis of the Kn network is computationally and algorithmically taxing; thus, thresholding is a common method used for network reduction.
There are many methods for thresholding the correlation network. The most straightforward involves removing edges with a low correlation, or removing edges at and around 0.00. As network size increases, this threshold would need to become more stringent to maintain a size of network that can be quickly and properly analyzed. Most studies use a threshold of ±0.70 to ±1.00 based on the fact that the coefficient of determination (also known as variance) for these correlations will be at least 0.49. This determination threshold is chosen to retain genes whose expression levels can be described as approximately 50% dependent on each other’s expression. Carter et al. (2004) used this method of “hard” thresholding by correlation level and additionally used a p-value < 0.0001 threshold to ensure that only significant correlations had been retained.
The ability of the correlation network to capture relationships between gene pairs over time gives the model a distinct advantage over traditional methods of gene expression analysis such as Gene Set Enrichment Analysis [17] which does not focus on expression relationships. However, correlation networks are notorious for having noise or unnecessary edges (Opgen-Rhein et al. 2007) because correlation does not imply causation; additionally, the volume of data to be analyzed remains a problem for users without access to parallel computing resources. We have applied a series of graph theoretic concepts to a number of correlation networks and show that while it is useful to model entire datasets, it is possible to identify a handful of important nodes based on some basic graph properties, as has previously been performed in other biological networks. Extensive studies on measures of centrality in correlation networks have not been performed previously; our research here seeks to examine the biological impact of nodes identified by some common measures of centrality. Due to the high noise nature of the
correlation network, we expect that measures of centrality (specifically degree) are not as reliable for identifying essential genes as has previously been identified in other biological networks. However, if we can identify some optimum thresholds and centrality measures for identifying essential genes in correlation networks, we can better identify a target set of genes for future research. Thus, researchers using a correlation network without appropriate computational resources may still make use of the concepts by focusing on these select sets of important nodes.
II. MODEL
We create and filter our network models using the methods described in 2.1, and validate the structure of our network to match those of other known biological networks, such as degree distribution following a power-law pattern. We then identify critical nodes using some global and local network measures that reveal network structure, and finally elaborate on how biological function changes when we remove those critical nodes.
A. Network Creation
Data for this experiment was obtained from NCBI’s Gene Expression Omnibus (GEO) website (http://www.ncbi.nlm.nih.gov/geo/) in December 2009. Datasets used included were: Series GSE5078 generated by Verbitsky et al. in 2004, and Series GSE5140 generated by
Bender et al. in 2008. GSE5078 is derived from
hippocampal samples of young and middle-aged C57Bl/6 mice (2 months and 15 months, respectively, called YNG and MID). GSE5140 is derived from whole-brain samples of middle-aged C57Bl/6 mice that were either untreated (UNT) or orally supplemented with creatine (CRE). Each dataset was separated into young versus middle-aged, or untreated versus creatine treated, and raw expression values were used. Probes with missing expression values were not used in analysis. Networks were created by pairwise computation of the Pearson Correlation Coefficient (ρ) for each possible pairing of probes within the dataset, in parallel. Correlations with p-value <0.005 were not used in the final analysis. Networks were then filtered to a correlation threshold of 0.96 ≤ ρ ≤ 1.00 or ρ = 1.00 depending on resulting network size (a stricter threshold was chosen for larger networks to maintain a manageable size). Network characteristics were computed and are described in Table 1. We found each network created to adhere to a power-law degree distribution.
B. Global Network Measures
We have identified some global network measures that can indicate whether or not our filtered correlation networks match the structure of other well-studied biological networks, such as protein-protein interaction networks. We describe these as the following:
Degree distribution of the network involves
determining the degree of each node in the network, ranking Young Mid-Age Untreated Creatine
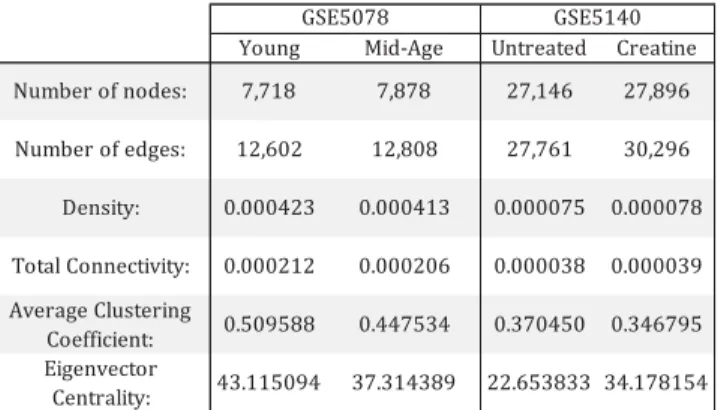
Number of nodes: 7,718 7,878 27,146 27,896 Number of edges: 12,602 12,808 27,761 30,296 Density: 0.000423 0.000413 0.000075 0.000078 Total Connectivity: 0.000212 0.000206 0.000038 0.000039 Average Clustering Coefficient: 0.509588 0.447534 0.370450 0.346795 Eigenvector Centrality: 43.115094 37.314389 22.653833 34.178154 GSE5078 GSE5140
TABLE 1. Global parameters for the four networks created from gene expression datasets GSE5078 and GSE5140. Connectivity and density are very low for all networks, reflecting the extremely filtered nature of our networks. Despite this, clustering coefficient remains high. Eigenvector centrality, which reflects how connected well-connected nodes are to other well-connected nodes, remains relatively low, which is characteristic of biological networks. Hub nodes with direct connections to other hub nodes increase vulnerability in network robustness.
nodes according to degree, and plotting the distribution. When one examines the log/log representation of the node degree distribution in a filtered correlation network, it follows a linear pattern associated with the power-law distribution that indicates a scale-free network structure (Barabasi et al. 2004, Albert 2005). Adherence to this distribution indicates that there are many nodes in the network that are poorly connected and a few nodes that are very well connected; these nodes are known in protein-protein interaction networks as “hubs”. Hubs have been found in the yeast interactome to correspond to essential genes (Jeong et al. 2001) and have been found to be critical for maintenance of structure in other biological networks as well. The scale-free network structure also indicated a modular nature of the network, indicating the tendency of nodes in the network to form clusters. Previous studies to identify these modules indicated that when found, they correspond to genes or gene products working together toward some discrete function, such as a protein complex in an interactome or as a regulatory mechanism (Dong et al. 2007, Xue et al. 2007).
Total connectivity measures the overall connectedness
of a network, (an important measure of robustness. Connectivity is equal to the number of edges (E)divided by the total number of nodes, N*N-1 where N is equal to the number of nodes [16].
Graph density measures the sparsity/density of a
network, referring to 2x the number of edges in the network divided by the total possible edges [16], or 2x the network total connectivity.
Average clustering coefficient measures the average
tendency of the nodes to cluster into groups. The closer
CCavgis to 1, the more likely the network is to form clusters.
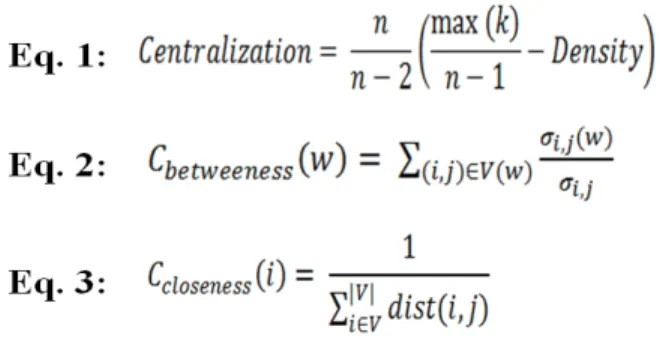
Centralization (Equation 1) measures the star-like
topology of the network, or the connectivity, on average, for all nodes in the network. [16]
C. Local Network Measures
We have identified three key centralities that are measureable across all nodes in a network. We describe these as the following, where N(i) is equal to the number of edges connected to i:
Degree Centrality measures the number of edges, or
connections, of a node [16]. High degree nodes would indicate nodes with possible roles in control of transcription in the correlation network.
Betweenness Centrality (Equation 2) measures the
amount of “traffic” a node handles in relation to the entire network. For a node w, σi,jis the total number of shortest paths between nodes i and j and σi,j(w) is the total number of shortest paths between nodes i and j that pass through w.
Closeness Centrality (Equation 3) measures the steps it
takes for a node to ‘contact’ other nodes in the network [16], where dist(i,j) in the following definition refers to the length of the shortest path between nodes i and j.
D. Measuring Essentiality
All of our networks are created from data drawn from M. musculus, and thus we use the the MGI Marker to Phenotype Annotations file from MGI (ftp://ftp.informatics.jax.org/pub/reports/MRK_Ensembl_Ph eno.rpt), downloaded on February 02, 2011, to aid in our identification of essential nodes. This ad hoc method provides us with a glimpse into the essentiality of genes. For each gene in the network, we determined if an in vivo
knockout mutation had been performed on that gene. If that mutation had been performed, and any of the resulting phenotypes was annotated as “Mortality/Aging,” we state that the mutation was lethal, thus we deem that gene essential. Using this metric, we can perform an enrichment analysis to determine the log-odds ratio enrichment of essential genes in central nodes versus the rest of the network. Enrichment is performed as stated below,
ܧ݊ݎ݄݅ܿ݉݁݊ݐ ൌ ݈݃ଶ൭
ܾൗ݊ ܤ
ܰ ൗ ൱
FIGURE 1. Lethality of three centrality measures for each network at thresholds 1-20%.
where b is equal to the number of essential genes in the test set, n is equal to the total number of genes in the test set, B
is equal to the number of essential genes in the background set, and N is equal to the total number of genes in the background set. P-value is determined by performing hypergeometric distribution on the enrichment scores.
III. RESULTS
After network creation, we identify global and local parameters described above to validate the scale-free structure of our network, and additionally to gain perspective on whether networks created from similar datasets are similar between themselves. Table 1 describes these characteristics for all four networks created. In addition to global network properties, we identified degree, betweenness, and closeness distributions for each network centralities for each network and found them to follow expected distribution curves.
To examine the ability of a centrality measure to identify nodes of interest, we examined the essential node enrichment of top central nodes. Similar to the idea of high degree nodes corresponding to essential genes in PPI’s, we wanted to show whether or not this was the case in correlation networks.
For each network, we created a ranked list of nodes according to centrality (degree, betweenness, or closeness) and set a threshold t for the top percent of nodes we were going to examine. We examined the essentiality of nodes in the top 1, 5, 10, 15, and 20% of each ranked centrality measure. The essentiality of those nodes over each network can be found in Figure 1. Essentiality is defined as the number of essential genes divided by the total number of genes in the top t% of the network centrality measure. We find that in the correlation network, there is no “typical” pattern for increase or decrease of gene essentiality as we change the threshold of “hub” identification. Typically, in
protein-protein interaction networks, degree is the most effective indicator of essentiality. We observe that while degree can be an indicator of node essentiality, closeness and betweenness return higher levels of node essentiality almost always (except for Mid 1%). This method has not been filtered using hypothesis testing, so it is possible that these measures need correction, and serves only as a proof of concept to show that essential genes can identified by measuring multiple node characteristics, and also that hard thresholding to characterize a node as a “hub” should be avoided in correlation networks.
Centrality measures are not independent of each other in that a high degree node can also be a high betweenness node, or a node can be in the top 1% of betweenness, degree, and closeness ranks also. For each threshold t, we examined the lethality of the combinations of centrality resulting in an additional four datasets:
x High betweenness & closeness (BC) x High betweenness & degree (BD) x High closeness & degree (CD)
x High betweenness, closeness, & degree (BCD) For a node to be included in one of these additional datasets, it had to be in the top t% of both the centrality measures. The results of the lethality analysis for these sets are in Figure 2. We found that the closeness and BCD datasets had similar lethality and enrichment score performance compared to degree, and so they were excluded from the figure for clarity.
We also performed enrichment of lethal genes for the top node centrality measurements against the network
background, or the remaining (100-t)% nodes in the
network. An enrichment score around 1.00 indicates that the ratio of essential nodes in the test set to the number of essential nodes in the background set is equal. Numbers
FIGURE 2. Essentiality (left) for original centrality measures betweenness and degree, and combined measures BD, BC, and CD. Enrichment (right) for original centrality measures betweenness and degree, and combined measures BD, BC, and CD. Scores over 1 (black dotted line, horizontal) indicate that the test set (top t% centrality) has a higher population of essential nodes than the rest of the network, the background.
deviating from one indicate that the test set has more or less essential nodes than would be expected based on the background levels. In a PPI whose hub nodes were 60% essential, and whose background nodes were 20% essential, this would give an enrichment score of 3.
For each network, we see that the degree measure rarely rises above an enrichment score of 1, regardless of averaging around 60% lethality. This indicates that degree is not an indicator of essential genes in a correlation network, which is understandable as the nature of the high degree/essential gene relationship in PPIs is derived from pleiotropic and multiple interactor characteristics of a hub protein. A high degree gene in a correlation network only indicates that it is co-expressed with many other genes. We see similar results for betweenness in that the lethality enrichment rarely rises above 1. A high betweenness (HB) gene is likely to be a gene that is connected to 2 clusters of genes that are not connected to each other, such that the HB gene has a moderate correlation with both clusters but the two clusters have very different intra-cluster correlation. Thus, using betweenness as an indicator of noise in the network could potentially become a method for targeting and removing coincidental edges in the network.
If we are looking for a set of structurally important nodes that most consistently identify more lethal genes in the target set, it would appear that CD combination is the best overall, followed by the BC and BD combinations. However, if we examine the enrichment of each dataset, we see that they only rise above 1.1 essentiality enrichment in 7 out of 20 cases, and only in the 1% untreated dataset does the CD measurement seem to reach a level of lethality that would be of interest. The 1% CD Unt dataset consisted of 41 genes, 12 of which had been tested for in vivo knockout. Of those, 10 tested positive for lethality (genes E2f6, Slc19a1, Palld, Myod1, Syne1, Neurod1, Chka, Slc23a1, Nrxn1, and Vgf). This highlights an important caveat of our research – only a portion of the genes identified can be
verified. In this case, the test set is very small (41 genes) and only 29% of the test set had been tested for essentiality. Thus, our data is subject to change as the mouse genome continues to be probed.
These top 10 nodes identified with confirmed lethality were further probed to validate their biological importance. The original dataset the genetic relationships were drawn from examined the effect of oral creatine supplementation on the aging mouse. This particular set of genes identified from the control (Untreated) dataset contains 6 genes involved in primary metabolic process, with other genes involved in system development, vitamin transport, and lipid metabolism according to the Gene Ontology. Due to their centrality in the network, these 10 genes are suspect for being potential drivers of normal aging in the untreated mouse set. Indeed, with further investigation, we find that several of these genes are associated with disturbances in normal aging process when perturbed:
x Chka: Previously associated with neuronal differentiation which has plays a major role in hippocampal development [19, 20]
x Neurod1: Plays a direct role in neuronal differentiation (gene name is d as “neuronal differentiation 1”); homozygous functional knockouts of this gene result in impairments in learning, vision, and hearing [21] x Nrxn1:Extensive deletion studies reveal that mutated
gene products have ties to smoking addiction, a variety of developmental disorders (schizophrenia, autism) and mental retardation
x Syne1: Associated with a form of genetic cerebellar ataxia (damage to nerve cells in the cerebellum causing disruptions in muscle movement) when mutated [22] x Vgf: (“VGF nerve growth factor inducible”) Plays a
major role in synaptic plasticity the hippocampus and has been shown to take part in the generation of neurons [23].
In total, 6 of the genes identified from our validated dataset
have been shown to have direct relationships to
neurogenesis and development in the brain which suggests that our method does indeed identify genes with critical biological impact specific to that particular tissue and state. Further, the additional 4 genes in the validated lethal set could become targets for further study of normal hippocampal function in aged mice. This set of 10 genes from the untreated set represents 0.037% of the original nodes in the network (27,896 genes) and even less of the original microarray dataset (over 40,000 probes total), highlighting the power of high-throughput analysis via correlation network.
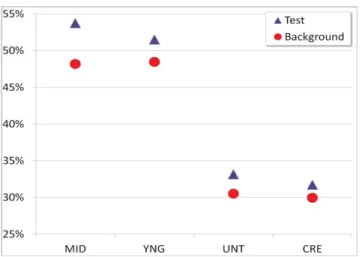
Finally, in Figure 3 we examine the average total percent of nodes tested in the background and target sets, and find that in every case the tested set had a higher number of in vivo knockout tested genes than the background set. Individually this was true for every set except for the 15%
FIGURE 3. Percent tested. Numbers represent the average #tested/total nodes per test and background datasets for all centrality measurements and thresholds t in the networks.
Cre Degree dataset, which had 31.46% of test set nodes tested versus 31.79% of background set nodes tested. This could indicate that, while we may not be identifying the most enriched set of lethal genes per network, we may be identifying general nodes of interest for researchers, as evidenced by the higher levels of gene testing.
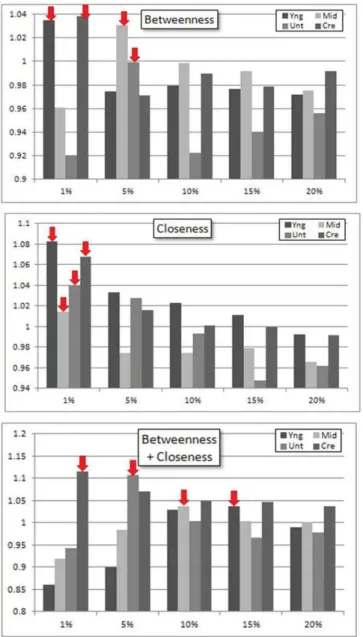
Finally, we are able to use the different levels of filtering to identify which thresholds are the best for identifying essential genes for a specific centrality measure. In Figure 2, it is evident that the deviation from an enrichment of 1 is
larger in smaller thresholds (1-10%) than in larger thresholds (10, 20%). To further examine the impact of filtering on centrality and essentiality, we examined each centrality measure separately over the different thresholds (Figure 4). The only measures where essential gene enrichment was clearly favored were betweenness, closeness, and BC. Betweenness and both appear to have optimal ranges of approximately 1% to 5%, whereas BC had an optimal range of 5-15%. This was chosen by examining the order of top results per network (yng, mid, unt, cre) and the threshold ranges they fell into, in addition to the number of datasets rising above an enrichment score of 1.0. Other centrality measurements did not have a clear winner in terms of threshold.
IV. DISCUSSION
There are many ways to examine gene microarray expression data, but the correlation network provides a novel opportunity to examine relationships among genes as a whole. While many characteristics have been discovered about the nature of the correlation network built from expression data, this technique remains underutilized due to high levels of noise and the need for large capacity computational resources. Continued work on thresholding and reducing network size can provide benchmarks for identifying optimal thresholds for network size and centrality test set definition. In the future we hope to expand this method to examine more than two networks at a time, and to identify critical genes in cross-species analyses. Using common centrality measures used in graph theory, we have shown that correlation networks have their own set of essential genes, which are less readily identified due to high levels of noise, but still persist. We have shown that combining different measures of centrality, specifically closeness and degree, points us to known genes with important cellular impact and provides a new target gene set of interest, narrowing the original search field from thousands of genes to a small, testable, biologically enriched dataset.
ACKNOWLEDGEMENT
This publication was made possible by Grant Number P20 RR16469 from the National Center for Research Resources (NCRR), a component of the National Institutes of Health (NIH) and its contents are the sole responsibility of the authors and do not necessarily represent the official views of NCRR or NIH.
REFERENCES
[1] Mutwil, M., Usadel, B., Schutte, M., Loraine, A., Ebenhoh, O., & Persson, S. (2010). Assembly of an interactive correlation network for the arabidopsis genome using a novel heuristic clustering algorithm. Plant Physiology, 152(1), 29-43.
[2] Reverter, A., & Chan, E. K. (2008). Combining partial correlation and an information theory approach to the reversed engineering of gene co-expression networks. Bioinformatics (Oxford, England), 24(21), 2491-2497.
FIGURE 4. Threshold optimization. Y-axis is essential gene enrichment, and x-axis indicates the threshold t. Red arrows indicate the top result per network per centrality measure. Betweenness appears to have an optimal range of 1-5% but in reality there is no discernible pattern in network thresholding. Closeness
measurement’s optimal range of 1-5% was chosen as 7 of the 8 scores were above enrichment of 1.0. Optimal range of 5-15% was chosen for BC because 9/12 of the scores were above an enrichment score of 1.0.
[3] Watson-Haigh, N. S., Kadarmideen, H. N., & Reverter, A. (2010). PCIT: An R package for weighted gene co-expression networks based on partial correlation and information theory approaches. Bioinformatics (Oxford, England), 26(3), 411-413.
[4] Ewens, W. J., & Grant, G. R. (2005). Statistical methods in bioinformatics (Second Edition ed.). New York, NY: Springer. [5] Zhang, B., & Horvath, S. (2005). A general framework for weighted
gene co-expression network analysis. Statistical Applications in Genetics and Molecular Biology, 4, Article17.
[6] Dong, J., & Horvath, S. (2007). Understanding network concepts in modules. BMC Systems Biology, 1, 24.
[7] Gill, R., Datta, S., & Datta, S. (2010). A statistical framework for differential network analysis from microarray data. BMC Bioinformatics, 11, 95.
[8] Carter, S. L., Brechbuhler, C. M., Griffin, M., & Bond, A. T. (2004). Gene co-expression network topology provides a framework for molecular characterization of cellular state. Bioinformatics (Oxford, England), 20(14), 2242-2250.
[9] Opgen-Rhein, R., & Strimmer, K. (2007). From correlation to causation networks: A simple approximate learning algorithm and its application to high-dimensional plant gene expression data. BMC Systems Biology, 1, 37.
[10] Verbitsky, M., Yonan, A. L., Malleret, G., Kandel, E. R., Gilliam, T. C., & Pavlidis, P. (2004). Altered hippocampal transcript profile accompanies an age-related spatial memory deficit in mice. Learning & Memory (Cold Spring Harbor, N.Y.), 11(3), 253-260.
[11] Benson, M., & Breitling, R. (2006). Network theory to understand microarray studies of complex diseases. Current Molecular Medicine, 6(6), 695-701.
[12] Barabasi, A. L., & Oltvai, Z. N. (2004). Network biology: Understanding the cell's functional organization. Nature Reviews.Genetics, 5(2), 101-113.
[13] Albert, R. (2005). Scale-free networks in cell biology. Journal of Cell Science, 118(Pt 21), 4947-4957.
[14] Jeong, H., Mason, S. P., Barabasi, A. L., & Oltvai, Z. N. (2001). Lethality and centrality in protein networks. Nature, 411(6833), 41-42.
[15] Xue, H., Xian, B., Dong, D., Xia, K., Zhu, S., Zhang, Z., et al.. (2007). A modular network model of aging. Molecular Systems Biology, 3, 147.
[16] Pavlopoulous, G., Secrier, M., Charalampos, N., Moscholpoulous, Soldatos T., Kossia S., Aerts, J., Schneidder, R., Bagos, P. (2011) Using graph theory to analyze biological networks. BioData Min, (4)10.
[17] Subramanian, A., Tamayo, P., Mootha, VK., Mukherjee S., Ebert B.L., Gillette, MA., Paulovich A., Pomeroy SL., Golub TR., Lander ES., Mesirov JP. (2005) Gene set enrichment analysis: a knowledge-based approach for interpreting genome-wise expression profiles. Proc Natl Acad Sci USA, (102)43:15545-50.
[18] Bender A, Beckers J, Schneider I, Hölter SM et al. Creatine improves health and survival of mice. Neurobiol Aging 2008 Sep;29(9):1404-11. PMID: 17416441
[19] Marcucci H, Paoletti L, Jackowski S, Banchio C. Phosphatidylcholine biosynthesis during neuronal differentiation and its role in cell fate determination. J Biol Chem 2010 Aug 13;285(33):25382-93. [20] Esposito M, Piatti V, Laplagne D, Morgenstein N, Ferrari C, Pitossi
F, Schinder A. Neuronal differentiation in the adult hippocampus recapitulates embryonic development. Journal of Neuroscience 2005 Nov 2; 25(44):10074-10086.
[21] Rubio-Cabezas O, Jayne AL, Kantor I, Williams D, Ellard S, Hattersley A. Homozygous mutations in Neurod1 are responsible for a novel syndrome of permanent neonatal diabetes and neurological abnormalities. Diabetes 2010 Sept 5; 59(9):2326-2331.
[22] Gros-Luis F, Dupre N, Dion P, Fox Ma, Laurent S, Verreault S, Sanes JR, Bouchard JP, Rouleu GA. Mutations in Syne1 lead to a newly discovered form of autosomal recessive cerebellar ataxia. Nat Genet
2007 Jan; 39(1):80-5.
[23] Thakker-Varia S, Krol J, Nettleton J, Bilimoria P, Bangasser D, Shors T,Black I, Alder J. The neuropeptide VGF produces antidepressant-like behavioral effects and enhances proliferation in the hippocampus.