POWER DISTRIBUTION SYSTEM EVENT CLASSIFICATION USING FUZZY LOGIC
A Dissertation by
KARTHICK MUTHU MANIVANNAN
Submitted to the Office of Graduate Studies of Texas A&M University
in partial fulfillment of the requirements for the degree of DOCTOR OF PHILOSOPHY
Approved by:
Chair of Committee, B. Don Russell
Committee Members, Karen L. Butler-Purry Reza Langari
Krishna Narayanan Department Head, Costas N. Georghiades
December 2012
Major Subject: Electrical Engineering
ABSTRACT
This dissertation describes an on-line, non-intrusive, classification system for identifying and reporting normal and abnormal power system events occurring on a distribution feeder based on their underlying cause, using signals acquired at the distribution substation. The event classification system extracts features from acquired signals using signal processing and shape analysis techniques. It then analyzes features and classifies events based on their cause using a fuzzy logic expert system based classifier. The classification system also extracts and reports parameters to assist utilities in locating faulty components. A detailed illustration of the classifier design process is presented.
Power distribution system event classification problem is shown to be a large scale classification problem. The reasoning behind the choice of a fuzzy logic based hierarchical expert system classifier to solve this problem is explained in detail. The fuzzy logic based expert system classifier uses generic features, shape based features and event specific features extracted from acquired signals. The design of feature extractors for each of these feature categories is explained. A new, fuzzy logic based, modified Dynamic Time Warping (DTW) algorithm was developed for extracting shape based features. Design of event specific feature extractors for capacitor problems, arcing and overcurrent events are discussed in detail. The fuzzy logic based hierarchical expert system classifier required a new fuzzy inference engine that could efficiently handle a large number of rules and rule chaining. A new fuzzy inference engine was designed for this purpose and the design process is explained in detail. To avoid information overload, an intelli-gent reporting framework that processes raw classification information generated
by the fuzzy classifier and reports events of interest in a timely and user friendly manner was developed.
Finally, performance studies were carried out to validate the performance of the designed fuzzy logic based expert system classifier and the intelligent report-ing system. The data needed to design and validate the classification system were obtained through the Distribution Fault Anticipation (DFA) data collection plat-form developed by Power System Automation Laboratory (PSAL) at Texas A&M University, sponsored by the Electric Power Research Institute (EPRI) and multi-ple partner utilities.
DEDICATION
ACKNOWLEDGEMENTS
I am thankful to Dr. B. Don Russell for his patience and guidance throughout my research work. I am grateful to him for having provided me with an opportu-nity to work on this project, and for helping me refine this dissertation.
I wish to thank Carl L. Benner whose inputs and ideas were vital for the com-pletion of this work. I thank my committee members, Dr. Karen L. Butler-Purry, Dr. Reza Langari and Dr. Krishna Narayanan, for their advice and time. I wish to thank Jeff Wischkaemper for his help in reviewing my dissertation.
I wish to acknowledge the Electric Power Research Institute (EPRI) and the supporting utilities for their funding of this project.
I thank my family and friends for their loving support and words of encour-agement.
TABLE OF CONTENTS Page ABSTRACT . . . ii DEDICATION . . . iv ACKNOWLEDGEMENTS . . . v TABLE OF CONTENTS . . . vi LIST OF FIGURES . . . x
LIST OF TABLES . . . xvi
1. INTRODUCTION . . . 1 1.1 Introduction . . . 1 1.2 Research Objectives . . . 4 1.3 Dissertation Outline . . . 6 2. LITERATURE REVIEW . . . 8 2.1 Introduction . . . 8
2.2 Literature Review of PQ Disturbance Classification Methods . . . . 11
2.2.1 Feature Extraction Techniques . . . 12
2.2.2 Classification Techniques . . . 17
2.3 Literature Review of Specific Event Identification Methods . . . 23
2.3.1 Overcurrent Identification . . . 23
2.3.2 Arcing and High Impedance Fault (HIF) Identification . . . 25
2.3.3 Capacitor Bank Switching Identification . . . 26
2.4 Chapter Summary . . . 27
3. PROBLEM FORMULATION . . . 28
3.1 Introduction . . . 28
3.2 Distribution Fault Anticipation Background . . . 33
3.3 DFA Data Collection Platform Description . . . 37
3.3.1 DFA Field Unit . . . 38
3.3.3 Waveform Files . . . 45
3.4 Power Distribution System Event Classification Problem Formulation 45 3.4.1 Multi-phase Power System Event Classification Problem State-ment . . . 48
3.4.2 Segmentation - Problem of Detecting Sub-events . . . 54
3.4.3 Feature Extraction - Problem of Extracting Event Character-istics . . . 56
3.4.4 Event Classification and Feature Analysis - Problem of Clas-sifying Under Uncertainties . . . 62
3.4.5 Power System Event Classification - A Large Scale Classifi-cation Problem . . . 74
3.4.6 Classification System Overall Scheme . . . 81
3.5 Chapter Summary . . . 92
4. RMS SHAPE ANALYSIS . . . 94
4.1 Introduction . . . 94
4.2 RMS Waveform Shape Detection Problem . . . 96
4.3 Shape Template Matching Using DTW . . . 98
4.3.1 Finding Optimal Warp Path . . . 99
4.3.2 DTW Based RMS Shape Classifier . . . 105
4.3.3 Time and Memory Complexity of Using DTW . . . 105
4.4 Fuzzy Shape Template Matching Using DTW . . . 106
4.4.1 Fuzzy Shape Templates . . . 108
4.4.2 Computing Optimal Warp Path for Fuzzy Shape Templates . 113 4.4.3 Fuzzy DTW Based RMS Shape Classifier . . . 123
4.4.4 Time and Space Complexity of Using FDTW . . . 123
4.5 RMS Waveform Feature Estimation . . . 124
4.5.1 Identifying Pivot Points on RMS Waveforms . . . 125
4.5.2 Computing Shape Features for RMS Waveforms . . . 129
4.6 Chapter Summary . . . 131
5. EVENT SPECIFIC FEATURE EXTRACTION . . . 132
5.1 Introduction . . . 132
5.2 Features Specific to Arcing Events . . . 136
5.2.1 Feature Extraction for Arcing Events . . . 137
5.3 Features Specific to Abnormal Capacitor Operations . . . 146
5.3.1 Capacitor Problems that Cause Reactive Power Imbalance . 147 5.3.2 Capacitor Problems that Cause Voltage Transients . . . 150
5.4 Features Specific to Overcurrents . . . 166
5.4.2 Overcurrent Fault Categories . . . 169
5.4.3 Overcurrent Feature Extraction Algorithm . . . 179
5.5 Chapter Summary . . . 195
6. FUZZY CLASSIFIER . . . 196
6.1 Introduction . . . 196
6.2 Hierarchical Classifier Architecture . . . 198
6.2.1 Modular Structure . . . 198
6.2.2 Conflict Resolution and Class Assignment . . . 228
6.3 Design of a Large Scale Fuzzy Inference Engine . . . 232
6.3.1 FuzzyShell vs. Custom Inference Engine . . . 233
6.4 Fuzzy Feature Analysis Engine (FFAE) . . . 235
6.4.1 Offline Rule Optimizer and Compiler . . . 235
6.4.2 Online Delayed Fuzzy Inference . . . 254
6.5 Intelligent Reporting Framework . . . 257
6.6 Chapter Summary . . . 260
7. RESULTS AND CASE STUDIES . . . 261
7.1 Introduction . . . 261
7.2 Overview of IPSERS . . . 261
7.2.1 Details of Information Presented to Users . . . 267
7.2.2 Real World Examples of Information Presented to Users . . 267
7.3 Classification Performance on Field Data . . . 275
7.3.1 Classification Performance of FLCA . . . 275
7.3.2 Classification Performance of Reporting Algorithms . . . 289
7.4 DFA-IPSERS Case Studies . . . 294
7.4.1 Case Study 1: Tree Limb Burns Down Line, Causing Outage 294 7.4.2 Case Study 2: Misoperating Capacitor Controllers . . . 299
7.4.3 Case Study 3: Prevented Outage Caused by Failing External Transformer Bushing . . . 302
7.4.4 Case Study 4: Prevented Vegetation Related Outage . . . 306
7.4.5 Case Study 5: Avoided Outage by Detecting and Locating Incipient Failure . . . 308
7.4.6 Case Study 6: Detected and Helped Locate Fault-induced Conductor Slap . . . 312
7.5 Chapter Summary . . . 317
8. CONCLUSIONS . . . 318
8.2 Conclusions . . . 318 8.3 Future Research . . . 320 REFERENCES . . . 322
LIST OF FIGURES
Page
2.1 General Structure of Disturbance Classifiers . . . 11
3.1 One-line Diagram of a Typical Distribution System [73] . . . 29
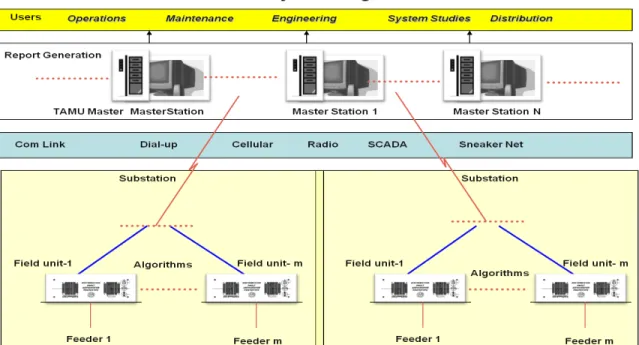
3.2 DFA System Diagram . . . 37
3.3 Field Unit . . . 38
3.4 Analog Signal Conditioning . . . 39
3.5 Representing expert knowledge as a Bayesian network . . . 68
3.6 Representing fuzzy rule as tree . . . 68
3.7 Membership functionsµLARGE andµVERYSMALL . . . 69
3.8 Block diagram of classification system . . . 82
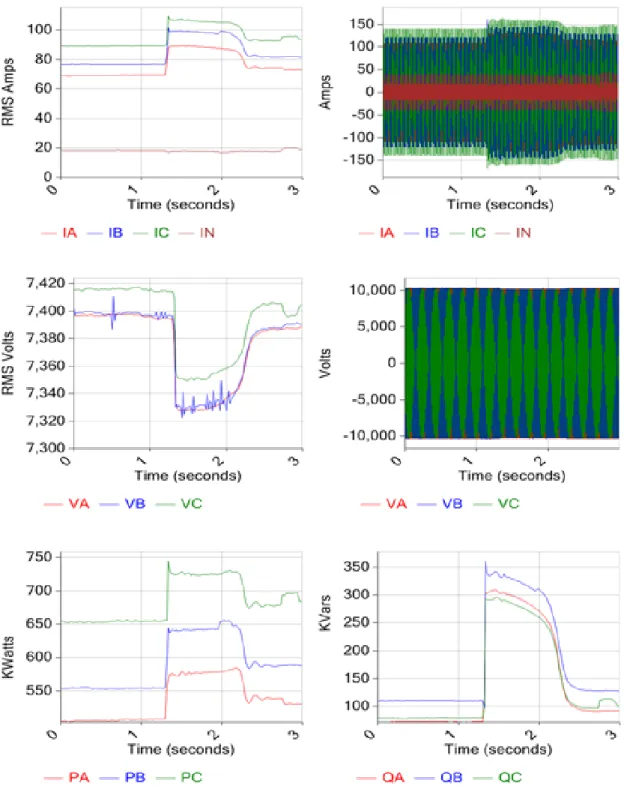
3.9 Waveforms recorded during a motor start event . . . 83
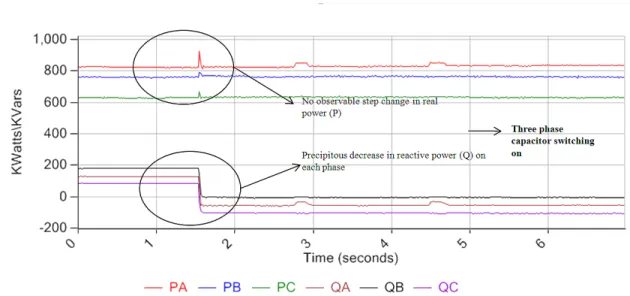
3.10 Real and reactive power waveforms during a capacitor switching event . . . 85
3.11 Using signal levels to determine event type . . . 87
3.12 Motor start characteristic shape . . . 87
3.13 RMS and high speed voltage waveforms from an capacitor switch arcing event . . . 89
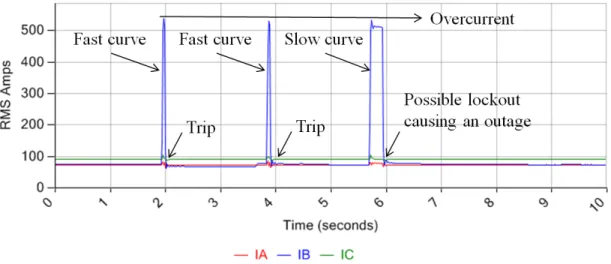
3.14 RMS current waveforms from multi-shot overcurrent event . . . 91
4.1 RMS waveform shape examples . . . 95
4.2 Real and reactive power plots from motor start events . . . 97
4.3 Warping a shape template to a RMS waveform . . . 99
4.4 Shape distortion when warp path stays at some template points for too long . . . 102
4.5 Motor start with local variations . . . 107
4.6 Sample motor start shape template . . . 108
4.7 Sample fuzzy motor start shape template . . . 110
4.8 Fuzzy template matching of a noisy motor start . . . 112
4.9 Pivot points for sample motor start shape . . . 125
4.10 Pivot points for sample step-up shape . . . 126
4.11 Computing pivot points using fuzzy motor start shape template . . 128
4.12 Subset of shape features for a sample motor start shape . . . 129
5.1 Example waveforms caused by arcing . . . 133
5.2 Example waveforms caused by capacitor switch bounce . . . 133
5.3 Waveforms from an overcurrent fault that caused a single-phase re-closer to trip . . . 134
5.4 Signature of a single line-to-ground arcing event . . . 138
5.5 Extracting single line-to-ground event . . . 141
5.6 Signature of a line-to-line arcing event . . . 142
5.7 Extracting single line-to-line event . . . 145
5.8 Balanced capacitor bank switching . . . 148
5.9 Unbalanced capacitor switching . . . 148
5.10 Capacitor VAR imbalance . . . 149
5.11 Transients caused by normal capacitor operation . . . 150
5.12 Comparison of waveforms from capacitor switching as seen from monitored feeder and adjacent feeder . . . 153
5.14 Relative magnitudes of voltage transients on three-phases during capacitor switching . . . 155 5.15 Extracting capacitor voltage transient features . . . 158 5.16 High-pass filtered voltage and current signals from sample
capaci-tor arcing event . . . 159 5.17 Cycle-by-cycle peak values of high-pass filtered voltage waveforms
caused by arcing capacitor . . . 160 5.18 Waveforms from capacitor restrike event . . . 163 5.19 Reactive power and voltage waveforms from a capacitor arcing event165 5.20 TCCs of a 25A QA type fuse . . . 168 5.21 TCCs of a 70A ‘4H’ type hydraulic recloser . . . 170 5.22 Example waveforms caused by a single-phase B to ground
overcur-rent . . . 171 5.23 Example waveforms caused by phase A to phase B overcurrent fault 172 5.24 Example waveforms caused by a phase A to phase B to ground
overcurrent . . . 173 5.25 Example waveforms caused by a three-phase overcurrent fault that
did not involve ground . . . 173 5.26 Example waveforms caused by a three-phase to ground overcurrent 174 5.27 Example waveforms from an evolving fault . . . 175 5.28 Example waveforms from a single-phase overcurrent fault
inter-rupted by a single-phase automatic recloser . . . 176 5.29 Example waveforms from a single-phase overcurrent fault
inter-rupted by a three-phase automatic recloser . . . 176 5.30 Example waveforms from a three-phase overcurrent fault interrupted
5.31 Example waveforms from a three-phase overcurrent that was
inter-rupted by a three-phase recloser and resulted in an outage . . . 178
5.32 Example waveforms from a single-phase (BG) short-lived fault . . . 179
5.33 Overcurrent feature extraction algorithm . . . 180
5.34 High-speed current waveform from an overcurrent event showing DC offset . . . 181
5.35 Preferred alignment of RMS computation window . . . 182
5.36 Relation between overcurrent feature extraction algorithm and higher level fuzzy classifier . . . 184
5.37 Waveforms from an overcurrent fault that caused a single-phase re-closer to trip and reclose . . . 185
5.38 State machine based overcurrent sequence analysis . . . 187
5.39 Protective device type identification . . . 194
5.40 Screen capture of overcurrent specific output information presented to utility user . . . 195
6.1 Fuzzy hierarchical classifier . . . 199
6.2 Basic Fuzzy Processing Module . . . 202
6.3 Example membership functions used by phase level rules . . . 208
6.4 Example segment level membership function . . . 214
6.5 Confidence degree membership functions . . . 224
6.6 Combined consequent possibility distribution . . . 227
6.7 Conflict resolution and class assignment . . . 229
6.8 Fuzzy Feature Analysis Engine (FFAE) overview . . . 236
6.9 Detailed view of Spirit parser . . . 242
6.11 Example rules with fuzzy consequent represented as graphs . . . . 247
6.12 Schematic of a typical production systems . . . 252
6.13 Production system used by FFAE . . . 253
6.14 Schematic of online delayed fuzzy inference . . . 255
7.1 Schematic of IPSERS . . . 263
7.2 Screen capture of non clustered events reported through the web interface of IPSERS . . . 271
7.3 Screen capture of capacitor related events reported through the web interface of IPSERS . . . 272
7.4 Screen capture of non capacitor related clustered events reported through the web interface of IPSERS . . . 274
7.5 A second fault tripped recloser twice without causing a lock out . . 295
7.6 Current waveforms from final instance of fault that caused the re-closer to lock out . . . 296
7.7 Screen capture of automatic alert items generated through offline processing of recorded waveform files corresponding to overcur-rent episodes in case study 1 . . . 297
7.8 Screen capture of automatic alert items generated through offline processing of recorded waveform files corresponding to misoperat-ing capacitor banks in case study 2 . . . 301
7.9 Single phase fault cleared by a single phase poletop recloser . . . . 303
7.10 Screen capture of automatic alert items generated through offline processing of recorded waveform files corresponding to repetitive overcurrent episodes documented in case study 3 . . . 305
7.11 RMS waveforms of fault currents recorded during repetitive faults 307 7.12 Screen capture of automatic alert items reported to users . . . 307
7.14 Circuit map showing the affected feeder that had 139 miles of expo-sure . . . 309 7.15 Screen capture of recurrent fault reported to users . . . 310 7.16 Picture of failing arrester . . . 311 7.17 One-line diagram of a typical fault induced conductor slap scenario 313 7.18 Picture of the pole where a pole fire was reported . . . 314 7.19 Screen capture of conductor slap alert . . . 314 7.20 RMS current waveforms explaining the sequence of operations . . 315 7.21 Pictures of the location of conductor slap and arced conductors . . 316
LIST OF TABLES
Page
3.1 List of high-speed SCM waveform channels . . . 40
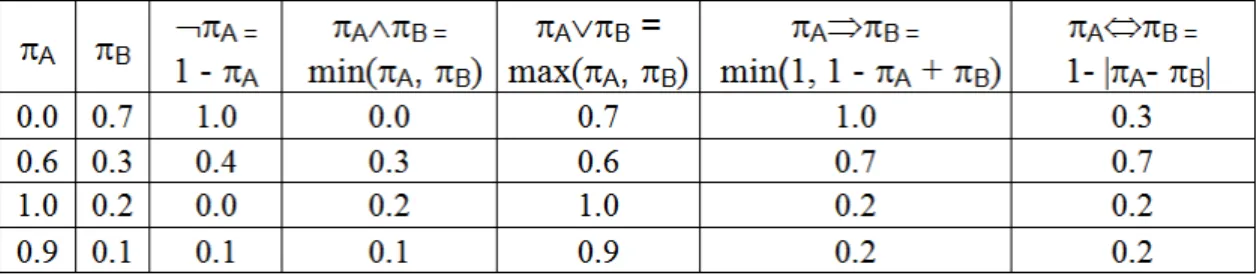
3.2 Fuzzy Set Operators . . . 73
3.3 Numerical examples of fuzzy set operations on possibility distribu-tions . . . 73
3.4 Output classification attributes and values . . . 75
4.1 Generic features . . . 124
4.2 Optimal warp path for sample RMS waveform in Figure 4.11 . . . . 128
4.3 Shape features (xShape) . . . 130
5.1 Event specific features pSpeci f icSLG−Arc for single line-to-ground arcing 139 5.2 Event specific features pSpeci f icL2L−Arc for line-to-line arcing . . . 143
5.3 Event specific features pSpeci f icv−trans for capacitor related voltage transients . . . 156
5.4 State sequence generated from overcurrent example in Figure 5.37 . 191 5.5 Overcurrent state specific features . . . 192
5.6 Sequence string generated for overcurrent example in Figure 5.37 . 193 6.1 Fuzzy classifier modules . . . 200
6.2 Description of sample input features . . . 204
6.3 Sample feature values . . . 204
6.4 Example phase level rules . . . 206
6.5 Example phase level rules in FFML . . . 207
6.6 Sample phase level membership functions . . . 209
6.8 Sample phase level possibility values . . . 210
6.9 Example segment level rules . . . 213
6.10 Example segment level rules in FFML . . . 214
6.11 Sample segment level possibility values . . . 219
6.12 Example event level rules . . . 223
6.13 Example event level rules in FFML . . . 224
6.14 Example clipping using computed antecedent possibility value . . 226
6.15 Hypothetical event level possibility values . . . 230
6.16 Sample order of importance . . . 230
6.17 Mapping between possibility values and confidence label . . . 231
7.1 Relationship between event labels used for reporting and informa-tion generated by FLCA . . . 265
7.2 Information contained in reported items . . . 266
7.3 Event specific information for non clustered events . . . 268
7.4 Event specific information for capacitor problem related events . . 269
7.5 Event specific information for non capacitor related clustered events 270 7.6 Confusion matrix of data labeled by FLCA using a one week window278 7.7 Description of event category labels . . . 279
7.8 Legend of color codes used in confusion matrix (Table 7.6) . . . 281
7.9 Analysis of classification accuracy . . . 284
7.10 Phase identification performance of FLCA . . . 288
7.11 Confusion matrix of capacitor related problems reported to users based on one year of data . . . 290
7.12 Confusion matrix of non-capacitor related problems reported to users based on one year of data . . . 291 7.13 List of individual interruptions . . . 294
1. INTRODUCTION
1.1 Introduction
The primary aim of any electricity supply system is to meet all customers’ de-mand for energy. With increasing dependence on electricity supply, the need to achieve the highest possible reliability as economically as possible has becomes more important to customers. The large geographic areas spanned by power dis-tribution feeders make them susceptible to factors such as: weather, disturbances caused by animals and human activity. The components of a power system in-clude, but are not limited to, overhead lines, cables, transformers, insulators, ca-pacitors, protective devices and the loads utilizing the power supplied. These components are susceptible to overloading, aging or defects, and damage.
Components of a power system that are either in the process of failing or that have already failed cause abnormal conditions measurable as electrical transients on the power system [1]. In some cases, a failing component may trigger the op-eration of a protective device, isolating that component from the system, but also creating an interruption or sustained outage. In other cases, a faulty component will continue to misoperate causing disturbances and hazardous conditions on the power system. In the former case, when a protective device operates, portions of the feeder may lose their supply of power. Such outage situations are unde-sirable and utilities make efforts to locate the problem and restore the supply to those parts in the shortest possible time. In the later case, a failed or misoperating component, when not isolated, may cause transients, unbalanced conditions or other power quality problems. Such disturbances may interfere with the normal operation of other components in the power system. In such situations, it is
de-sirable to detect the faulty component and rectify or replace it before it causes any further damage to the system.
Utility companies do their utmost to keep customers served by providing them with uninterrupted supply of high quality power at competitive prices through careful planning and operation of distribution systems. Utility companies do scheduled maintenance and inspection to monitor the health of feeders. Never-theless, failure or degradation of power system components are inevitable. Com-ponents may degrade or fail between maintenance cycles. Faulty comCom-ponents may have been overlooked during maintenance or healthy components may fail as a result of an operator error during a maintenance cycle. Consequently, certain situations arise and result in abnormal operating conditions. When such abnor-mal conditions arise, it is important to identify the cause of the problem and take measures to fix the problematic component in a timely and cost effective manner. Today, electric utilities have no automated diagnostic systems to assist in identi-fying, finding, and correcting degraded or failed components.
Developing a system that monitors health of feeders, detects abnormal condi-tions and provides information about misoperating components would provide significant benefit to the utility industry. Such system would require advanced continuous on-line monitoring to keep a utility company updated about the health of its feeders. This monitoring system, in addition to providing information about the cause of abnormal conditions, should also provide relevant parameters that will help narrow the search for the problem. Some of the advantages of such a system include:
• Utilities can resort to condition based maintenance and fix only components that have failed or started to degrade. This will allow the utility industry to
save hundreds of millions of dollars in maintenance costs.
• Detecting failing components will help utility companies to fix problems be-fore they escalate to catastrophic failures. This approach would have signif-icant benefit to system reliability, as well as allowing utilities to fix compo-nents under optimal conditions (e.g. not in the middle of the night after an explosion, causing a large outage).
• Some components may go to failure rapidly or may not exhibit any de-tectable signatures during the period leading to failure. In such situations, any information about the failed component may still reduce the amount of time needed to locate the faulty component and replace it. In the absence of this information, utility companies have to manually inspect feeders based on customer calls. This is often sub-optimal, and can be expensive, time consuming, and error prone.
It is possible to monitor activity on a feeder by analyzing signals such as cur-rent and voltage waveforms corresponding to that feeder. These signals can be acquired using a data acquisition platform located at the distribution substation. Both normal and abnormal operations of power system components exhibit char-acteristic signatures that may be detected by analyzing the acquired signals. This analysis is quite complex and involves analyzing large volumes of data. Such analysis is expensive, time-intensive, and error prone if done manually. Devel-oping an automated system for monitoring feeder health, that automatically re-ports problems in a timely and user friendly manner, is necessary. Other than the methodology presented in this dissertation, currently no other such system exists.
1.2 Research Objectives
This dissertation describes a new, on-line, non-intrusive, classification system for identifying and reporting normal and abnormal power system events occur-ring on a distribution feeder based on their underlying cause, using signals ac-quired at the distribution substation. In this research context, an event is any nor-mal or abnornor-mal observable activity on the power distribution feeder that mani-fests itself through measurable changes in electrical signals. Such an event classi-fication system needs to extract features from acquired signals using signal pro-cessing and shape analysis techniques. It then must analyze features and classify events based on their cause. Ideally, the classification system should also extract and report parameters to assist utilities in locating the faulty component. The following paragraphs present key steps needed to accomplish the above goal:
Developing a fuzzy logic based expert system: The primary objective of this re-search is the development of a fuzzy logic based expert system for classifying power system event data. A scalable and modular fuzzy hierarchical classifier is proposed. A fuzzy inference engine that supports a hierarchical structure best suited for power system event classification is needed to accomplish above objec-tive.
Identifying characteristic event signatures: Characteristic features correspond-ing to power system components that are either in the process of failcorrespond-ing or have already failed must be identified. These features are needed by the fuzzy logic based expert system classifier. Some failure signatures are well understood, while others must be documented for the first time. Data should be acquired, where possible, from operational distribution feeders where events ave occured under normal operating conditions. Specialized algorithms for extracting event-specific
features are needed.
Developing RMS shape analysis algorithm: Manually classifying power system events primarily involves visual analysis of root mean square (RMS) current, volt-age and power waveforms by a human expert. To mimic this analysis, shape recognition and segmentation algorithms are needed. A Dynamic Time Warping (DTW) based RMS shape analysis algorithm is proposed for this purpose.
Identifying and computing important parameters: Once the underlying cause of a power system event is identified, appropriate parameters corresponding to the event of interest should be determined and calculated. Different power system events require different parameters to be calculated in order to estimate the phys-ical location of the event. For example, in the case of an unbalanced capacitor operation, VAR step size and the phase involved can help determine which of several capacitor banks on a feeder are failing. In the case of a repetitive overcur-rent fault, the magnitude and duration of the fault, what phases are involved, and information on any protective devices that may have operated can assist utility personnel in significantly reducing their search area. Algorithms to extract the parameters corresponding to different power system events are needed for iden-tifying and reporting event-specific parameters.
Intelligent reporting to avoid information overload: For the classification system to be usable, it cannot report every event that is classified. This is because, a major-ity of monitored power system transients are normal day-to-day system operation that are of little interest to utility personnel. If all these events are reported, utility personnel will be overloaded with data. They may miss the relatively few and important abnormal events (i.e. important information) that get buried among a larger number of normal events. It is important that only events of interest are presented to utility personnel along with parameters required to locate the event
source. Hence, an intelligent reporting framework to process raw classification information generated by the fuzzy classifier and report events of interest in a timely and user friendly manner is also needed.
Design of efficient classification algorithms: In order to report problems on dis-tribution feeder to utility personnel in a timely fashion, all components of the expert system classifier needs to be very efficient and operate in soft real time. This design constraint is complicated by the reality that processing power avail-able in remote monitoring units is generally quite limited. As a result, a scheme in which the fuzzy logic rule base is precompiled will be preferable, as it will reduce the time and memory complexity of all sub-components used by the classification system.
1.3 Dissertation Outline
This dissertation is organized as follows. Chapter 1 presents overall industry problem, the objectives of this research work, and organization of this disserta-tion. Chapter 2 provides a literature review of methodologies used to classify power distribution system events. Chapter 3 describes the problem of classify-ing power distribution system events in detail and outlines an approach used to solve the problem. Chapter 4 details shape analysis methods used for RMS shape identification. Chapter 5 identifies signatures needed to classify specific power system events and describes algorithms used to extract these signatures. Chapter 6 describes the fuzzy hierarchical classifier architecture and outlines an intelligent reporting framework. Chapter 7 describes an Intelligent Power System Event Re-porting System (IPSERS) implemented based on the proposed methodology and analyzes the classification accuracy of IPSERS. Chapter 7 also provides real world examples where the proposed methodology has assisted utility personnel in
lo-cating sources of abnormal events. Chapter 8 draws conclusions and discusses possible future directions and improvements to this research.
2. LITERATURE REVIEW
2.1 Introduction
Considerable research has been done in the application of classification methods to identifying problems on power distribution systems. Most of the re-search falls under two categories: classifying Power Quality (PQ) disturbances and detecting specific power system events. While prior research has either fo-cused on detecting a specific event type or on classifying events based on their nature without trying to identify their cause, this research focuses on classifying a broad range of events based on their underlying cause.
Little prior work exists in the area of power distribution system event clas-sification as described in this dissertation. This is largely due to diverse nature of power distribution systems. The development of generalized classification al-gorithms that work equally well on feeders operating under different conditions, across multiple utilities, serving customers with varying needs is difficult. This research attempts to fill that gap by developing a generalized fuzzy logic based expert system architecture that is targeted towards power system event classifi-cation problem. One significant reason for the lack of prior art is the absence of field data that document the wide range of event signatures occurring on oper-ational systems with the fidelity needed to design reliable classification routines. This research uses data collected using advanced monitoring units developed as a part of the Distribution Fault Anticipation (DFA) project sponsored by the Elec-trical Power Research Institute (EPRI). DFA monitoring units have been installed on sixty feeders belonging to eleven utilities across the North America and have been gathering data for the past seven years. Data collected using these devices
represents the largest known library of events and failure signatures on distribu-tion feeders. Many of the events and failures documented in the DFA database had not been documented before the DFA project began. Understanding gained from analysis of this library of events has served as the basis for developing the fuzzy logic based classification methodology put forth in this dissertation. In spite of significant differences between the proposed research and currently available techniques, it is worth reviewing PQ disturbance classification and specific event identification methodologies. These methods provide valuable insight into exist-ing power system signal analysis techniques and classification approaches.
Power quality may be defined as delivering electrical energy with characteris-tics required for the proper operation of various components and loads that make up the power system without significantly affecting their performance or reliabil-ity. A PQ disturbance may be described as deviation of voltage signals from their ideal values [2]. PQ disturbances include transients, long duration voltage varia-tions (under-voltage, over-voltage, sustained interrupvaria-tions), short duration volt-age variations (swells, sags, oscillations), voltvolt-age imbalance, harmonic distortions and power frequency variations [3]. PQ disturbance classification methods focus on identifying the nature of disturbances and seldom try to identify the compo-nent that caused the disturbance. Another drawback of PQ disturbance classifica-tion methods is that they mostly restrict themselves to analysis of voltage signals. These methods overlook critical information contained in current signals. For ex-ample, an overcurrent fault will cause a dip in voltage signals irrespective of its position relative to the measurement point. Based on observing voltage signals alone, it is not possible to determine if a fault was caused by a problem upstream or downstream of a measurement point. Similar arguments can be made for other event types too. Knowing the position of a problematic component relative to
the measurement point is essential to narrow down the location of the problem. To accomplish this, voltage signals by themselves are not sufficient, and current signals, along with values calculated from a combination of current and voltage, such as real and reactive power, need to be analyzed. Methods for specific event identification may do a better job of identifying event cause and position, but have their drawbacks.
Specific event identification methods, as the name suggests, are designed to detect and/or locate specific problems. Some examples of specific event identifi-cation include overcurrent fault loidentifi-cation, high-impedance fault detection, trans-former fault detection, inrush detection, capacitor identification. The major draw-back of these methods is that they do not provide a general framework for identi-fying a broad range of events. It is not practical to combine these different meth-ods to form a hybrid classification system since these specific event identification methods often do not share a common input interface. Some specific event iden-tification methods require that measurements be made at a close proximity or even inside the equipment of interest. Such methods can be very expensive and cumbersome if they have to be installed at a utility-wide level. For wide-scale deployment, a classification method to determine the health of components and equipment connected to a feeder based solely on measurements taken directly at a distribution substation. The primary objectives of this research is to develop one such method.
The following sections review and summarize existing approaches to power system event classification with focus on PQ disturbance classification and spe-cific event identification.
P r e - P r o c e s s i n g S i g n a l d e n o i s i n g S t a t i s t i c a l p a r a m e t e r s D e r i v e d s i g n a l s S e g m e n t a t i o n F e a t u r e e x t r a c t i o n T i m e d o m a i n f e a t u r e s S t a t e - s p a c e f e a t u r e s F r e q u e n c y d o m a i n f e a t u r e s T i m e - f r e q u e n c y f e a t u r e s M u t l i r e s o l u t i o n f e a t u r e s C l a s s i f i c a t i o n C r i s p r u l e b a s e d i n f e r e n c e F u z z y l o g i c b a s e d i n f e r e n c e P r o b a b i l i s t i c m e t h o d s S t a t i s t i c a l l e a r n i n g m e t h o d s S t a g e I S t a g e I I S t a g e I I I
Figure 2.1: General Structure of Disturbance Classifiers
2.2 Literature Review of PQ Disturbance Classification Methods
Power quality disturbance classification methods have a general struc-ture as outlined in Figure 2.1. In the figure, Stage I represents the pre-processing stage. During pre-processing, operations like signal denoising, computing sta-tistical parameters and computing derived signals may be performed. Some ap-proaches use segmentation during pre-processing to isolate data corresponding to a disturbance and to extract pre-disturbance and post-disturbance parameters. Stage II represents the feature extraction stage. Feature extraction is essential to concisely and accurately present sufficient data to identify a disturbance without overwhelming the classifier. The quality of the features to a large extent determine accuracy of classification. Choice of features and feature extraction techniques are influenced by the nature of the signal being analyzed, domain knowledge and the processing power available. Features serve as inputs to Stage III, the classification stage. This stage is responsible for analyzing features, discriminating different disturbance types and assigning a class label that associates the data with a spe-cific disturbance type. The choice of classifier is heavily influenced by the nature of features used.
methods vary in their choice of feature extraction techniques and classification techniques but conform to the general structure outlined above. Some of these methods use real field data but most of them use simulated data as inputs. Each of these methods have their own advantages and disadvantages, however there is no empirical data or comparisons available in the literature that will help to prove superiority of one method over the other. The following sections will discuss fea-ture extraction techniques and classifiers that have been used for PQ disturbance classification.
2.2.1 Feature Extraction Techniques
A variety of feature extraction techniques have been applied to PQ dis-turbance analysis. These techniques can be broadly classified into time domain analysis, state-space analysis, frequency domain analysis, time-frequency analy-sis, and mutliresolution analysis.
2.2.1.1 Time domain analysis
Digital filters may be used extract information contained in certain fre-quency bands by passing a time domain signal through the digital filter. More than one such filter may be used to extract features corresponding to different fre-quency bands. Chen [4] proposed a method that used a series of digital filters to extract features from voltage signals. Digital filters were used to obtain sig-nals corresponding to specific frequency bands. Then the deviation of the energy content in these different frequency bands from their nominal values was used to determine the type of PQ disturbance. Lu [5] proposed a different time domain approach based on mathematical morphology [6]that uses shapes as probes to ex-tract features from time domain signals. Lu claims that good performance under noisy conditions and computational efficiency as the main advantages of this
ap-proach. His analysis, however, is limited to voltage signals and does not provide an automatic classification strategy.
2.2.1.2 State-space analysis
A widely used state-space approach in power quality is Kalman Filter. Kalman filter is a recursive estimator that uses state estimates from a previous time step and the measurements from the current time step to estimate the current state values. Typically for power system signals, amplitude and phase of funda-mental frequency, and the amplitude and phase for a set of harmonics serve as the states. The estimated state values are compared with actual observed values and this information is used for disturbance analysis. Styvaktakis [7] used Kalman filter for disturbance detection, Styvaktakis also computed a disturbance index based on the deviation of estimated values and actual voltage measurements. These were used as inputs to an expert system based disturbance classifier. Since Kalman filter assumes that the system being modeled is a linear dynamic system and power system disturbances and transients are highly non-linear, Zhang [8] proposed an approach based on unscented Kalman filter which is better suited for non-linear systems. Zhang only outlined a method to detect power quality problems but did not provide a means of classifying power quality disturbances.
2.2.1.3 Frequency domain analysis
Representing power system signals in the frequency domain by applying a Discrete Fourier Transform (DFT) is a well established tool for feature extrac-tion. Application of the DFT provides a means of estimating the amplitude and phase angles of the fundamental component and its harmonics. Further, values corresponding to a subset of these harmonics may be chosen to achieve feature re-duction. The choice of the harmonics may be either based on expert knowledge, or
general dimensionality reduction techniques such as Principal Component Anal-ysis (PCA) or Independent Component AnalAnal-ysis (ICA) may be applied [9]. Am-plitude and phase estimation may be improved by applying windowing such as Hanning, Hamming, etc. The main disadvantages of DFT-based approaches is the inverse relationship between the frequency resolution and window size. A single window size may not be suited for analyzing both disturbances that manifest as short duration transients that last a fraction of a cycle and those that manifest as slow changes lasting several seconds.
Typically, Fast Fourier Transform (FFT) which is a computationally efficient implementation of DFT is used. DFT-based features have been used with clas-sifiers such as neural networks, Bayesian networks and rule based systems for PQ disturbance classification. Chai [10] proposed a method that used amplitude estimates of 20 spectral components obtained using FFTs. These features served as inputs to a Bayes linear classifier. Chai limited the analysis to voltage signals. Dash [11] outlined an approach that used Fourier coefficients obtained from volt-age signals and a linear combiner based on Adaline neuron [12] to extract features. These features were then processed by a fuzzy rule based system to classify dis-turbances. Liao [13] described a method for voltage disturbance analysis that used DFT based features and wavelet coefficients as inputs to a fuzzy rule based expert system.
2.2.1.4 Time-frequency analysis
Time-frequency analysis have gained popularity in recent years because they offer time localization of different frequency components present in the sig-nal being asig-nalyzed. With DFTs no time domain information is provided. This is especially useful when the component frequencies of the signal being analyzed
change over time and for transient detection. Time-frequency analysis techniques such as Short Term Fourier Transforms (STFT), Continuous Wavelet Transforms (CWT), Gabor transforms and Wigner-ville distribution provide a way to com-pute time-frequency distributions that helps to track different frequency compo-nents over time [14]. Most of these techniques work by allowing the window over which different frequency components are computed to be changed. One main drawback of time-frequency based methods over DFTs is increased computational complexity.
A time-frequency analysis technique that has often been used for PQ distur-bance analysis is the S-Transform [15]. S-Transform is an extention of CWT. Reddy [16] recommended the use of S-Transforms for PQ disturbance analysis and pro-vided proof of their superiority over STFT and Wavelet Transforms based on vi-sual analysis. Reddy, did not, however describe a method for automatic classifi-cation. Chilukuri [17] proposed a method based on S-Transforms. Chilukuri used features derived from time-frequency matrices obtained by applying a discrete version of a S-Transform on voltage signals. These features were analyzed by a fuzzy rule based classifier to automatically classify PQ disturbances. Shangwei [18] presented an approach that used a S-Transform for feature extraction. Shang-wei used Support Vector Machine (SVM) to analyze the features and classify PQ disturbances.
2.2.1.5 Multiresolution analysis
Multiresolution analysis (MRA), as the name suggests, works by decom-posing a signal into various levels of approximation or resolutions [19]. MRA allows the signal to be studied at various resolutions without losing time domain information. Rapid changes in the signal can be studied at higher resolutions
while slow changes may be studied at lower resolutions. Wavelet decomposi-tion is the primary tool used in MRA. An efficient implementadecomposi-tion of wavelet decomposition, Discrete Wavelet Transform (DWT) is used for practical applica-tions. DWT uses filter banks and decimation to recursively decompose signals into frequency bands. High frequency bands have higher resolution (i.e. sam-pling rate) while lower frequency bands have lower resolution. Features obtained from decomposed signals (also called coefficients) have been used as inputs to PQ disturbances classifiers. The filter banks used in DWT are derived based on a mother wavelet that will be used for analysis. One of the challenges in using DWT is the choice of mother wavelet best suited for the problem at hand. A dan-ger in this approach is the possibility of selecting a mother wavelet too specific to a particular dataset.
Wavelet transforms have been used in combination with different classifica-tion techniques for PQ disturbance classificaclassifica-tion. Wavelet transforms have been found most successful in detecting transients and short duration PQ disturbances. Santoso [20] showed that MRA can be used for PQ disturbance identification. He used Daubechies wavelet for the analysis. Santoso’s work laid the foundation for further research using DWT as a feature extraction technique for PQ disturbance classification. Santoso [21, 22] also developed a classification approach that used wavelets for feature extraction and neural networks [23] for classification. Santoso used only voltage waveforms collected from monitoring units and restricted the analysis to capacitor transients, impulse transients, sags and interruptions. Elmit-wally [24] used wavelet based features as inputs to a neuro-fuzzy classifier [25]. He used simulated data for testing the classification scheme and restricted the analysis to voltage signal. Chung [26] used wavelet packet based decomposition, which is an extension of DWT [27] for feature extraction. Chung then used
Hid-den Markov Modeling (HMM) [28] to determine the likelihood of a disturbance type based on the features. Chung used, wavelet and HMM based classifier only for capacitor and impulse transients. He used RMS features for sags and interrup-tions. Abdel-Galil [29] also proposed a similar approach based on wavelets and HMM. Zang [30] and Kocaman [31] proposed using DWT as feature extractors for Support Vector Machine (SVM) based classifier. Intrestingly Kocaman restricted the analysis to slow voltage changes such as sags and swells.
Recently, several methods that use wavelet-based features as inputs to fuzzy rule based classifiers [32] have been proposed [13, 33, 34, 35]. All these methods analyzed voltage signals, but differed in their choice of wavelets, how the wavelet coefficients are processed to obtain features, and the rule base. In each case, the rules were framed based on expert knowledge. Abdel-Galil [36], took a different approach, using C4.5, a decision tree based inductive learning method to generate rules. His analysis still used used wavelets to extract features and limited the analysis to voltage signals.
It can be seen that a wide range of feature extraction techniques have been applied for power disturbance classification. In most of these approaches, the choice of features have been based on expert knowledge. Almost all the features have been extracted from voltage signals. Different classification techniques have been used with the above feature extraction techniques. Following section will discuss these classification techniques.
2.2.2 Classification Techniques
Classification techniques that have been used for PQ disturbance analy-sis fall under three broad categories; logic based methods (e.g., rule based ap-proaches), probabilistic methods (e.g., naive Bayes classifier, hidden Markov
mod-els) and statistical learning methods (neural networks, support vector machines, decision trees). These methods try to mimic the human abilities of reasoning, problem solving, learning and decision making.
2.2.2.1 Logic based methods
Logic based methods use If-Then rules to represent expert knowledge. User inputs and/or features extracted from measurements serve as inputs. An inference engine then classifies data based on rules and inputs. Such methods are also called expert systems. Kazibwe [37] proposed an expert system based on If-Then rules that diagnosed power quality problems using user inputs com-bined with voltage and current measurements. Kazibwe’s method’s reliance on human input represented a significant shortcoming. Styvaktakis [7] developed an expert system to automatically classify power system events and offer infor-mation in terms of power quality. The expert system used voltage measurements only and was capable of distinguishing different types of voltage dips, voltage steps and interruptions. Styvaktakis used Kalman filtering to detect and quantify changes in the three-phase voltages by assigning a detection index. These detec-tion indices served as inputs to a rule based classificadetec-tion module that classified the event. Styvaktakis’s method was limited to analyzing voltage disturbances. While this method could identify voltage disturbances caused by overcurrents, inrushes, large motor starts, and voltage steps, it was not capable of detecting arc-ing and capacitor related problems. Styvaktakis’s method did not provide event specific information such as current magnitudes, load lost and VAR step sizes that are needed to identify the source of the disturbance.
Recently, several methods of PQ disturbance classification based on fuzzy ex-pert systems have been proposed [25, 11, 24, 17, 33, 13, 34, 35]. Fuzzy logic based
expert system is a generalization of simple If-Then rule based systems that use binary logic. In fuzzy logic, truth is not restricted to discrete true (1) and false (0) values, but allows truth values to be in the closed interval [0,1]. Such expert sys-tems help to better model expert knowledge and human approximate reasoning. None of these methods try to classify power system events based on their under-lying cause. Moreover, these methods employ a few simple fuzzy rules, and do not provide the necessary foundation required to design a large scale classifier such as the one proposed in this dissertation.
2.2.2.2 Probabilistic methods
Power system event analysis often requires reasoning under incomplete or uncertain information. Incomplete information may be caused by faulty sen-sors, or because some signals were not measured. Uncertainties can be introduced by noise inherent to the power system and sensors or due to the dynamics of the power system. Probabilistic methods are well suited for reasoning under uncer-tainty [38]. Bayesian methods and hidden Markov models are probabilistic classi-fication methods that have been used for PQ disturbance classiclassi-fication. Bayesian methods use Bayes theorem to determine the probability with which an observed event belongs to a disturbance category based on extracted features. Chai [10] used Bayes theorem to generate a linear discrimination function for voltage dis-turbance classification with features extracted using FFTs. Wang [39] designed a classifier based on Bayes theorem and used wavelet packet decomposition for extracting input features for the classifier. Wang assumed an underlying Gaus-sian distribution and used only voltage signals. Unlike BayeGaus-sian networks, Bayes methods do not allow causal relationship between the features and the distur-bance categories to be explicitly specified. Bayes methods rely on empirical
mea-surements made from training data to estimate conditional probabilities. For this purpose they often assume an underlying probability distribution. Such assump-tions may not always be correct or optimal.
Hidden Markov model (HMM) is another probabilistic classification method that has been used for PQ disturbance analysis. HMMs have been proved to be effective in temporal pattern classification [28]. HMMs assume the underlying process to be a Markov process with hidden states and only the outputs that are dependent on the hidden states are visible. Typically HMM based models are constructed for each PQ disturbance class. Observed PQ measurements are com-pared to those generated by the HMM based models. The PQ disturbances are then assigned the class of the model that most accurately matches the measure-ments. Abdel [29] proposed a HMM based approach for PQ disturbance classifi-cation using FFT and DWT to extract features vectors. These feature vectors rep-resented the observable outputs. Abdel used Vector Quantization (VQ) to map the feature vectors into more manageable discrete output states, and constructed HMM-based models based on the feature vectors during the training stage. Ab-del then compared new observations those generated by the moAb-dels and used the model with closest match to label the PQ disturbance. Chung [26] used a simi-lar approach based on Wavelet Packet (WP) coefficients and HMM. He used this approach only for disturbances involving high frequencies, however. Both Abdel and Chung restricted their analysis to voltage signals from simulated data and did not try to classify the disturbances based on their cause.
2.2.2.3 Statistical learning methods
Statistical learning methods can be considered as supervised learning pro-cedures that group observations based on one or more characteristic features of
the observation. To accomplish this, they use a training set that comprised of observations that have already been labeled as belonging to a group. Statisti-cal learning methods such as neural networks, decision trees, and support vec-tor machines have been used for PQ disturbance classification. Artificial neural networks (ANN) are simple yet powerful tools for pattern classification. Feed-forward neural networks can be used to model complex and non-linear input-output relationships. This, combined with their relative ease of implementation has made them a popular choice for pattern classification. Neural networks have typically been combined with a feature extraction technique such as wavelets for PQ disturbance identification. Santoso [21, 22] used a Learning Vector Quanti-zation network (LVQ) as a pattern classifier for PQ disturbances. LVQs are a supervised version of self organizing maps. Santoso used wavelets for feature extraction, and these features served as inputs to the LVQ network. Reaz [34] used DWT for feature extraction with a Univariate Randomly Optimized Neural Network (URONN) and fuzzy logic for PQ disturbance classification. URONN is a variation of an adaptive neural network that uses randomized weight selection based on classification error. Reaz used URONN to tune membership parame-ters of a fuzzy rule based system. Elmitwally [24] used a similar method for PQ disturbance classification except that he used a backpropagation instead of ran-domized weight selection for training the neural network. Even though neural networks have been preferred for their ease of implementation, their black box na-ture makes it very hard to either encode or infer knowledge from them. Another big disadvantage of using neural networks is that they are prone to overfitting. Considerable effort and a very large training set would be required to reliably use them for large scale power system event classification. Support Vector Machines (SVM) have been used for PQ disturbance classification to overcome some of the
disadvantages of neural networks.
SVMs [40] are another supervised learning technique that are good at solving classification problems that require non-linear decision boundaries. They project features into higher dimensional feature spaces and construct linear decision bound-aries in this higher dimensional feature space. This approach allows them to achieve global optima as they are always searching a convex surface. Janik [41] used DWT for feature extraction and constructed a Gaussian kernel based SVM to classify simulated PQ disturbance signals. Zang [30] and Kocaman [31] also proposed similar methods based on DWT and SVM for PQ disturbance classifi-cation. While SVM based classifiers are good at handling non-linear classification problems, they have been used primarily for classification problems with small samples. Their computational complexity makes them difficult to use for large scale classification problems [42]. SVMs also have the disadvantage of being a black box approach, making it hard to decode knowledge from trained SVMs.
While ANN and SVM approaches employ a black box approach, decision trees are a straightforward and easily understood alternative where decision trees are constructed from training data. Decision trees have been used for pattern classifi-cation for their simplicity and easy to interpret nature. Abdel-Galil [36] used C4.5, a decision tree based algorithm for classification of PQ disturbance. Decision tree algorithms are better suited for categorical data and are not very good for classi-fying continuous data as often encountered in PQ domain. Decision trees are also prone to instability and can produce widely varying trees based on the order in which training samples are presented.
It is clear from prior literature that PQ disturbance classification systems sel-dom try to identify the component or components that caused the PQ disturbance. To address this issue, methods to identify a specific problematic component or
specific type of disturbance based on its cause have been proposed. 2.3 Literature Review of Specific Event Identification Methods
In contrast to PQ disturbance classification methods, specific event iden-tification methods focus on a specific problematic component or a specific type of disturbance. There are numerous power system components such as capaci-tors, Load Tap Changers (LTCs), transformers, insulacapaci-tors, conductors etc. Multi-ple methods to identify problems in these components can be found in literature. It is not possible to review each of these methods. Since this research focuses on non intrusive, substation based measurement and analysis of electrical signals, only a subset of specific event identification methods that use non-intrusive sub-station based electrical measurements are reviewed here. The following specific event identification methods are discussed here:
• Overcurrent (OC) identification.
• Arcing and High Impedance Fault (HIF) identification. • Capacitor switching identification.
The above specific event identification methods together make up the major-ity of specific event identification methods for power distribution systems found in the literature. Each of these methods are reviewed further in the following paragraphs.
2.3.1 Overcurrent Identification
Out of all specific event identification methods, overcurrent fault (bolted fault) identification has gained the most attention. One of the reasons for this is that overcurrents identification algorithms are an integral part of protective re-laying. Recently, research on overcurrent identification and location has gained
traction from a reliability viewpoint. Timely detection and location of overcurrent events help reduce outage duration and possibly avoid the recurrence of overcur-rents if a faulty component can be identified. Since this research focuses on iden-tifying events based on their cause and providing information that helps to locate problematic components, overcurrent identification and location algorithms that fit this profile, will be reviewed here.
Most fault location schemes assume that an event has already been identified as overcurrent. To truly automate fault location and reporting, a classifier that can differentiate overcurrent events from other power system events should also be incorporated into the fault location scheme. Algorithms that can both determine disturbances to be overcurrent and subsequently attempt to locate them are diffi-cult to find in the literature. For example, impedance based fault location schemes like the one proposed by Girgis [43] required the fault and the fault type to be identified prior to being used for fault location. Girgis’s fault location scheme also requires that the feeder topology, load and line impedances to be known. Use of power quality monitors (PQ monitors) has gained popularity and hence meth-ods that use the data collected from these monitors such as [44] have also been proposed. Sabin [45] demonstrated a impedance based fault location method on Consolidated Edison underground primary distribution system. Sabin differen-tiated overcurrents from inrushes using harmonics. He used data from PQ mon-itors and also built a detailed model of the distribution system. Obtaining and maintaining feeder topology information and impedance information is big draw back of impedance based fault location schemes. It is both tedious and expensive to gather such data for large scale use of these algorithms.
Traveling wave based fault location schemes for distribution systems such as the one proposed by Thomas [46] do not need feeder topology or impedance
infor-mation. These methods use fault recorders that record voltage and current sam-ples at a very high sampling rate (around 1.0Mhz). Then they use information con-tained in the high frequency components of incident and reflected waves to deter-mine fault location. Like the impedance based approach, these algorithms do not try to distinguish between transients caused by faults and those caused by other factors such as capacitor switching. Traveling wave based methods are more com-mon in transmission systems that exhibit simple topologies and are harder to use with distribution systems which exhibit a branching topology. Other than these conventional approaches, expert system based methods [47, 48, 49], fuzzy logic based methods [50, 51, 52, 53], probabilistic reasoning based methods [54, 55, 56] and statistical learning based [57, 58, 59, 60] methods have also been proposed for fault location. These methods also suffer the shortcomings of conventional methods. The shortcomings being, they either assume that that an overcurrent event has been detected or they rely on feeder specific information such as feeder topology, line impedances or information from SCADA or AMR being available.
2.3.2 Arcing and High Impedance Fault (HIF) Identification
Arcing faults have always been a hard to detect problem on electrical power systems. Unlike bolted overcurrent faults, arcing faults are often intermit-tent, and seldom cause protective devices to operate. Arcing may continue indefi-nitely without progressing to a sustained fault that draws high enough current to operate a traditional protective device, or to be noticed by the public. Such incip-ient arcing conditions are a safety hazard to utility crews and the public. Defini-tive characterization of the nature of downed conductor arcing arcing faults on medium voltage feeders was performed in the late 1970s through 1990s by Rus-sell, et al. [61, 62, 63, 64, 65] . The extensive research performed to characterize
and detect arcing faults on medium voltage systems has been summarized by Sedighizadeh, et al [66]. One important distinction between these arcing fault de-tection methodologies and the methodology outlined in this research [67] is that, the methodology outlined in this research has a wider scope, and is capable of detecting other abnormal conditions such as, but not limited to, recurrent over-currents and capacitor related problems.
2.3.3 Capacitor Bank Switching Identification
Capacitors banks are used to provide voltage and VAR support on dis-tribution system feeders, and are common devices in power disdis-tribution feeders. Due to their ubiquitous nature, capacitor banks are also most prone to failures [68]. Capacitor banks can exhibit a variety of abnormal conditions such as un-balanced operations, restrikes, switch bounce, arcing and repeated cycling due to faulty controllers. However, there is no single method available for detecting all of these conditions. For example, Lee [69] and Santoso [70] provided meth-ods for detecting unbalanced capacitor operations. However, these methmeth-ods did not detect any other abnormal condition. Socholuliakova [71] presented a method for locating capacitor banks based on voltage transients. However, this method did not differentiate transients caused by normal capacitor switching form those caused by abnormal switching. Khani [72] proposed a method for location and position position identification of capacitor banks based on current and voltage measurements. However, this method did provide a mechanism for detecting ab-normal switching of capacitor banks. This research proposes a methodology for detecting various abnormal capacitor operations and also providing information that may help in locating a problematic capacitor bank.
2.4 Chapter Summary
In this chapter, the lack of prior art for identifying power system events based on their underlying cause was shown. Existing power quality disturbance classification methods were reviewed. In addition, the shortcomings of existing PQ disturbance classification methods were pointed out. Existing methods for identifying overcurrent, arcing and capacitor switching events were reviewed, and their shortcomings were also discussed. This dissertation addresses the short-comings of current methodologies and presents a new methodology to classify and report a wide variety of power system events based on their underlying cause.
3. PROBLEM FORMULATION
3.1 Introduction
The main objective of an electricity supply system is to to supply power that is both reliable and economical, while keeping up with the ever increasing demand for energy. Electrical power originates at a generation station and is transmitted to a load by a system of conductors and other equipment that make up an electri-cal power system. Transmission lines carry bulk power from generators to bulk power, higher voltage substations.
The electric power distribution system is the part of an electric utility system between the bulk power source and the consumers’ point of delivery [73]. Fig-ure 3.1 shows a simplified diagram of a typical distribution system. Distribution systems can be divided in various parts, namely, subtransmission circuits, dis-tribution substations, disdis-tribution or primary feeders, disdis-tribution transformers, secondary circuits and service drops. The subtransmission circuits deliver energy from the bulk power sources to the various distribution substations located in the load area. The subtransmission voltage is usually between 12.5 and 245 kV. The distribution substation consists of one or more power transformer banks together with the necessary equipment and switchgear to reduce the subtransmission volt-age to a lower primary system voltvolt-age for local distribution.
Each distribution substation serves its own load area. The area served by the distribution substation is subdivided and a primary feeder, usually operating in the range of 4.6 to 34.5kV, supplies each subdivision. The primary feeder normally consists of either a three-phase, three-wire or a three-phase, four-wire main that runs from the substation to the load center where it branches into three-phase
feeders and single-phase laterals. The distribution transformers are connected to the primary feeders, subfeeders, and laterals usually through fused cutouts, and supply the radial secondary circuits to which the consumers’ services are con-nected.
The equipment, components, and other apparatus that makes up a power dis-tribution system includes wires, cables, switches, reclosers, insulators, capacitors, etc. As the result of causes such as contact of a conductor by vegetation or due to aging, apparatus can fail or cease to operate normally. Sometimes a failure of apparatus causes an abnormally high current that can further damage the dis-tribution system, injure members of the public or utility personnel, or damage customer devices and equipment. In addition to physical damage, failures often result in degraded power quality, or loss of electric service.
Distribution systems are designed with components, known as protective de-vices, which interrupt high current flows, preventing damage to the system and potential safety hazards. For example, a relay or recloser is a type of protective device which monitors a circuit and opens a circuit breaker when the current mag-nitude exceeds a specified threshold for a set duration. When the thresholds are met, the device operates, and power is interrupted to end users.
In many cases, the device recloses to restore power after a predetermined time period. If the failure is still present, power may be interrupted again. In this manner, several power interruptions can result from the same cause. These inter-ruptions may happen either in close succession or spread over an indeterminate period of time. In other cases, failure of an apparatus may cause a power outage. In some other cases, the faulty apparatus may continue to operate abnormally fashion without causing any interruptions but may cause severe disturbances that may affect other equipment present in the power distribution system.
When an outage occurs, failing or failed apparatus often must be repaired or replaced before normal, reliable operation can be restored. When sustained inter-ruptions occur, electrical power system operators such as utility companies must make repairs. Sustained interruptions often occur during “non-business hours,” often increasing interruption duration and the expense of restoration. Repairs made in this manner are often more troublesome and expensive than if they could have been planned in advance. In addition, if repairs can be made before a power outage occurs, overall service is more reliable and of higher quality, and inconve-niences and economic losses to customers may be avoided. Therefore, it is prefer-able to identify failures, incipient failures, and other improper or suboptimal oper-ating conditions of power system apparatus before these conditions affect power quality or cause momentary interruptions or sustained power outages.
Utilities may utilize a variety of methods to reduce the number of power in-terruptions and outages that occur. Conventional methods vary by utility, but generally fall into two categories: a) physically examining and/or testing individ-ual apparatus periodically in an effort to determine whether they are likely to fail and cause a power outage or power quality problems and b) replacing appara-tus according to a predetermined schedule. Problems exist with both approaches. One significant problem is that examining, testing, and/or replacing large number of individual devices can be time-consuming, expensive, and difficult to sched-ule without interruption power to the end users. Another problem with the sec-ond approach is that, when apparatus are replaced according to a predetermined schedule, they may be replaced when they are functioning normally, well before any failure actually begins. Alternatively, they may not be replaced in sufficient time to avoid an outage. Further periodic maintenance or replacements actually can inadvertently introduce problems that did not previously exist. Clearly it
![Figure 3.1: One-line Diagram of a Typical Distribution System [73]](https://thumb-us.123doks.com/thumbv2/123dok_us/781381.2598816/47.918.160.784.213.936/figure-line-diagram-typical-distribution.webp)