Matthew Volovski, Eleni Bardaka, Zhibo Zhang,
Bismark Agbelie, Samuel Labi, Kumares C. Sinha
Indiana State Highway Cost Allocation
and Revenue Attribution Study and
Estimation of Travel by Out-of-State
Vehicles on Indiana Highways
JOINT TRANSPORTATION
RESEARCH PROGRAM
INDIANA DEPARTMENT OF TRANSPORTATION AND PURDUE UNIVERSITY1.90 1.60 1.30 1.00 0.70 0.40 0.10 1 2 3 4 5 6 7 8 9 10 11 12 13 FHWA Vehicle Class
1.90 1.60 1.30 1.00 0.70 0.40 0.10 Equity Ratio 1 2 3 4 5 6 7 8 9 10 11 12 13
RECOMMENDED CITATION
Volovski, M., Bardaka, E., Zhang, Z., Agbelie, B., Labi, S., & Sinha, K. C. (2015).
Indiana state highway cost allocation and
revenue attribution study and estimation of travel by out-of-state vehicles on Indiana highways
(Joint Transportation
Research Program Publication No. FHWA/IN/JTRP-2015/12). West Lafayette, IN: Purdue University. http://dx.doi
.org/10.5703/1288284315709
AUTHORS
Matthew Volovski
Eleni Bardaka
Zhibo Zhang
Graduate Research Assistants
Lyles School of Civil Engineering, Purdue University
Bismark Agbelie, PhD
Post-Doctoral Research Fellow
Lyles School of Civil Engineering, Purdue University
Samuel Labi, PhD
Associate Professor of Civil Engineering
Lyles School of Civil Engineering, Purdue University
(765) 494-5926
[email protected]
Corresponding Author
ACKNOWLEDGMENTS
The authors of this final report acknowledge the valuable support and guidance provided by the members of the
Study Advisory Committee: Messrs. Dan Brassard, Mark Ratliff, John Weinmann, and Samy Noureldin, as well as
the assistance of the following INDOT personnel in the acquisition of data: Messrs. Greg Curson, Mike Jenkins, Bob
Allman, John Weaver, Ms. Melody Coleman, and Ms. Karen Hicks. Additionally, the authors are grateful to Dr. Jose
Weissmann of the University of Texas at San Antonio for providing useful information for the study. We are also
grateful to the JTRP staff for their overall administrative support. Finally, we thank Dr. Bobby McCullouch of LTAP for
providing data on the local road system and Ms. Qing Ye for general help in the data processing.
JOINT TRANSPORTATION RESEARCH PROGRAM
The Joint Transportation Research Program serves as a vehicle for INDOT collaboration with higher education
institutions and industry in Indiana to facilitate innovation that results in continuous improvement in the planning,
design, construction, operation, management and economic efficiency of the Indiana transportation infrastructure.
https://engineering.purdue.edu/JTRP/index_html
Published reports of the Joint Transportation Research Program are available at: http://docs.lib.purdue.edu/jtrp/
NOTICE
The contents of this report reflect the views of the authors, who are responsible for the facts and accuracy of the data
presented herein. The contents do not necessarily reflect the official views or policies of the Indiana Department of
Transportation (INDOT). The details in this report are intended for reference only, not as specifications or design
guidance. In the event that any information presented herein conflicts with the Indiana Design Manual, INDOT
Standard Specifications, or other INDOT policy, said policy will take precedence.
COPYRIGHT
Copyright 2015 by Purdue University. All rights reserved.
Print ISBN: 978-1-62260-358-9
Kumares C. Sinha, PhD
Olson Distinguished Professor of Civil Engineering
Lyles School of Civil Engineering, Purdue University
(765) 494-2211
[email protected]
TECHNICAL REPORT STANDARD TITLE PAGE
1. Report No. 2. Government Accession No. 3. Recipient's Catalog No.
FHWA/IN/JTRP‐2015/12
4. Title and Subtitle
Indiana State Highway Cost Allocation and Revenue Attribution Study and Estimation of Travel by Out‐of‐State Vehicles on Indiana Highways
5.Report Date
June 2015
6. Performing Organization Code
7. Author(s)
Matthew Volovski, Eleni Bardaka, Zhibo Zhang, Bismark Agbelie, Samuel Labi, Kumares C. Sinha
8. Performing Organization Report No.
FHWA/IN/JTRP‐2015/12
9. Performing Organization Name and Address
Joint Transportation Research Program Purdue University
550 Stadium Mall Drive West Lafayette, IN 47907‐2051
10. Work Unit No.
11. Contract or Grant No.
SPR‐3704
12. Sponsoring Agency Name and Address
Indiana Department of Transportation State Office Building
100 North Senate Avenue Indianapolis, IN 46204
13. Type of Report and Period Covered
Final Report
14. Sponsoring Agency Code
15. Supplementary Notes
Prepared in cooperation with the Indiana Department of Transportation and Federal Highway Administration.
16. Abstract
This study was commissioned by INDOT to investigate the cost responsibility and the revenue contribution of highway users with regard to the
upkeep of Indiana’s state and local highway infrastructure (pavements, bridges, safety assets, and mobility assets). The costs consisted of
expenditures on construction, preservation, maintenance, and operations of the highway infrastructure. For revenues, user and non‐user sources
were considered. The highway users were represented by the 13 FHWA vehicle classes, and the study was based on 2009‐2012 data on
expenditures and revenues. The study framework duly recognized the dichotomy between attributable and common costs. For allocating the
attributable costs to the vehicle classes, ESALs, AASHTO loading equivalents, and PCEs were used; for allocating common costs, VMT was used.
For each vehicle class, the share of revenue contribution was compared to the share of cost responsibility to determine respective equity ratios
and thus to ascertain the extent to which vehicles in each class may be underpaying or overpaying their cost responsibilities at the current time.
The study also determined the distribution of fuel purchases and travel by out‐of‐state vehicles on Indiana’s highways; this analysis was required
to further refine the results of the cost allocation and also to quantify the magnitude of any imbalance between the out‐of‐state travel and share
of consumption on Indiana’s infrastructure and the revenue from such out‐of‐state vehicles.
The outcome of this research is a systematic documentation of the sources and extents of highway revenues and the areas of expenditures
at the local and state levels in Indiana. Pavement and bridge expenditures were found to have a dominant share of the overall expenditures on
Indiana’s highway system. Classes 2 (automobiles) and 9 (5‐axle combination trucks) were found to have a dominant share of the cost
responsibilities. It was determined that the user revenue sources contributed approximately 63.5% of the total state funding for highway
expenditures and 36.5% were from non‐user revenue sources. The inability of user revenue sources to cover the total highway expenditure and
the consequent partial reliance on non‐user sources seem to constitute a rather unstable funding situation particularly because the non‐user
sources are characterized by significant variability. On the basis of the expenditures and revenues associated with the various user groups
(vehicle classes) over the analysis period, this study found that inequities exist, albeit in varying degrees, among the highway user groups. Of the
13 vehicle classes, classes 1–4 were found to be overpaying their cost responsibilities while classes 5–13 are underpaying. For example, vehicle
class 2 is overpaying its cost responsibility by 10% while vehicle class 9 is underpaying by 19%. The results of the equity analysis are generally
consistent with those of studies carried out at other states. Also, it was estimated that the travel by out‐of‐state vehicles on Indiana’s interstates,
NHS non‐interstates, non‐NHS and local roads are 21%, 10%, 9%, and 7% respectively, of the total travel as a percentage of VMT on those families
of highway systems.
17. Key Words
cost allocation, revenue, expenditure, equity
18. Distribution Statement
No restrictions. This document is available to the public through the National Technical Information Service, Springfield, VA 22161.
19. Security Classif. (of this report)
Unclassified
20. Security Classif. (of this page) Unclassified 21. No. of Pages 266 22. Price
EXECUTIVE SUMMARY
INDIANA STATE HIGHWAY COST ALLOCATION AND REVENUE ATTRIBUTION
STUDY AND ESTIMATION OF TRAVEL BY OUT-OF-STATE VEHICLES ON
INDIANA HIGHWAYS
This study was commissioned by INDOT to investigate the cost responsibilities and revenue contributions of highway users with regard to the upkeep of the highway infrastructure. The costs consisted of expenditures on construction, preservation, main-tenance, and operation of the infrastructure at both state and local levels. For revenues, user and non-user sources at federal, state, and local levels were considered. User sources included fuel tax, motor carrier surcharge tax, motor carrier fuel use tax, vehicle registration fees, driver license fees, taxes on truck and trailer sales, tires, and heavy vehicle use, county motor vehicle excise surtaxes, and wheel taxes. The asset types included pavements, bridges, and safety and mobility assets. The highway users were represented by the 13 FHWA vehicle classes, and the study was based on 2009–2012 data on expenditures and revenues. The study framework duly recognized the dichotomy between attributable and common costs: for allocating the attributable costs to the vehicle classes, ESALs, AASHTO load equivalency factors, and PCEs were used; for allocating common costs, VMT was used. For each vehicle class, the share of revenue contribution was compared to the share of cost responsibility to determine the equity ratio and thus to ascertain the extent to which vehicles in each class may be underpaying or overpaying their cost responsibilities. The study also determined the distribution of fuel purchases and travel by out-of-state vehicles on Indiana highways. Pavement and bridge expenditures were found to represent a dominant share of the overall expenditures. With regard to vehicle class, classes 2 and 9 were found to dominate the cost responsibility.
Of the total revenue, approximately 64%was from user sources while 36% were from non-user sources. On the basis of the expenditures and revenues associated with various vehicle classes, inequities were found to exist, albeit in different directions and degrees, among the highway user groups. Of the 13 vehicle classes, classes 1–4 were found to be overpaying their cost responsibilities while classes 5–13 are underpaying. For example, vehicle class 2 is overpaying its cost responsibility by 10%while vehicle class 9 is underpaying by 19%. The results of the equity analysis are consistent with those of studies carried out at other states. It was also estimated that the travel by out-of-state vehicles on Indiana’s interstates, NHS non-interstates, non-NHS and local roads, as a percentage of total travel on these road classes, is approximately 21%, 10%, 9%, and 7% respectively, of the total travel as a percentage of VMT on those families of highway systems.
In Indiana, as in most other states, highways are financed primarily by taxes and fees paid by the state’s highway users. However, in recent years, funding from user fees had declined steadily and a significant portion of the highway had to be augmented by non-user sources of revenue, such as federal economic stimulus and Indiana’s Major Moves funds. The present study quantifies the extent of non-user revenues needed to support highway construction and maintenance activities at the state and local levels. The results of the study can be used to revise the existing user fee structure and or to assess new sources of revenue. A basic principle of user-fee structure design is that efforts must be made to achieve not only equity among the users but also adequacy of the revenue amount. Therefore, the study results can be used directly to perform an evaluation of the alternatives for restructuring the user fees in Indiana. The information of the extent of travel by out-of-state vehicles on Indiana highways can serve as a critical input in reviewing any change in user fees by addressing the question of whether revenues from any individual highway revenue mechanism should come solely from Indiana residents or all road users in the Indiana.
CONTENTS
PART 1. BACKGROUND . . . 1
1.1 Study Motivation and Objectives . . . 1
1.2 Report Organization . . . 1
1.3 Review of the Literature . . . 1
PART 2. ASSESSMENT OF SYSTEM USAGE . . . 3
PART 3. COST ALLOCATION FOR STATE ROUTES . . . 4
3.1 Pavement Expenditures on State Routes . . . 4
3.2 Bridge Expenditures on State Routes . . . 6
3.3 Safety, Mobility, and Other Expenditures . . . 6
PART 4. COST ALLOCATION FOR LOCAL ROUTES . . . 7
4.1 Pavement Expenditures on Local Routes . . . 7
4.2 Bridge Expenditures on Local Routes . . . 8
PART 5. REVENUE ANALYSIS . . . 9
5.1 Background . . . 9
5.2 User Revenue Attribution . . . 9
PART 6. EQUITY ANALYSIS . . . 10
6.1 Equity Ratios. . . 10
PART 7. TRAVEL BY OUT-OF-STATE VEHICLES . . . 11
7.1 Background . . . 11
7.2 Gasoline Vehicles . . . 12
7.3 Diesel Vehicles . . . 12
7.4 Summary of Travel by Out-of-State Vehicles . . . 12
PART 8. REPORT SUMMARY . . . 13
LIST OF TABLES
Table Page
Table 1.1Summary of Major Studies on Highway Pavement Cost Allocation Methodologies 1
Table 1.2Summary of Major Studies on Highway Bridge Cost Allocation Methodologies 2
Table 2.1Annual VMT by Road Functional Class 4
Table 5.1Four-Year Total Annual Highway Revenues in $ Millions: FY 2009–FY 2012 9
Table 5.2Highway User Revenues in Indiana: FY 2009–FY 2012 10
Table 6.1User Equity Ratios for the Indiana State and Local Routes: FY 2009–FY 2012 11
LIST OF FIGURES
Figure Page
Figure 2.1FHWA vehicle classification system 4
Figure 3.1Average annual unit cost for pavement expenditures on state routes, 2009–2012 5 Figure 3.2Average annual unit cost for bridge expenditures on state routes, 2009–2012 7 Figure 3.3Average annual unit cost for safety, mobility and other expenditures on state routes, 2009–2012 7 Figure 4.1Average annual unit cost ($/VMT) for road expenditures on local routes, 2009–2012 8 Figure 4.2Average annual unit cost ($/VMT) for bridge expenditures on local routes, 2009–2012 9 Figure 6.1Revenue contribution and cost responsibility (state and local routes), FY 2009–FY 2012 11 Figure 8.1Average unit cost of all expenditures for state and local routes combined, 2009–2012 14
PART 1. BACKGROUND
1.1 Study Motivation and Objectives
The current federal transportation act, Moving Ahead for Progress in the 21st Century (MAP-21), requires the USDOT to establish performance measures for state highway agencies (SHAs) that must be met and reported biennially to the USDOT as a requirement for continued federal aid funding for surface transportation projects. To achieve these targets, SHAs are required to conduct a biennial assessment of revenues obtained directly or indirectly from users and other sources. This assessment is important for determining the sources and extents of such revenues and the areas of expenditures as required at the federal level. Also, this information can assist SHAs in the restructuring of existing user-based tax structures in order to ensure revenue and expenditure equity among highway infrastructure users. A basic principle of user tax equity and a balanced tax structure is to ensure that the revenue derived from each user is equal to the public costs of providing highway services to that user. Although, in practice, it is difficult to achieve such a balance, an examination of the relationship between highway service costs and highway use is the first step in designing an equitable tax structure. In Indiana, as in most states, the construction and main-tenance of that state’s roads and highways are financed primarily by taxes and fees paid by the state’s highway users. Secondly, periodic studies of highway cost allocation for Indiana’s state highways are needed in order for INDOT to stay current with evolving and emerging deve-lopments in expenditure patterns, traffic distributions, and construction technology and materials. Only a detailed analysis of the costs and revenues associated with all vehicle classes can ensure that fair and equitable pricing and financing can be achieved to deliver efficient and equitable highway services.
A companion issue addressed in this highway cost and revenue study is an assessment of the extent of travel by out-of-state vehicles on Indiana highways; such analysis can serve as a critical input in the assessment of highway financing equity by addressing the question
of whether any additional highway revenue should come from general revenue sources contributed solely by Indiana residents or from road users through fuel taxes and other road-use-related fees.
Therefore, the primary objective of this study is to compare the cost responsibility and the revenue contribu-tion of each category of highway users (individual vehicle classes) for the construction, preservation, maintenance, and operation of highways in Indiana on the basis of recent expenditure patterns and revenue types. An addi-tional objective is to determine the distribution of fuel purchases and travel by out-of-state and in-state vehicles on Indiana’s highways.
1.2 Report Organization
This report has two volumes each with 8 parts. Volume I presents an overview of the literature, methodology and key findings. Volume II presents detailed descrip-tions of the data, methodology, analysis and results.
Part 1 of the report details the motivation and objectives of the current study and presents a review of the rele-vant literature. Part 2 describes how the system usage, in terms of traffic volumes, classifications, and weights, were assessed. Parts 3 and 4 present the expenditures for state and local routes, respectively. Part 5 presents the revenue analysis. The results obtained from Parts 3, 4, and 5 were used to carry out the equity analysis which is described in Part 6. Part 7 presents the data collection, analysis, and results for the estimation of travel by out-of-state vehicles. Part 8 is a summary.
1.3 Review of the Literature
The study examined the methodologies and outcomes from the past cost allocation studies at the federal and state levels. The literature review on VMT estimation methodologies was helpful in identifying which meth-ods are appropriate for estimating out-of-state vehicle travel. For pavement cost allocation, Table 1.1 pre-sents a synthesis of the methodologies used in the literature. Some of the most common pavement cost
TABLE 1.1
Summary of Major Studies on Highway Pavement Cost Allocation Methodologies.
Study New-Pavement Cost Allocation M&R Cost Allocation for Existing Pavements
1965 Federal HCAS Traditional Incremental Method VMT or incremental method Maintenance cost not considered 1982 Federal HCAS Minimum Pavement Thickness Method Individual Distress Models
Maintenance cost not considered 1984 Indiana HCAS Thickness Incremental Method Performance-Based Approach
Concept of PSI—ESAL loss was introduced Costs estimated using proportionality assumption 1997 Federal HCAS Minimum Pavement Thickness Method NAPCOM—Individual Distress Models 1999 Arizona HCAS Simplified Model for HCASs (Arizona SMHCAS), Carey (2001)
TABLE 1.2
Summary of Major Studies on Highway Bridge Cost Allocation Methodologies.
State (Year) Cost Category Methodology and/or Cost Allocator
INDIANA (1984) Bridge Construction
Superstructure Incremental design (heavier to lighter) Pile Length related to loading (25%load-related) Pier and abutment Related to deck width
Other substructure components Common costs Excavation and backfill Related to deck width
Drainage pipe Related to deck width
Railing 75%to GVW
Miscellaneous Common costs
Bridge Replacement Same as bridge construction Bridge Rehabilitation Same as bridge construction
Culvert Construction Common costs
Sign Structure Construction Related to vehicle size
FHWA (1997) Bridge Construction
Construction Incremental design / VMT
Preliminary engineering Common cost / VMT
Right of way Common cost / VMT
Other Common cost / VMT
Bridge Replacement Load-related (deficient load-bearing capacity): Incremental design using special bridge replacement function
Non-load-related: VMT
Major Bridge Rehabilitation 13 types of rehabilitation considered Load-related: Incremental design Non-load-related: VMT
Other Bridge Costs Common cost / VMT
ARIZONA (2000) Capacity-Driven Expenditures (Urban) VMT
Strength-Driven Expenditures (Rural) ESAL-Mile
Common Costs VMT
TEXAS (2002) Bridge Costs (construction, rehabilitation, maintenance)
Incremental design 5 climatic regions VMT
MARYLAND (2009) New Bridge Load-related: Incremental design
Bridge Replacement PCE-miles
Major Bridge Rehabilitation
Minor Rehabilitation and Repair PCE-miles
NEVADA (2009) & IDAHO (2010) New Bridge Incremental design
Bridge Replacement Load-related (deficient load-bearing capacity): In-cremental design
Allocated to vehicles that operate at weights over the load-bearing capacities of the bridges to be replaced Bridge Rehabilitation Load-related: VMT by weight
allocators used in past highway cost allocation studies include axle-miles of travel, axle-load-miles, ton-miles, and ESAL-miles. One ESAL is the pavement damage caused by a single axle load at 18,000 lbs. One ESAL-mile is equivalent to one single axle load traveling over one mile.
For bridge cost allocation, Table 1.2 presents a synthesis of bridge cost allocation methodologies that have been used in the literature. Generally, there seems to be relatively little advancements in the state of the art regarding bridge cost allocation methodology. For allocating the costs of new bridge construction, the incremental method has widely been used. In this procedure, the first cost increment for a new bridge identifies the cost of building the bridge to support its own weight, withstand other non-load-related stresses, and carry the lightest vehicle traffic only. This common cost is assigned to all vehicle classes on the basis of their VMT. Subsequent increments identify the added cost of accommodating additional weights. For bridge rehabi-litation cost allocation, past studies considered load and non-load shares for major rehabilitation while minor rehabilitation was assumed to be non-load-related and thus allocated using VMT.
For cost allocation of expenditures related to safety and mobility assets on the highway, most past studies considered the agency costs related to safety and mobility assets as common costs and therefore allocated these costs among the various highway user groups (vehicle classes) on the basis of their contributions to VMT and/or VMT weighted by their passenger car equivalent (PCE). VMT estimation techniques include
those based on traffic data and those not based on traffic data.
PART 2. ASSESSMENT OF SYSTEM USAGE
A reliable assessment of system usage is an indis-pensable component of cost allocation studies. In the current study, highway system usage is quantified in terms of the vehicle miles traveled (VMT) and the vehicle weight (measured either in gross vehicle weight (GVW), or equivalent single axle loads (ESAL)).
The source data for the current study includes 2009– 2012 AADT based on short-term traffic counts for each state route segment and a sample of local (county and municipality) segments. In addition to the AADT data, continuous counts generated from automated traffic recorder (ATR) and weigh-in-motion (WIM) detectors were used to estimate location-specific and road functional class-specific distributions of vehicle class and weight for each of the 13 FHWA vehicle classes (Figure 2.1).
For all state route segments and a sample of local route segments, data on the following traffic characteristics were collected: location/district, route, starting milepost, ending milepost, AADT, truck AADT, road functional group, and national highway system (NHS) classification. The traffic database contained over 8,000 route segments with corresponding short-term traffic counts; these included over 6,000 mainline route segments covering approxi-mately 11,000 centerline-miles and 2,000 ramp segments. For the state route segments, the VMT values were determined on the basis of segment-specific traffic counts. The distribution of vehicle classes at each segment was
TABLE 1.2 (Continued)
State (Year) Cost Category Methodology and/or Cost Allocator
MINNESOTA (2012) New Bridge Incremental design / PCE-miles
Bridge Replacement Load-related (based on inventory rating): Incremental design / PCE-miles Bridge Repair
Special Bridge
Load-related: Incremental design
OREGON (2013) New Structures Bridge Split
Replacement Structures Bridge Split Structures Rehabilitation Bridge Split
Structures Maintenance All VMT
Bridge—All Vehicles Share (no added capacity)
All VMT
Bridge—Over 10,000 Vehicles Share Over 10 VMT Bridge—Over 50,000 Vehicles Share Over 50 VMT Bridge—Over 80,000 Vehicles Share Over 80 VMT Bridge—Over 106,000 Vehicle Share Over 106 VMT Bridge—All Vehicles Share (added capacity) Congested PCE Bridge Replacement with Capacity Bridge Split
interpolated from traffic stream data obtained from the limited number of continuous count stations. Individual segments were then summed to provide an assessment of the total state route VMT for each vehicle class.
The total VMT for all state routes is presented in Table 2.1 (more detailed results are presented in Volume II of this report). The total VMT for local routes was estimated as the difference between the total state route VMT and the estimated state-wide VMT back-calculated from data on fuel sales and fleet fuel efficiency. With regard to the local traffic stream characteristics, the number of local route segments with AADT data was rather limited; therefore, these segments collectively served as a sample for determining the traffic stream characteristics for the entire population of local routes.
Overall, from the traffic volume analysis, and with data on the inventory sizes in terms of mileage of highway segments, it was determined that the amount of travel on the state highway system in 2012 is as follows: NHS-Interstate–16.7 billion VMT; NHS-Non-Interstate–12.7 billion VMT; Non-NHS–9.8 billion VMT. The total travel on the local highway system in 2012 is 31.1 billion VMT. Table 2.1 presents the road inventory and annual VMT by road jurisdiction and functional class.
Lastly, the distribution of gross vehicle weight (GVW) was estimated for interstates and other principal arterials from data obtained from 33 WIM locations in Indiana. FHWA vehicle class 9 (5-axle, 2-unit trucks) comprise the majority of the truck traffic stream for both road func-tional classes. The GVW distribution for class 9 trucks is
characterized by two peaks: the first peak shows that 7.7% of the trucks fall into the 32–36 kip bin which corresponds to a typical, unloaded class 9 vehicle; and the second peak indicates that 9.4% are running at or above 80 kips, which corresponds to a fully-loaded truck. For other principal arterials, the peak in the 32–36 kip range is more pronounced at 11.8%, meaning more trucks are running unloaded. The detailed results for all the heavy vehicle classes are presented in Volume II of this report.
PART 3. COST ALLOCATION FOR STATE ROUTES
The study analyzed the trends in the state highway pavement and bridge expenditures, and the total cost responsibility and average unit cost for each vehicle class and expenditure type were established. The detailed results for all expenditure types are provided in Volume II of this report.
3.1 Pavement Expenditures on State Routes 3.1.1 Allocation of Expenditures on New Pavement Construction
The expenditures associated with new pavement construction are categorized as: (a) pavement-related expenditures, (b) grading and earthwork expenditures, (c) shoulder expenditures, (d) right-of-way (ROW)
Figure 2.1 FHWA vehicle classification system. (Source: FHWA Office of Highway Policy Information.)
TABLE 2.1
Annual VMT by Road Functional Class.
Centerline-Miles Annual VMT (billions)
2009 2010 2011 2012 2009 2010 2011 2012 State: NHS-Interstate 1,418.0 1,443 1,445 1,525 15.68 15.70 16.62 16.69 State: NHS-Non-Interstate 3,364.4 3,307.3 3,241.1 3,108 14.96 14.38 13.15 12.67 State: Non-NHS 6,770.6 6,787.8 6,840.8 6,962 8.06 8.06 8.55 9.81 Local 84,617 84,617 84,689 84,848 32.66 35.61 34.39 32.07 Total 96,170 96,155 96,216 96,443 71.36 73.75 72.70 71.24
expenditures, (e) drainage and erosion control expen-ditures, and (f) miscellaneous.
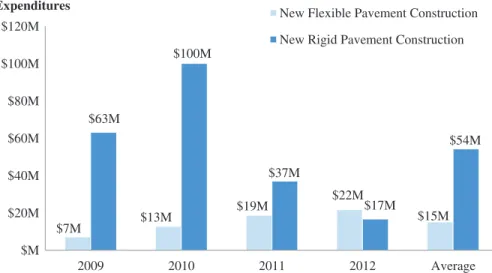
ROW, drainage and erosion control, and miscellaneous expenditures are considered common costs and therefore were allocated to the vehicle classes on the basis of their VMT contributions. For new pavement construction expenditures, the methodology developed by the 1997 and 2000 FHWA HCAS was adopted and the analysis was conducted on a project-by-project basis. The pavement-related expenditures were separated into (1) the expendi-tures of a base facility which serves as a ‘‘platform’’ for the remaining facility, and (2) the expenditures of the remaining facility which provides the strength to carry the projected traffic loading over the pavement life. The base facility expenditures were attributed to vehicle classes on the basis of VMT, after this was adjusted for vehicle width, while the expenditures on the remaining facility were attributed on the basis of ESAL-miles (ESAL-miles were also adjusted for vehicle width). This approach used AASHTO’s 1993 Guide for Design of Pavement Structures’ pavement design method to assign these costs to the vehicle classes. This design method, rather than the MEPDG, was considered appropriate for this study because the new pavements constructed during the period 2009–2012 were planned and designed several years earlier using the design principles of AASHTO (1993); secondly, to date, no HCAS has incorporated MEPDG for attri-buting pavement expenditures in spite of earnest efforts by a number of researchers in that direction.
3.1.2 Allocation of Expenditures on Pavement Rehabilitation
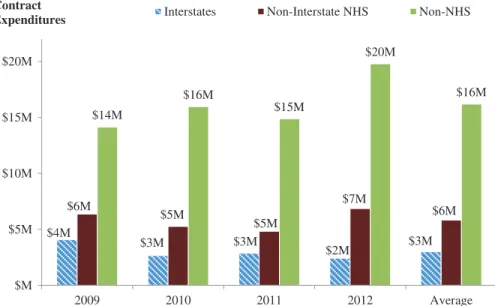
For allocating pavement rehabilitation costs, the expen-ditures associated with such contracts were divided into the following categories: (a) pavement-related expenditures, (b) grading and earthwork expenditures, (c) shoulder expen-ditures, (d) drainage and erosion control expenditures and (f) miscellaneous expenditures. Preservation needs are driven by pavement damage due to traffic and climatic conditions. Thus, a portion of the pavement-related expenditures is attributed to load (traffic) using FHWA’s NAPCOM models and the remaining attributed to non-load and therefore allocated to vehicles on the basis of their respective VMTs.
3.1.3 Allocation of Expenditures on Pavement In-House Maintenance
The costs associated with in-house pavement main-tenance are divided into pavement-related expenditures and shoulder expenditures. The expenditures were divided into load-related and non-load expenditures for the appropriate allocation of these costs. The load and non-load splits of pavement damage developed by the 1984 Indiana HCAS were adopted in the present study. The portion of the in-house pavement-related maintenance expenditures attributed to non-load-related factors was treated as a common cost and therefore was allocated on the basis of VMT. The load-related maintenance expenses were allocated on the basis of ESAL-miles. Shoulder expenditures were allo-cated on the basis of PCE-miles.
3.1.4 Allocation of Other Pavement Expenditures
Pavement expenditures that are not related to new road construction, pavement rehabilitation, or pave-ment maintenance (e.g., roadside work and facilities, demolition, ITS-related pavement work, slope correc-tion, and drainage ditch correction contracts) were all placed in a single category referred to as ‘‘other pavement project expenditures.’’ These pavement ex-penditures were considered as a common cost and therefore were allocated among the vehicle classes on the basis of their VMT contributions.
3.1.5 Results
Overall, it was determined that the pavement cost responsibility distributions varied significantly among the different highway functional classes and vehicle classes. Vehicle class 2 had the highest cost responsi-bility with respect to pavement expenditures because of their higher volume on State highways contrary to the remaining vehicle classes. Of the truck classes, vehicle class 9 was observed to have the highest cost res-ponsibility. For example, Figure 3.1 shows that for state routes, on average, vehicle classes 1–3 had the lowest unit cost ($/VMT) while vehicle class 7 had the highest unit cost.
0.006 0.006 0.007 0.018 0.010 0.030 0.107 0.023 0.035 0.042 0.026 0.023 0.068 0.00 0.02 0.04 0.06 0.08 0.10 0.12 1 2 3 4 5 6 7 8 9 10 11 12 13 Unit Cost ($/VMT)
FHWA Vehicle Classes
3.2 Bridge Expenditures on State Routes
Bridge expenditures are allocated to different vehicle classes because they induce different live-load moments (and thus, different stress levels) in load-bearing members of a bridge. As the live-load moments increase, stronger load-bearing members are required to keep strains within acceptable limits. Thus, bridge construction becomes more costly when heavier vehicles must be accommo-dated. Each vehicle class is made to pay its share of the costs incurred to accommodate the stress corresponding to its weight. Also, after construction, heavier vehicles tend to contribute more to bridge wear and tear.
3.2.1 Correlation between AASHTO Vehicles and Study Vehicles (FHWA Vehicles)
As the bridges are designed according to AASHTO design vehicles, the correlation between AASHTO vehicles and the FHWA vehicles is a key issue in the analysis. The AASHTO standard trucks specified in the AASHTO bridge specification are trucks with configurations that would simulate the most severe live loads on a structure. The trucks are designated either with an H prefix followed by a number indicating the total weight (tons) of a two-axle single-unit truck, or with a HS prefix followed by a number indicating the weight (tons) of a tractor-trailer combination truck. However, in the present study, vehicles were classified using the FHWA vehicle classification scheme. The detailed steps in developing such the FHWA-AASHTO correlation are presented in the appendix to this report.
3.2.2 New Bridge Construction Cost Allocation
The incremental method was used in the present study for allocating the costs of new bridge construction. In this procedure, the first cost increment, which is the cost of building a new bridge to support its own weight and to carry the lightest vehicle traffic (Weight Group 1) only, was assigned to all vehicle classes on the basis of the VMT share of each vehicle class. Next, the second cost increment, which identifies the additional cost of building the bridge to accommodate the second lightest weight group (Group 2), was assigned to all weight groups excluding the lightest group (Group 1) based on the relative shares of VMT of Group 2 and above. The second cost increment was assigned to Group 2 and above instead of Group 2 only because all the heavier groups also benefit from this cost increment. Then, similarly, the third cost increment, which is the additional cost to accommodate the third lightest weight group (Group 3), was assigned to all weight groups excluding Group 1 and 2, based on the relative shares of VMT of Group 3 and above. This process continued until the last cost increment was assigned to the heaviest weight group.
3.2.3 Bridge Replacement Cost Allocation
For allocating bridge replacement costs, the bridge sufficiency rating formula was used. The sufficiency
rating of a bridge is low when the bridge has inadequate load-bearing capacity or other problems such as inadequate width. For vehicles whose loading regimes exceed the bridge load-bearing capacity, the fraction of costs to be allocated is calculated as the ratio of the partial sufficiency rating reduction (that is, arising from lowered load-bearing capacity) to the total reduction in sufficiency rating. The detailed methodology is pre-sented in Volume II of this report.
3.2.4 Bridge Rehabilitation Cost Allocation
The ratio of load-related and non-load-related shares of bridge rehabilitation expenditures is a key input in bridge rehabilitation cost allocation. In the present study, the following load-related shares, which repre-sent a combination of the 1997 FHWA study and 1999 Oregon study estimates, were used: deck overlay – 70%, other superstructure rehabilitation – 30%, substructure rehabilitation – 15%, bridge painting – 0%. The share of load-related rehabilitation costs was allocated to all vehicle classes following the same procedures that were developed for new bridge construction. The non-load share was allocated (across the vehicle classes) as a common cost using VMT as the allocator.
3.2.5 Results
It was found that the bridge cost responsibility distribution varies significantly among the different high-way functional classes and vehicle classes. Vehicle class 2 had the highest cost responsibility with respect to bridge expenditures because of their higher volume on state routes. Of the truck classes, vehicle class 9 was observed to have the highest cost responsibility. With respect to bridge unit cost (i.e., the cost incurred to bridges for every mile driven on state routes), vehicle classes 1–3 had the lowest unit cost (approximately 0.3 cents/VMT) while vehicle class 13 had the highest unit cost (approximately 3.5 cents/VMT). Figure 3.2 presents the average annual unit cost ($/VMT) for bridge expenditures on state routes during the study period (2009–2012). Volume II of this report presents more detailed results of the analysis.
3.3 Safety, Mobility, and Other Expenditures 3.3.1 Methodology
The expenditures on safety, mobility, and other re-lated work are typically included and analyzed as common costs in most highway cost allocation studies. However, in some studies, certain expenditure items, such as mobility and right-of-way, were considered as being related to vehicle size (e.g., PCE-weighted VMT is typically used as the allocator for such costs that are attributable to vehicle size). In the present study, both VMT and PCE-weighted VMT (PCE-miles) were used as allocators with respect to different expenditure categories.
3.3.2 Results
It was found that the cost responsibility and unit cost ($/VMT) distributions varied among the different high-way classes and vehicle classes. Specifically, the unit cost for Non-NHS was found to be higher than those of the other two highway functional classes. Smaller vehicles were found to have a lower unit cost ($/VMT) because certain costs were allocated as vehicle size-attributable costs using PCE-miles as the allocator. Figure 3.3 presents the average annual unit cost ($/VMT) for safety, mobility and other expenditures on state routes during the study period (2009–2012). More detailed analysis and results can be found in Volume II of this report.
PART 4. COST ALLOCATION FOR LOCAL ROUTES
There are three main sources of data related to ex-penditures on local routes: County Operational Re-ports, City Operational ReRe-ports, and the INDOT Site Manager database. Data from all the three sources were used to carry out the cost allocation for local routes. For counties lacking expenditure data, the average expendi-tures from all other ‘‘similar ‘‘Indiana counties with data were used to impute the missing data. Only 40 cities submitted City Operational Reports to LTAP during 2009–2012; for cities lacking full information but with at least one report submitted to LTAP, the average of the reported expenditures was used to impute the missing data. The expenditure items of interest extracted from the reports were the ‘‘Maintenance and Repair’’ and
‘‘Construction and Reconstruction’’ expenditures. For each of these expenditure items, there were four listed funding sources: (1) Motor Vehicle Highway Fund, (2) Local Road and Street Fund, (3) Cumulative Bridge Fund, and (4) Other Funds.
4.1 Pavement Expenditures on Local Routes
4.1.1 Allocation of New Road Construction Expenditures
The general methodology used for the state route cost allocation was adopted here albeit with some modifica-tions. For allocating the new road construction expen-ditures, the facility was divided into a base facility and a remaining facility. The base facility expenditures were attributed using VMT shares, except shoulder expendi-tures which were attributed using PCE-miles. The remaining expenditures were allocated to vehicle classes on the basis of ESAL-miles.
4.1.2 Allocation of Road Rehabilitation Expenditures
Using the methodology for the state highway cost allocation with appropriate adjustments due to data limitations, the load-related expenditure percentages presented in the 1997 FHWA HCAS were adopted for the present study and were used to estimate the load-related and non-load-load-related expenditures. The portion of the expenditures attributed to non-load-related fac-tors was allocated on the basis of VMT. On the other hand, the portion of the expenditures attributed to load-related factors was allocated using the distress-based NAPCOM cost model introduced by FHWA (1997).
0.020 0.020 0.021 0.026 0.028 0.043 0.049 0.032 0.025 0.032 0.020 0.019 0.032 $0.00 $0.02 $0.04 $0.06 1 2 3 4 5 6 7 8 9 10 11 12 13 Unit Cost ($/VMT)
FHWA Vehicle Class
Figure 3.3 Average annual unit cost for safety, mobility and other expenditures on state routes, 2009–2012.
0.003 0.003 0.003 0.006 0.005 0.006 0.022 0.005 0.007 0.017 0.006 0.012 0.035 $0.00 $0.01 $0.02 $0.03 $0.04 1 2 3 4 5 6 7 8 9 10 11 12 13 Unit Cost ($/VMT)
FHWA Vehicle Class
4.1.3 Allocation of Road Maintenance Expenditures
As was done for the state highway system, for the local roads, a portion of the pavement-related expen-ditures was attributed to load-related factors (traffic), and allocated on the basis of ESAL-miles; the remain-ing part was attributed to non-load-related factors (weather and climatic conditions, for example), and allocated on the basis of VMT. The load-related expenditure percentages presented in the 1984 Indiana HCAS were adopted by the present study and were used to estimate the load-related and non-load-related shares of pavement expenditures.
4.1.4 Allocation of Traffic and Safety Expenditures
Traffic and safety projects were incorporated into the road expenditures category for the local route cost allocation due to the classification of expenditures that appears in county and city operational reports. These expenditures were treated as common costs and thus were allocated on the basis of VMT.
4.1.5 Results
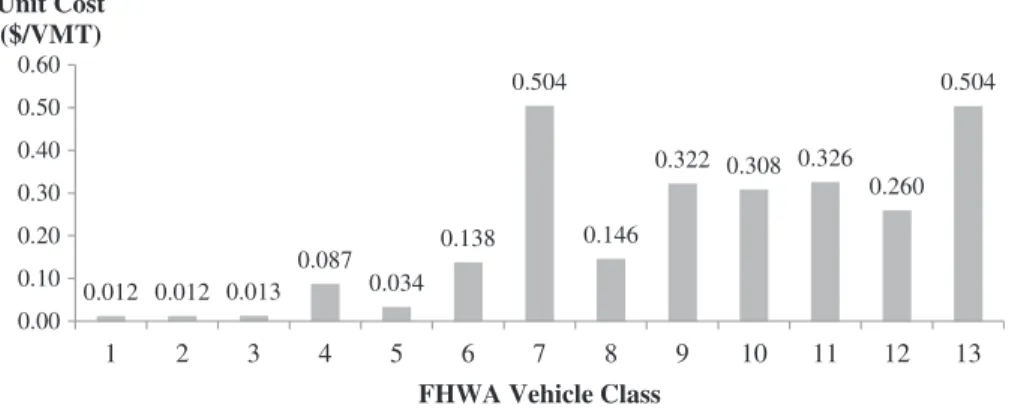
Figure 4.1 presents the average unit cost per vehicle class for all road expenditures on local routes for 2009–2012. For example, vehicle classes 7 and 13 were found to have an average unit cost of $0.504 per VMT which is the highest among the 13 vehicle classes. This result suggests, for example, that an average vehicle of class 7 or 13 traveling one mile on a local route consumes $0.504: this amount represents its share of the responsibility of the total cost of new road construction, road rehabilitation, and maintenance, and traffic and safety projects that were implemented on local routes within the analysis period. Vehicle classes 1–3 were found to have the least unit cost, on average.
4.2 Bridge Expenditures on Local Routes
From a theoretical perspective, the same methodology used for allocating state route expenditures is applicable to the local route expenditures. However, due to the lack
of detailed information for local projects, a few as-sumptions were made in order to apply the former’s methodology to local routes.
4.2.1 Analysis for the Different Project Types
The bridge-related expenditures for local routes were separated into load-related costs and common costs and therefore analyzed differently. The load-related costs included the expenditures on bridge construction and reconstruction and an estimated proportion of the load-related bridge rehabilitation expenditures. The common costs consisted of the bridge maintenance and repair expenditures and an estimated proportion of the non-load-related bridge rehabilitation expenditures. In the analysis for bridges on local routes, replace-ment and reconstruction were treated the same way as new construction. This was because the inventory rating and sufficiency rating information, which was typically needed in the methodology for bridge re-placement cost allocation, were not available in the operational reports provided by local authorities.
In the study methodology developed for state routes, different incremental factors were established for bridges with different material types, structure types, and span lengths. However, such information was unavailable for local projects in the operational reports; therefore, the analysis was carried out using the proportions of the different bridge types and the average span lengths.
4.2.2 Results
It was found that vehicle classes 2 and 3 have the highest cost responsibility (almost 85%of total costs) in terms of bridge-related expenditures on local routes primarily due to their higher VMT on local routes compared with other vehicle classes. With respect to the unit cost, vehicle classes 12 and 13 were found to assume significantly higher unit costs (0.42 and 0.39 $/VMT, respectively). Apart from the fact that these vehicle classes are associated with the heaviest loads, their relatively lower VMTs on local routes is a plausible reason for their higher unit costs compared with other vehicle classes. Figure 4.2 presents the average annual unit cost ($/VMT)
0.012 0.012 0.013 0.087 0.034 0.138 0.504 0.146 0.322 0.308 0.326 0.260 0.504 0.00 0.10 0.20 0.30 0.40 0.50 0.60 1 2 3 4 5 6 7 8 9 10 11 12 13 Unit Cost ($/VMT)
FHWA Vehicle Class
for bridge expenditures on local routes during the study period (2009–2012). More detailed analysis and results can be found in Volume II of this report.
PART 5. REVENUE ANALYSIS
5.1 Background
Highway revenues are used to fund the construction, reconstruction, rehabilitation, and maintenance of Indiana state and local roads. For the purposes of the present study, two revenue sources are considered – user and non-user sources; also, the highway user revenue sources include: gasoline tax, diesel tax, motor carrier surcharge tax, motor carrier fuel use tax, vehicle registration fees, driver license fees, international regis-tration plan, oversize/overweight permit fees, commer-cial vehicle excise tax, wheel tax, motor vehicle excise tax and excise surtax, heavy vehicle use tax, tax on sales of trucks and trailers, and tax on tires. Highway non-user revenue sources include: Federal Stimulus (funds from the American Recovery and Reinvestment Act of 2009), toll lease money (Major Moves), General Fund trans-fers, and other miscellaneous taxes including property tax, income tax, and state court fees.
Data on highway user and non-user revenues from fiscal years 2009 to 2012 were collected from the Indiana Department of Transportation (INDOT), Indiana Depart-ment of Revenue, Annual Operational Reports from counties and cities, and the Indiana Handbook of Taxes, Revenues, and Appropriations and the Highway Statistics series published by the FHWA. Table 5.1 presents the
historical total revenues for Indiana’s highway construc-tion and preservaconstruc-tion (rehabilitaconstruc-tion and maintenance) activities from 2009 to 2012.
5.2 User Revenue Attribution
Revenue attribution is the process by which the total user revenue generated from a given source is distributed among the users (vehicle classes) of the system according to their relative contributions. In the context of the current study, each of the 13 FHWA vehicle classes is an individual user group. Therefore, for a given source or level of government, revenue attribution was carried out by determining how much of the total user generated revenue came from each vehicle class. Then for a vehicle class, the results were summed up for all revenue sources and for all levels of government to yield the total revenue that was attributed to each vehicle class. The highway user revenue was broadly categorized into three levels: state, local and federal. The state-level user revenue sources include gasoline tax, diesel tax, registration fees, international registration plan, motor carrier fuel use tax, motor carrier surcharge tax, and oversize/overweight permits, and the revenue amounts, including the four-year average values, for the four fiscal four-years (FY 2009– FY 2012) are presented in Table 5.2. For example, the four-year average gasoline tax revenue is $539.5 million. The local-level user revenue sources include commercial vehicle excise tax, wheel tax, motor vehicle excise tax and excise surtax. Revenues collected from the commercial vehicle excise tax and motor vehicle excise tax were not used for highway purposes. However, these two revenue sources were included in the equity analysis because these amounts were contributed directly by the highway users for their use of the highway and therefore needs to be considered as highway user contributions to ensure fairness. A significant part of the local-level user revenues was from the motor vehicle excise tax, with an average of $639.7 million per year for the four fiscal years. The third level is the federal revenue. The revenue collected at the federal level was distributed to both state and local agencies. For example, in FY 2009, of the $878.9 million collected at the federal level, $659.2 million went to the state while $219.7 million went to the local agencies.
0.005 0.005 0.005 0.018 0.011 0.017 0.080 0.015 0.026 0.104 0.028 0.416 0.386 $0.00 $0.05 $0.10 $0.15 $0.20 $0.25 $0.30 $0.35 $0.40 $0.45 1 2 3 4 5 6 7 8 9 10 11 12 13 Unit Cost ($/VMT)
FHWA Vehicle Class
Figure 4.2 Average annual unit cost ($/VMT) for bridge expenditures on local routes, 2009–2012.
TABLE 5.1
Four-Year Total Annual Highway Revenues in $ Millions: FY 2009–FY 2012.
Revenue Source
Level
%
Federal State Local Total
User 905.95 1,192.01 69.47 2,167.42 63.5 Non-User 154.31 644.70 446.90 1,245.91 36.5 Total 1,060.26 1,836.71 516.37 3,413.33 100
It was determined that the user revenue sources contributed approximately 63.5% of the total state funding for highway expenditures and 36.5%were from non-user revenue sources. The inability of user revenue sources to cover the total highway expenditure and the partial reliance on non-user sources are rather unset-tling particularly because the non-user sources are characterized by significant variability.
PART 6. EQUITY ANALYSIS
This part compares, for each vehicle class, the share of user revenue contributed and the share of cost responsibility to determine the user equity ratio. This is done in a bid to ascertain the extent to which each vehicle class is paying their fair share of costs for highway upkeep (Sinha et al., 1984, FHWA, 1999, Balducci et al., 2009). User equity ratios are computed for reasons that include possible revision of the highway user fee structures. In the State of Indiana, the highway taxation structure is based on the entire highway system, and not separately for state highways and local routes. Consequently, the user equity ratios were considered for the Indiana highway system (all state and local highways and roads). From the outcome of the equity analysis, recommendations are made for possible actions that could help address any inequities so that each vehicle class comes closer to paying its fair share of the highway infrastructure consumption.
6.1 Equity Ratio Results
The equity ratios for Indiana’s highway system are presented in Table 6.1 and illustrated in Figure 6.1. The results indicate that vehicle classes 1–4 (motorcycles, automobiles, sport utility vehicles, and buses) have equity ratios greater than unity, while the remaining vehicle classes (5–13) have equity ratio values less than unity. From the table, it can be observed that automobiles (vehicle class 2) contributed approximately 47% of the highway user revenue for Indiana’s highway system; the cost responsibility for that vehicle class was approxi-mately 43%. Thus, the equity ratio for vehicle class 2 is 1.10, indicating that vehicle class 2, as a group, is slightly overpaying its cost responsibility. For vehicle class 9, the equity ratio is 0.81, indicating that vehicle class 9 is underpaying its cost responsibility. In general, the results suggest that passenger vehicles (light vehicles) are subsidizing the cost responsibilities of the heavier vehicles on Indiana’s highway system. Generally, the results of the equity analysis were found to be consistent with those of studies carried out at other states.
Although vehicle class 2 contributed approximately 47%of the revenue, it carried approximately 63%of the total VMT on Indiana highway system, while vehicle class 9, contributed approximately 20%, it carried 6.95%of the total VMT. As a group, small passenger vehicles (1–3) contributed just about 68% of the total user revenue and carried approximately 88% of the total VMT. Assuming the revenue contributions and
TABLE 5.2
Highway User Revenues in Indiana: FY 2009–FY 2012.
Level Revenue Source
Revenue ($M)
2009 2010 2011 2012 4-Year Average
State Gasoline tax 540.5 536.5 547.6 533.2 539.5
Diesel tax 217.1 207.9 218.3 226.9 217.6
Registration fees 278.9 278.4 279.3 299.9 284.1
International registration plan 85.5 82.9 89.1 90.9 87.1
Motor carrier fuel use tax 1.4 1.9 1.3 0.6 1.3
Motor carrier surcharge tax 97.3 86.9 94.8 95.5 93.6
Transfers and refunds (51.7) (42.3) (39.3) (46.7) (45.0)
Oversize/overweight permits 13.4 12.4 13.5 16.1 13.8
Subtotal 1,182.42 1,164.6 1,204.6 1,216.4 1,192.0
Local Commercial vehicle excise tax 60.0 60.2 61.2 61.3 60.7
Wheel tax 8.6 8.8 7.3 7.7 8.1
Motor vehicle excise tax 662.8 624.1 621.2 650.7 639.7
Excise surtax 57.5 59.5 63.1 65.4 61.4
Subtotal 788.89 752.62 752.79 785.08 769.84
Federal Gasoline tax 496.8 549.6 509.4 450.4 501.6
Diesel tax 263.1 274.5 292.5 254.2 271.1
Heavy vehicle use tax 36.2 34.4 13.2 54.6 34.6
Excise tax on trucks and trailers 71.0 60.7 87.3 122.4 85.3
Tires 11.8 12.4 15.9 13.3 13.4
Subtotal 878.91 931.58 918.38 894.91 905.95
cost responsibilities remain the same, the equity ratios will be different for different VMT distributions. The study also established and investigated a number of scenarios for addressing the equity issue.
In the present study, overhead costs were not included due to the unavailability of the data in consistent manner from the agencies that were engaged in the execution of highway projects or in administering highway revenue collection programs, such as INDOT, cities and counties, INDOR and BMV. Overhead costs are common costs and thus would be allocated on the basis of VMT. The inclusion of overhead costs, assuming the percentage overhead is uniform across all government levels and all project types, is not expected to significantly affect the relative equity ratios across the vehicle classes. Thus, the exclusion of overhead costs from the analysis can be considered justifiable.
PART 7. TRAVEL BY OUT-OF-STATE VEHICLES
7.1 Background
The fuel consumed from vehicle travel on a given state’s road network could have been purchased in that state or in a neighboring state. For example, a commuter living and working in different states will be contributing to the highway damage (and hence, repair expenditures) of both states in a certain ratio and would be contributing to the revenue base of the two states in a ratio that is not necessarily the same as the damage share across the states. For certain states, such imbalance may be very significant (i.e., more fuel is purchased in their state then is consumed in the state or vice-versa, compared to the ratio of highway asset damage). In preparation for possible future implementation of direct user charging such as the VMT fee, INDOT seeks to quantify the
TABLE 6.1
User Equity Ratios for the Indiana State and Local Routes: FY 2009–FY 2012. Vehicle Class VMT (%) Revenue Contribution (in millions) %Revenue Contribution (R) Cost Responsibility (in millions) %Cost Responsibility (C) Equity Ratio (R/C) 1 0.55 $12.13 0.42 $9.17 0.38 1.12 2 62.50 $1,360.19 47.43 $1,044.46 43.12 1.10 3 25.01 $591.89 20.64 $430.38 17.77 1.16 4 0.19 $10.79 0.38 $8.85 0.37 1.03 5 2.52 $89.06 3.11 $80.82 3.34 0.93 6 0.95 $63.61 2.22 $80.73 3.33 0.67 7 0.30 $89.00 3.10 $86.16 3.56 0.87 8 0.70 $40.41 1.41 $41.68 1.72 0.82 9 6.95 $582.25 20.30 $609.30 25.16 0.81 10 0.10 $10.56 0.37 $11.92 0.49 0.75 11 0.16 $7.63 0.27 $8.10 0.33 0.80 12 0.06 $3.51 0.12 $3.39 0.14 0.88 13 0.03 $6.76 0.24 $7.07 0.29 0.81 Total 100 $2,867.80 100 $2,422.04 100
magnitude of such imbalances. The analysis is herein carried out for gasoline and diesel vehicles separately. 7.2 Gasoline Vehicles
7.2.1 Sample Design and the Amount of Fuel Sales
For determining the amount of fuel sales, a statistical sampling technique was adopted. The criteria for stratification included urban/rural, interstate/non-inter-state, and proximity to the state border. The expecta-tion is that the percentage of out-of-state drivers and fuel sales is likely to be different at gas stations along interstates compared to non-interstates, and also different for those close to the state border compared to those far from the state border. Also, it is expected that urban and rural locations would also yield dif-ferent results. After establishing the sampling strata, the sample sizes in each stratum were determined. In the context of the present study, the ‘‘sample’’ refers to the required number of fuel purchase transactions that need to be sampled in each stratum. The sample size depends on the population size, the expected chance of the outcome, the confidence level, and the confidence interval.
Based on the sample size requirements, it was deter-mined that for each stratum, 25 fuel stations needed to be sampled for one hour each at locations spread ran-domly across the state. The sample size computations and sampling locations are provided in Volume II of this report. At each sampling location, the type of vehicle fueling during the sampling period was recorded. Each stratum met the sampling requirement of 323 observations and thus provided a confidence level within 95% with a confidence interval of ¡5%. The amount of gasoline purchased per transaction was recorded where possible.
7.2.2 Amount of Travel
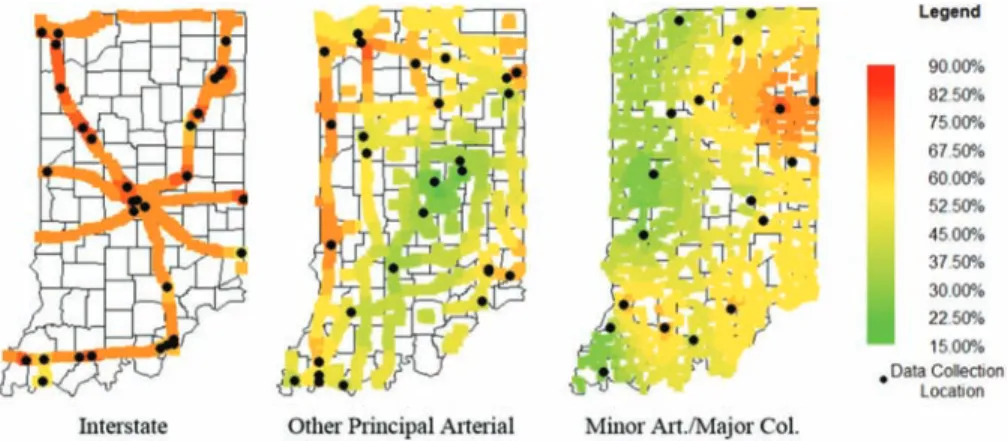
The amount of fuel purchased was used to estimate the amount of travel made on Indiana roadways by out-of-state vehicles. The percentage of gasoline sold to out-of-state drivers was calculated at each fuel collec-tion locacollec-tion. This value was then weighted by the average gasoline fuel efficiencies of the given road functional classification to provide an assessment of the percent of travel completed by out-of-state drivers at each data collection location. To obtain a reliable estimate at the state level, spatial analysis using Kriging estimation was carried out. This yielded segment-specific splits of in-state vs. out-of-state travel that were then multiplied by the segment VMT to yield values for in-state and out-of-state VMT. These values were summed over the entire state to yield travel splits for each highway functional classes.
The results showed that NHS routes saw the highest percentage of out-of-state VMT with 21.09%and 9.85% for NHS interstate and non-interstates, respectively. The non-NHS state and local routes saw 8.55%and 7.20%
out-of-state drivers, respectively. These values were then weighted according to relative distribution of VMT across the highway functional class, and a value of 11.12%was obtained as the percent of VMT in Indiana can be attributed to out-of-state gasoline vehicles. 7.3 Diesel Vehicles
In the previous section where we discussed the esti-mation of the travel by out-of-state gasoline vehicles, it can be seen that an extensive data collection is needed for such analysis. This is because nearly 100%of the gas-oline VMT can be attributed to personal vehicles; there is no centralized database for measuring individual travel by this class of vehicles. On the other hand, travel using diesel fuel is dominated by commercial vehicles. Drivers of commercial vehicles are required to submit travel data to IFTA (not because they use diesel but because they are commercial vehicles); such reporting is necessary so that taxes can be accurately dispersed to the states in which the vehicles traveled. For this reason, the travel by out-of-state diesel vehicles on Indiana highways was determined separately for vehicles that submit travel data to IFTA compared to those that do not.
From the analysis carried out in this study, the total diesel VMT in Indiana was found to be 7.78 billion miles in 2012; out of this, 0.28 billion miles were driven by passenger vehicles, 0.02 billion miles were driven by commercial carriers that only operate in Indiana, 5.74 billion miles were driven by carriers that are Indiana-based or Indiana-based in other jurisdictions, leaving a balance of 1.74 billion VMT (Table 7.1). The lack of MCFT or MCST records for the remaining VMT suggests that this travel may be attributed to class 5 (single unit, six tires) recreational vehicles (RVs) and pick-up trucks or tax exempt vehicles that include vehicles operated by government agencies, school buses, casual or charter buses, intercity buses, farm vehicles, and trucks with dealer registration plates. There is inadequate data to determine what percent of the 1.74 billion VMT is attributable to out-of-state vehicles; therefore, the value used for passenger vehicles was applied. Such an assumption can be considered appropriate because the majority of this VMT is expected to originate from the class 5 vehicles which have similar travel patterns to passenger vehicles. IFTA data was not available during the study period; therefore the percentage of inter-state commercial vehicle VMT attributed to out-of-state vehicles was estimated to be between 49% and 79% based on previous research.
7.4 Summary of Travel by Out-of-State Vehicles The percentage of all gasoline VMT attributed to out-of-state vehicles was determined to be 11.12%using fuel purchase data collected at various locations across Indiana and spatial interpolation. This analysis was then paired with previous research regarding out-of-state commercial VMT in Indiana to provide an assessment of the total VMT attributable to out-of-state vehicles
(Table 7.1). It was estimated that 10.27 billion to 12.13 billion of Indiana’s 71.24 billion VMT in 2012 can be attributed to out-of-state vehicles.
PART 8. REPORT SUMMARY
The objective of this study was to investigate the cost responsibility and the revenue contribution of highway users, in terms of the vehicle classes, for the construction, preservation, maintenance, and operation of highways in Indiana. The study scope covered the state and local highway systems, expenditure patterns and revenue types spanning the analysis period (2009 to 2012), and expen-diture on different asset types related to pavements, bridges, safety, and mobility. The second objective of the study was to determine the distribution of fuel purchases and travel by out-of-state vehicles on Indiana’s highways. This study discussed the background and the objec-tive for conducting a HCAS in the state of Indiana and the relevance of estimating the extent of out-of-state vehicle travel. It also provided a detailed literature review covering the methodologies for highway cost allocation methodologies at the federal and state levels and for travel estimation. Traffic volume data collected from temporary count stations were used to calculate the VMT along state routes. It was found that from 2009 to 2012, the annual VMT on state routes fluc-tuated between 38.1 and 39.2 billion miles. Data col-lected from the limited number of permanent count stations and Kriging estimation was used to distribute the VMT across the 13 FHWA vehicle classes. Kriging estimation, a spatial analysis process, yielded statewide maps of the traffic stream composition. Thirty-three (33) weigh-in-motion stations provided data that could be used to develop vehicle weight distributions. Average weight distributions were developed for each truck class for interstate and non-interstate highways. Since count
stations do not cover the local routes, direct calculation of VMT from AADT data was not practical; as such, local route VMT was back-calculated from gasoline and diesel sales data. The annual VMT for local routes was found to vary between 32.1 and 35.61 billion yielding a total (state-local) system usage of 71.24 to 73.75 billion during the study period.
All the state route expenditures were classified by highway functional class (Interstate, Non-Interstate NHS, and Non-NHS), expenditure area (pavement, bridge, safety, mobility and others), project type within each expenditure area (construction, rehabilitation, maintenance, etc.), and expenditure item within each expenditure area (pavement, shoulder, structure, grad-ing, earthwork, signgrad-ing, ROW, etc.). For new pavement construction, the methodology developed in the 1997 and 2000 FHWA HCAS was adopted and the analysis was conducted on a project-by-project basis. The base facility expenditures was allocated among the vehicle classes on the basis of VMT adjusted for vehicle width while the expenditures of the remaining facility were allocated on the basis of ESAL-miles adjusted for vehicle width. For allocating pavement rehabilitation expenditures, the portion of the expenditures that was related to damage by non-load factors was allo-cated using VMT, and the rest were alloallo-cated using NAPCOM, FHWA’s distress-based model. For allo-cating pavement maintenance expenditures, a load and non-load split was also used. New bridge construction expenditures were allocated using the incremental factors developed for different AASHTO design load-ings. A correlation between AASHTO vehicles and FHWA vehicles was established and thus the allocation results were obtained for FHWA vehicle classes. Bridge replacement expenditures were analyzed in a similar manner except that the bridge sufficiency rating formula was taken into account in the procedure. For
TABLE 7.1
Annual VMT by Out-of-State Vehicles.
Vehicle Class Total VMT (billions) %Attributable to Out-of-State Vehicles Out-of-State VMT (billions) 1 0.39 11.12% 0.04 2 44.59 11.12% 4.96 3 17.74 11.12% 1.97 4 0.16 0.00% 0.00 5 2.16 11.12% 0.24 6 0.90 49.2%to 79.2% 0.44 to 0.71 7 0.29 49.2%to 79.2% 0.14 to 0.23 8 0.44 49.2%to 79.2% 0.22 to 0.35 9 4.34 49.2%to 79.2% 2.14 to 3.44 10 0.07 49.2%to 79.2% 0.03 to 0.06 11 0.10 49.2%to 79.2% 0.05 to 0.08 12 0.04 49.2%to 79.2% 0.02 to 0.03 13 0.02 49.2%to 79.2% 0.01 to 0.02
Vehicle Class 1–3 Total 62.71 11.12% 6.974464
Vehicle Class 4–13 Total 8.53 38.6%to 60.4% 3.29 to 5.15
bridge rehabilitation, the estimated load-related share of the expenditures was allocated using the incremental methods, while the estimated non-load-related share was analyzed as common costs and was therefore allocated using VMT. In-house bridge maintenance expenditures were also allocated as common costs. The final products of this part of the report were the state route total cost responsibilities and average unit costs ($/VMT) for each expenditure type and functional class for the analysis period 2009–2012.
For the allocation of local road expenditures, the methodology used for the state route pavement cost allocation was adopted with some modifications due to differences in the road geometry and data limitations. Similarly, the allocation of local bridge expenditures used the methodology for state route bridge cost allocation with some assumptions and simplifications due to data avail-ability issues. For the local route cost allocation, the main sources of data related to road and bridge expenditures were County Operational Reports, City Operational Reports, and the INDOT Site Manager database.
The pavement and bridge expenditures were found to have a dominant share of the overall expenditures on Indiana’s highway system. In this study, the expenditures were allocated to the vehicle classes on the basis of whether they were common costs and thus attributed to the vehicle classes on the basis of their VMT contributions, or whether they were related to load or capacity consumption and thus attributed to the vehicle classes on the basis of their equivalent loads or passenger-car equivalents.
Overall, it was determined that as a group, vehicle class 2 had the highest cost responsibility with respect to all project types obviously because of their higher volume on state and local routes compared to the remaining vehicle classes. Of the truck classes, vehicle class 9 was observed to have the highest cost respon-sibility due to the combined effect of their high loading intensity and road usage levels compared to the remaining truck classes. Figure 8.1 presents the analysis results of the average unit cost ($/VMT) of each vehicle class by expenditure type for all state and local routes in Indiana over the study period. It can be observed that
vehicle classes 1–3 had the lowest unit cost (approxi-mately 2.5 cents/VMT), while vehicle class 7 had the highest unit cost (40 cents/VMT).
The revenue sources, during the study period, con-sisted of user sources that included taxes on gasoline, motor carrier surcharge, and motor carrier fuel use, truck and trailer sales, tire sales, heavy vehicle use; county motor vehicle excise surtaxes and wheel taxes; and fees on vehicle registration and driver licenses. Non-user revenue sources include toll road lease funds (Major Moves), Federal Stimulus (funds from the American Recovery and Reinvestment Act), General Funds, property taxes, bond proceeds. The revenue analysis period was from 2009 to 2012, using the state’s fiscal year (July to June). The 4-year average highway user revenues were attrib-uted to each vehicle class on the basis of a number of factors including VMTs, fleet fuel efficiencies, and number of registered vehicles. It was determined that the user revenue sources contributed approximately 64% of the total state funding for highway expenditures and 36%were from non-user revenue sources. The inability of user revenue sources to cover the total highway expenditure and consequently, the partial reliance on non-user sources, are considered problematic particularly because the non-user sources are characterized by significant variability and therefore, uncertainty.
On the basis of the expenditures and revenues associated with the various user groups (vehicle classes) over the analysis period, the study found that inequities exist, albeit in varying degrees, among the highway user groups. Of the 13 vehicle classes, classes 1–4 were found to be overpaying their cost responsibilities while classes 5–13 are underpaying. For example, vehicle class 2 is overpaying its cost responsibility by 10%while vehicle class 9 is underpaying by 19%. A comparison of equity ratios from other states was carried out: it was observed that this study’s results are consistent with the findings of studies at other states. Also, scenario analysis was carried out to assess the impact of revenue increases on the equity ratios.
This study also included an analysis of the extent of travel by out-of-state vehicles on Indiana highways.
0.00 0.05 0.10 0.15 0.20 0.25 0.30 0.35 0.40 0.45 1 2 3 4 5 6 7 8 9 10 11 12 13 Unit Cost ($/VMT)
FHWA Vehicle Class
Safety, Mobility, & Other Bridge Pavement