Electrochemical and in-situ SERS study of passive film
characteristics and corrosion performance of microcomposite
steel in simulated concrete pore solutions
M. Mancio, G. Kusinski, T.M. Devine, P.J.M. Monteiro
TABLE OF CONTENTS
ABSTRACT... iv
LIST OF FIGURES... v
LIST OF TABLES... viii
1 INTRODUCTION ... 2
1.1 BACKGROUND... 3
1.2 OBJECTIVES AND SCOPE... 3
1.3 MAIN CAUSES OF CORROSION OF STEEL IN CONCRETE... 5
1.3.1 Carbonation... 5
1.3.2 Chloride Attack... 8
2 EXPERIMENTAL PROCEDURE ... 10
2.1 SAMPLE PREPARATION AND SETUP... 11
2.2 CHARACTERIZATION OF PASSIVE FILMS BY SURFACE-ENHANCED RAMAN SPECTROSCOPY... 12
2.2.1 Surface Enhanced Raman Spectroscopy (SERS) ... 12
2.2.2 Cyclic potentiodynamic polarization curves... 15
2.3 EVALUATION OF THE EFFECT OF PH AND IONIC STRENGTH ON CORROSION PERFORMANCE... 16
2.3.1 Half-cell Potential ... 16
2.3.2 Linear Polarization Resistance (LPR) ... 17
2.4 EVALUATION OF THE EFFECT OF CHLORIDES ON THE CORROSION PERFORMANCE AND DETERMINATION OF THE CHLORIDE THRESHOLD RATIO [CL-]/[OH-] ... 19
2.4.1 Potentiodynamic polarization curves ... 19
3 RESULTS AND DISCUSSION... 21
3.1 CYCLIC POTENTIODYNAMIC POLARIZATION CURVES AND SERS ... 21
3.1.1 SERS spectra ... 25
3.2 EFFECT OF PH AND IONIC STRENGTH ON CORROSION PERFORMANCE... 36
3.2.1 Variable pH and constant ionic strength ... 36
3.2.2 Variable pH and variable ionic strength ... 39
3.3 EFFECT OF CHLORIDE IONS AND DETERMINATION OF THE CHLORIDE THRESHOLD RATIO... 43
4 SUMMARY AND CONCLUSIONS... 48
4.1 REGARDING THE EXPERIMENTAL SETUP AND TECHNIQUES USED... 48
4.2 REGARDING THE CYCLIC POLARIZATION CURVES AND SERS EXPERIMENTS... 49
4.3 REGARDING THE EFFECTS OF PH AND IONIC STRENGTH... 50
4.5 FINAL COMMENTS... 52
5 RECOMMENDATIONS ... 53
SUGGESTED TEST PROTOCOL FOR EVALUATION OF CORROSION RESISTANCE OF MICROCOMPOSITE STEEL AND COMPARISON WITH CARBON STEEL... 53
Introduction ... 53
Methodology ... 53
Description of Tests ... 53
Linear Polarization Resistance... 54
Potentiodynamic Polarization... 54 Experimental Procedure ... 54 Polarization Resistance... 55 Potentiodynamic Polarization... 55 Final Comments ... 56 Presentation of Results ... 57 6 REFERENCES ... 58
APPENDIX A: INDIVIDUAL SERS PEAK-FITTING ANALYSES ... 63
APPENDIX B: SUMMARY TABLES AND PEAK-FITTING PARAMETERS ... 88
Electrochemical and in-situ SERS study of passive film characteristics and corrosion performance of microcomposite steel in simulated concrete pore solutions
M. Mancio1, G. Kusinski2, T.M. Devine3, P.J.M. Monteiro1 1
Department of Civil and Environmental Engineering, University of California, Berkeley 2
School of Materials Science and Engineering, Clemson University 3
Department of Materials Science and Engineering, University of California, Berkeley
Abstract
Corrosion of steel reinforcing bars (rebar) is the most prevalent mechanism of deterioration of reinforced concrete structures. Microcomposite low carbon, chromium steels (ASTM A1035) have been recently developed and used as a more corrosion-resistant alternative to conventional low-carbon steel rebar (ASTM A615). These steels (typical composition in wt%: C 0.08, Cr 9.0, Mn 0.6, bal. Fe) are produced with a controlled microstructure consisting of a dislocated lath structure (laths of martensite alternating with thin films of austenite) in which the formation of grain boundary carbides is avoided. It has been shown that microcomposite steels present improved corrosion performance as compared to low-carbon steel rebar. Considering that the corrosion resistance of engineering alloys is dependent on the passive film characteristics, and also considering that carbonation and chloride attack are the main causes of corrosion in reinforced concrete structures, this research project has focused on three goals: (1) study the composition and structure of passive films formed on microcomposite steel, using in-situ Surface-Enhanced Raman Spectroscopy (SERS) in conjunction with cyclic potentiodynamic polarization curves; (2) study the effect of pH and ionic strength on the corrosion performance of microcomposite steel; and (3) study the effect of chlorides on the corrosion performance of microcomposite steel, and determine the chloride threshold ratio ([Cl-]/[OH-]) required for corrosion initiation. The results show, for instance, that the passive film formed on microcomposite steel is considerably more protective than those typically formed on regular carbon steel rebar, and that chromium species play a key role in the composition and behavior of the film. The corrosion performance of microcomposite steel as a function of pH also seems to be drastically different (better) that what would be normally expected for conventional steel reinforcement. In contrast to conventional steel reinforcement, Microcomposite steel did not shown a reduction of polarization resistance (Rp) when the pH of the solution was reduced from 13 to 9 at a constant ionic strength of the. Regarding the effects of chloride, a critical threshold ratio of [Cl-]/[OH-] = 3 was required for pitting corrosion initiation of Microcomposite steel, as compared to a typical [Cl-]/[OH-] = 0.6 for conventional steel reinforcement. This paper presents results which show that the passive films formed on the microcomposite steel are much more stable (as a function of pH drop and chlorides increase) as compared to passive films formed on conventional carbon steel. Finally, a suggested test protocol for evaluation of corrosion resistance of microcomposite steel and comparison with carbon steel is included in the report.
List of Figures
Figure 1 Schematic representation of the advance of the depassivation front in a cracked region [31]... 7
Figure 2 Custom-designed electrochemical cell for simultaneous in-situ spectroscopic
and electrochemical measurements [30]... 13
Figure 3 Schematic representation of experimental setup for SERS measurements [43]
... 14
Figure 4 Cyclic potentiodynamic polarization curve, microcomposite steel. Solution
0.55M KOH + 0.16M NaOH. ... 22
Figure 5 Cyclic potentiodynamic polarization curve, microcomposite steel. Solution
0.55M KOH + 0.16M NaOH + 3.5% NaCl. ... 22
Figure 6 Cyclic potentiodynamic polarization curves, microcomposite steel.
Comparison between 0.55M KOH + 0.16M NaOH solutions with 0% and 3.5% NaCl.. 23
Figure 7 Anodic potentiodynamic polarization curves, microcomposite and regular
carbon steel. Solution 0.55M KOH + 0.16M NaOH. Both samples were gold-plated for SERS. ... 24
Figure 8 SERS spectra between -1.1V and -0.3V, microcomposite steel, solution 0.55M
KOH + 0.16M NaOH + 3.5% NaCl... 26
Figure 9 SERS spectra between -0.2V and +0.3V, microcomposite steel, solution
0.55M KOH + 0.16M NaOH + 3.5% NaCl. ... 26
Figure 10 SERS spectra between +0.5V and +0.1V (reverse scan), microcomposite
steel, solution 0.55M KOH + 0.16M NaOH + 3.5% NaCl... 27
Figure 11 SERS spectra between +0.1V and -0.5V (reverse scan), microcomposite
steel, solution 0.55M KOH + 0.16M NaOH + 3.5% NaCl... 27
Figure 12 SERS spectra between -0.5V and -1.2V (reverse scan), microcomposite steel,
solution 0.55M KOH + 0.16M NaOH + 3.5% NaCl. ... 28
Figure 13 SERS spectra of gold at +0.25V, +0.40V and +1.0V;
solution 0.55M KOH + 0.16M NaOH. ... 31
Figure 14 SERS spectra between -1.2V and -0.3V, microcomposite steel, solution
Figure 15 SERS spectra between -0.2V and +0.3V, microcomposite steel, solution 0.55M KOH + 0.16M NaOH. ... 34
Figure 16 SERS spectra between +0.5V and 0.0V (reverse scan), microcomposite steel,
solution 0.55M KOH + 0.16M NaOH. ... 34
Figure 17 SERS spectra between 0.0V and -0.5V (reverse scan), microcomposite steel,
solution 0.55M KOH + 0.16M NaOH. ... 35
Figure 18 SERS spectra between -0.5V and -1.2V (reverse scan), microcomposite steel,
solution 0.55M KOH + 0.16M NaOH. ... 35
Figure 19 Polarization resistance, comparative plot showing ΔI vs. ΔV, carbon steel
rebar. Solutions with variable pH (9 to 13) and constant ionic strength (μ =10-1). ... 37
Figure 20 Polarization resistance (Rp), carbon steel rebar. Solutions with variable pH (9
to 13) and constant ionic strength (μ=10-1)... 37
Figure 21 Polarization resistance, comparative plot showing ΔI vs. ΔV, microcomposite
steel. Solutions with variable pH (9 to 13) and constant ionic strength (μ =10-1). ... 38
Figure 22 Polarization resistance (Rp), microcomposite steel. Solutions with variable pH
(9 to 13) and constant ionic strength (μ=10-1). ... 38
Figure 23 Polarization resistance, comparative plot showing ΔI vs. ΔV, carbon steel
rebar. Solutions with variable and variable ionic strength... 40
Figure 24 Polarization resistance (Rp), microcomposite steel. Solutions with variable pH
and variable ionic strength. ... 40
Figure 25 Polarization resistance, comparative plot showing ΔI vs. ΔV , microcomposite
steel. Solutions with variable pH and variable ionic strength... 41
Figure 26 Polarization resistance (Log Rp), microcomposite steel. Solutions with
variable pH and variable ionic strength. ... 41
Figure 27 Anodic polarization curves, microcomposite steel, solution 0.55M KOH +
0.16M NaOH + xM NaCl, naturally aerated... 44
Figure 28 Detail of anodic polarization curves, microcomposite steel, solution 0.55M
KOH + 0.16M NaOH + xM NaCl, naturally aerated... 45
Figure 29 Anodic polarization curves, microcomposite steel, solution 0.24M KOH +
Figure 30 Anodic polarization curves, microcomposite steel, solution 0.24M KOH + 0.08M NaOH + xM NaCl, naturally aerated... 46
Figure 31 Anodic polarization curves, microcomposite steel. Comparison between
solutions 0.55M KOH + 0.16M NaOH and 0.24M KOH + 0.08M NaOH, naturally aerated. ... 47
Figure 32 Anodic polarization curves, microcomposite steel. Comparison between
solutions 0.55M KOH + 0.16M NaOH and 0.24M KOH + 0.08M NaOH, naturally aerated. ... 47
List of Tables
Table 1 Solutions used for the linear polarization resistance experiments ... 19
Table 2 Aqueous solutions used for the linear polarization resistance experiments... 20
Table 3 Locations of characteristic peaks in the Raman spectra of selected Iron and
Chromium oxides, hydroxides and oxyhydroxides (cm-1). High-intensity modes are underlined. [51, 52]... 29
Table 4 Comparative summary, polarization resistance as a function of pH for both
regular carbon and microcomposite steel, constant ionic strength. ... 39
Table 5 Comparative summary, polarization resistance as a function of pH for both
regular carbon and microcomposite steel, variable ionic strength... 42
Table B1. Summary table, SERS peak parameters, microcomposite steel, forward scan: -1.1V to -300mV... 88
Table B2. Summary table, SERS peak parameters, microcomposite steel, forward scan:
-200mV to +400mV... 89
Table B3. Summary table, SERS peak parameters, microcomposite steel, reverse scan:
+500mV to +100mV ... 90
Table B4. Summary table, SERS peak parameters, microcomposite steel, reverse scan:
+100mV to -500mV... 91
Table B5. Summary table, SERS peak parameters, microcomposite steel, reverse scan:
1 Introduction
Modern civil engineering structures are being designed to last over 100 years. Corrosion of the steel reinforcing bars is the most prevalent deterioration mechanism in reinforced concrete structures [1]; therefore there is a significant pressure for civil engineers to specify bars with significant corrosion resistance.
The total direct cost of corrosion in the U.S. is estimated at about $267 billion per year, which is equivalent to approximately 3.1% of the U.S. gross national product [2]. The economic and safety implications of corrosion to the civil infrastructure are also
considerable. The American Society of Civil Engineers (ASCE) estimates that 27.1% of the 590,750 bridges in the U.S. are structurally deficient or functionally obsolete, and that it would cost about $9.4 billion a year for 20 years to eliminate all the bridge deficiencies [3]. According to Trejo et al. [4], such structural problems happen primarily due to corrosion of steel and steel reinforcement. Koch et al. [2] estimate the direct cost of corrosion for highway bridges at $8.3 billion/year. The same study estimates the indirect costs of corrosion to the user at about 10 times the direct cost figure, due to traffic delays and lost productivity. Regarding specifically to corrosion of steel embedded in concrete, the costs are also substantial. Broomfield [5] estimates that the cost of bridge-deck repairs, substructures and multistory car parks maintenance, for instance, ranges from $200 to $450 million per year.
Microcomposite steels [6-9], conforming to ASTM A1035 specification [10], have been recently developed and used as a more corrosion-resistant alternative to conventional low-carbon steel rebar. These steels (typical composition in wt%: C 0.08, Cr 9.0, Mn 0.6,
bal. Fe)1, are produced with a controlled microstructure consisting of a dislocated lath structure (laths of martensite alternating with thin films of austenite) in which the formation of carbides is avoided [11-13].
It has been shown that microcomposite steels present enhanced mechanical properties [14-20] and improved corrosion performance as compared to low-carbon steel rebar [21-26]. This report addresses the fundamental understanding on the mechanism of corrosion when microcomposite steels are used, particularly regarding the formation and
breakdown mechanisms of the passive films formed.
1.1 Background
When steel is embedded in concrete, a protective passive film (PF) is formed due to the high pH of the concrete pore solution, and consequently a state of passive behavior is observed. In this stage, the corrosion resistance depends on the quality and integrity of the passive film. If this protective layer is broken down or dissolves, the alloy reverts to active behavior and rapid corrosion can occur. Despite its considerable importance, very little information is currently available about the passive films formed on carbon steels in highly-alkaline environments such as concrete pore solutions [27-30]; and basically no information currently exists for microcomposite steels. Detailed information regarding the composition and structure of such passive films is necessary to enable the
understanding of their formation, protectiveness, breakdown and corrosion mechanisms.
1.2 Objectives and Scope
The main objectives of this research project are as follows:
1
Characterize the corrosion behavior of microcomposite steel in alkaline environments, using standard electrochemical experiments, such as potentiodynamic polarization curves and polarization resistance;
Characterize the composition and structure of passive films formed on
microcomposite steel, using in-situ Surface-Enhanced Raman Spectroscopy (SERS) in conjunction with cyclic potentiodynamic polarization curves;
Study the effect of pH and ionic strength on the corrosion performance of microcomposite steel;
Study the effect of chlorides on the formation and integrity of passive films formed on microcomposite steel. Determine the chloride threshold ratio ([Cl-]/[OH-]) required for corrosion initiation;
Compare the corrosion performance of microcomposite steels, and characteristics of the passive films, to regular carbon steel.
This report is structured in six chapters. Chapter one presents a brief introduction, the research objectives and background information, including a brief discussion on the main causes of corrosion of steel in concrete. Chapter two describes the experimental
procedures used in the research, including a short description of the electrochemical and spectroscopic techniques used. Results and discussion are presented in the third chapter. Chapter four presents the main conclusions drawn based on the experimental
observations. Chapter five contains recommendations and a suggested test protocol for evaluation of the corrosion performance of microcomposite steels and comparison with carbon steel. References are listed in chapter 6. Appendices with individual test results, raw data and peak-fitting analyses are also included after the references.
1.3 Main causes of corrosion of steel in concrete
In reinforced concrete, there are two major factors that cause the passive coating to break down: carbonation and the presence of chlorides. Carbonation is the result of the
interaction of carbon dioxide gas (CO2) present in the atmosphere with water and the
alkaline hydroxides in the concrete pore solution, which causes a sharp drop of pH in the solution, leading to the disruption of the protective passive film. The presence of chloride ions also breaks down the passive layer that protects the steel. In this case, the passive films may be broken down even if the pH of the solution remains unchanged. The exact mechanism for this break down is not known with certainty, but it is known that it happens when the chloride ion content reaches a threshold value. These mechanisms do not impair the integrity of concrete itself; instead, aggressive chemical agents pass through the concrete network of capillary pores and microcracks and attack the steel reinforcement [31, 5].
Sections 1.3.1 and 1.3.2 below present in greater detail the mechanisms of carbonation and chloride attack in reinforced concrete.
1.3.1 Carbonation
Initially, carbon dioxide dissolves in the water present in concrete pores to form carbonic acid, as illustrated by the equation below.
CO2 + H2O Æ H2CO3
Due to the reduced solubility of calcium hydroxide, typically there is more Ca(OH)2 in
the concrete pores than can be dissolved in the pore solution. Thus Ca(OH)2 crystals tend
the concrete pH at high values. At room temperature, a solution saturated with calcium hydroxide presents a pH of 12.4. However, as represented below, when carbonic acid combines with calcium hydroxide, generating calcium carbonate (CaCO3), this reserve is
consumed and the pH can be sharply reduced to values as low as 8 [5, 32]. H2CO3 + Ca(OH)2 Æ CaCO3 + H2O
The passive layer that protects the steel is generally expected to break down at pH 10-11. The ability of reinforced concrete to resist carbonation-induced corrosion depends on many factors, such that the concrete cover thickness, the concrete pore structure,
humidity and the alkalinity reserve. The time it takes for the carbonation front to advance through the concrete cover and reach the reinforcing steel is a function of the depth of the cover and of the rate of carbon dioxide diffusion into the concrete. The rate of this
diffusion is mainly controlled by the concentration of CO2 in the atmosphere and by the
pore structure of the concrete, which is very sensitive to the water/cement ratio and also depends on the incorporation of mineral admixtures, the chemical composition of the cement, the compaction effectiveness and the curing conditions. The rate of diffusion is also dependent on the moisture content of the concrete, as the diffusion of the carbon dioxide gas is reduced in very dry and saturated concretes [31, 33]. It should be noted that the incorporation of mineral admixtures also tends to reduce the alkalinity reserve as it consumes calcium hydroxide (Ca(OH)2) during the pozzolanic reactions.
Carbon dioxide diffuses through the concrete and the rate of movement of the
carbonation front approximates to Fick’s law of diffusion, which states that the rate of movement is inversely proportional to the distance from the surface. However, cracks and changes in concrete composition and moisture levels with depth can lead to deviations
from the exact diffusion equation, so that it can be used only as an approximation. In addition, the concrete pore microstructure itself is modified as carbonation proceeds. An important factor to be mentioned is that the concrete cover can often be expected to be cracked to a greater or lesser extent, as a result of several factors, such as load-induced cracking, shrinkage and thermal effects, freezing and thawing, sulphate attack or alkali-silica reactions. If the concrete cover is cracked, the corrosion process tends to occur at a faster rate because the cracks facilitate the onset of corrosion by providing easy access to aggressive agents (such as CO2 and Cl- ions) that induce depassivation of the steel. Once
corrosion has begun, the presence of cracks can also accelerate the process by reducing the barrier to the access of oxygen, in particular at the vicinity of crack openings. Figure 1 illustrates the effect of a crack.
Figure 1 Schematic representation of the advance of the depassivation front in a cracked region [31]
To make the problem still more complicated, the corrosion process itself often results in cracking of the concrete cover – sometimes severe cracking – accelerating the
Over the years, the general approach to improve the durability of reinforced concrete structures has mostly focused on the improvement of concrete performance. Improving the concrete properties has produced considerable benefits and will continue to improve the performance of reinforced concrete structures. However, currently significant research work has also been done on improving the steel reinforcement performance, using coated reinforcing bars and more corrosion-resistant steels [4]. Recent reports, however, indicate that the use of coated reinforcing has significant limitations in certain applications, hence, the use of the monolithic, metallic, corrosion-resistant rebars is preferred [34].
1.3.2 Chloride Attack
The presence of chloride ions in concrete can be due to several reasons, but basically chlorides can be either cast into the concrete or can diffuse in from external sources. Usually chlorides are cast into concrete mainly due to the addition of chloride set
accelerators, use of seawater in the mix and use of contaminated aggregates. On the other hand, chlorides can diffuse into hardened concrete from external sources as result of sea salt spray and seawater wetting, use of deicing salts and exposure of the structure to chemically aggressive environments [31, 5].
The presence of chloride ions also breaks down the passive layer that protects the steel. The exact mechanism for this breakdown is not known with certainty, but it is known that it happens when the chloride ion content reaches a threshold value. Carbon steel rebar typically presents chloride threshold ratios (expressed as [Cl-]/[OH-]) between about 0.2 and 0.85, with 0.6 being the most commonly referenced value [35-38]. However, there are many factors that affect the threshold chloride concentration and there is no
consensus about this value [39, 31, 5, 38]. In the United States, due to the relative difficulty of determining the concentration of OH- ions in concrete, a general practical guideline given by the American Concrete Institute (ACI) is a maximum of 0.20% of acid-soluble chloride by mass of cement for reinforced concrete in dry conditions, 0.10% for reinforced concrete in wet conditions, and 0.08% for prestressed concrete structures [40].
The depassivation mechanism for chloride attack is different from the carbonation-induced corrosion mechanism. The chloride ions attack the steel protective passive layer but, unlike carbonation, there is no overall drop in pH. Chlorides act as catalysts to corrosion when there is sufficient concentration at the steel bar surface to break down the passive layer, they are not consumed in the process (see equations below) and allow the corrosion process to proceed quickly [31, 5].
Fe+2 + 2Cl- Æ FeCl2
FeCl2 + 2OH- Æ Fe(OH)2 + 2Cl
-The chloride ions are hygroscopic, that is, they absorb and retain moisture. Thus, they help to increase the water content in the pores, which increases the electrical conductivity of the concrete and accelerates the corrosion process. The higher conductivity also allows the separation of the anode and cathode areas as the ions can move through the water filled pores. In the case of chloride attack, usually the anodic and cathodic reactions are separated with large cathodic areas supporting small, concentrated anodic areas. This occurrence of concentrated areas of corrosion (also referred to as pitting) often well separated of areas of “clean” steel is known as the macrocell phenomenon [5].
Similarly to carbonation, the rate of chloride ingress in concrete approximates to the laws of diffusion, but in this case there are some additional complications. Especially when the concrete surface is dry, the initial mechanism appears to be suction, and salt water is rapidly absorbed. Then, there is some capillary movement of the salt-laden water through the pores, followed by diffusion [5]. Also, as mentioned above (see figure 1), the
presence of cracks in the concrete cover facilitates the ingress of chloride ions and accelerates the depassivation process [31].
There are other opposing mechanisms that slow the chlorides down, such as chemical reactions with some hydration products that form a relatively insoluble Friedel’s salt, tricalcium chloroaluminate (C3A.CaCl2.10H2O). According to Bentur et al. [31], cements
with high C3A contents can inactivate a significant proportion of chloride that otherwise
would remain in pore solution to cause corrosion. On the other hand, Broomfield [5] observes that the extent of this binding and its effectiveness is not well understood yet, but it is known that a reduction in pH as caused by carbonation will break down the chloroaluminates.
2 Experimental Procedure
The research project has been divided in three main parts, according to the previously established objectives: (1) characterization of passive films formed on microcomposite steel; (2) evaluation of the effect of pH and ionic strength (μ) on corrosion performance; and (3) evaluation of the effect of chlorides on the corrosion performance and
determination of the chloride threshold ratio [Cl-]/[OH-]. This chapter describes the methodology to accomplish each of these goals. Sample preparation procedures, common to all parts of the study, are presented in item 2.1.
2.1 Sample preparation and setup
Test samples of approximately 1” length and 5/16” diameter were machined from the rebar to be tested. In one end, on top of the specimen, a screw thread was drilled and tapped (6-32 x 3/16”), and electrical contact was made with a threaded rod long enough to extend outside the electrochemical cell. The surface of the test specimen was polished with SiC paper down to 1000 grit. The exposed area of the test specimen was limited and electric insulation applied; leaving approximately ½” in length exposed, the remaining length of the specimen as well as the contacting rod was covered with heat-shrink tubing. The exposed area was then measured and recorded. A standard three-electrode
electrochemical cell was used, in which the reference electrode was a standard Ag/AgCl electrode. Plastic cells were used throughout the study in order to avoid glass etching due to the elevated pH of the test solutions. For the Surface-Enhanced Raman Spectroscopy (SERS) experiments (section 2.2), a custom-designed PVC cell equipped with optical lens was used, as explained in item 2.2.1. For the other tests, described in sections 2.3 and 2.4, the body of the cell consisted of a 500ml polypropylene (PP) beaker. Before testing, after the equipment was setup and the electrochemical cell was ready to receive the test specimen, the exposed area of the specimen was re-polished, degreased with acetone and cleaned with methanol and deionized water. Test solution was prepared with deionized water and certified reagent chemicals. The experiments were controlled by an automated potentiostat (Gamry Instruments series G 750) and corresponding software.
2.2 Characterization of passive films by Surface-Enhanced Raman Spectroscopy
The formation and breakdown of passive films formed on microcomposite steel was studied by in-situ Surface-Enhanced Raman Spectroscopy (SERS) experiments,
performed in conjunction with cyclic potentiodynamic polarization curves. Sections 2.2.1 and 2.2.2 present a brief introduction about these techniques, as well as the experimental setup used here. The polarization curves were cycled between -1200mV and +500mV (vs. Ag/AgCl reference), and SERS spectra were obtained as a function of potential at every 100mV during the potentiodynamic scans. Aqueous solutions composed by 0.55M KOH + 0.16M NaOH, with 0% and 3.5% NaCl, were used for the experiments. This solution (0.55M KOH + 0.16M NaOH) is referred by Taylor [41] as a typical
composition for the concrete pore solution found in concretes made with water-to-cement ratio of 0.5 and high alkali cement, and the concentration of chlorides (3.5% NaCl) represents what is normally found in seawater.
2.2.1 Surface Enhanced Raman Spectroscopy (SERS)
Surface Enhanced Raman Spectroscopy (SERS) is a powerful in situ technique used for the investigation of thin films. It provides a fingerprint for identifying the different species present, and is extremely surface-sensitive, being capable of detecting sub-monolayer quantities of passive films. Basically, the sample is hit with a laser beam, and while most of it is elastically scattered (with no change in photon energy), a small fraction of the photons exchange energy with the sample and is inelastically scattered, with a corresponding change of their wavelength that is characteristic of the energy change. This process is referred to as the Raman Effect. In surface enhanced Raman, the
Raman signal is greatly enhanced by silver or gold particles (~50nm) deposited onto the sample surface, making it possible to obtain surface enhanced Raman spectra from metals that are not usually Raman active, such as iron for instance [42-44].
A custom-designed electrochemical cell with removable optical lenses was designed and built in a way that electrochemical and in-situ SERS experiments could be performed simultaneously. Figure 2 illustrates the cell used for these experiments. In order to avoid glass etching due to the elevated pH of concrete pore solutions, the body of the cell is made of PVC, and the optical lenses are made of an optical plastic window (allyl diglycol carbonate monomer), referred to as CR-39, which was chosen due to its elevated
chemical resistance. The Raman response of the CR-39 window occurs at around 3100cm-1, which is out of our region of interest for this research.
Figure 2 Custom-designed electrochemical cell for simultaneous in-situ spectroscopic and electrochemical measurements [30]
The experimental setup, schematically represented in figure 3, basically consists of a Spectra-physics model Beamlok 2060 Argon laser (with power capacity of up to 10W) that is pumped into a Ti:Sapphire laser (Spectra-physics model 3900S). The laser is directed towards the sample by a set of mirrors and lenses, being focused to a small spot (0.5-1.0 mm) on the surface. The incident laser has a wavelength (λ) of 752nm. After the sample is hit, the Raman scattered radiation is collected, collimated and focused into a Spectrum One Spex 270M spectrometer. A Spectrum One CCD is connected to the spectrometer and records the intensity of the dispersed radiation.
Figure 3 Schematic representation of experimental setup for SERS measurements [43]
The sample is held in the aqueous solution of interest in the custom-designed electrochemical cell illustrated above (figure 2).
Laser alignment and focusing was conducted with the laser set to 1.7 W, and the Raman experiments were performed at the 2.5 W setting. Notice that the power density at the sample (in W/cm2), considering a spot size of about 0.5-1.0mm, was between
approximately 0.3×10³ W/cm2 and 1.3×10³ W/cm2. De Faria et al. [45], who have investigated the effect of laser power on the Raman spectra of Fe oxides and
corresponding to a power density of about 8.9×10⁴ W/cm2 at the specimen – and
concluded that no surface damage had occurred at that level. For Fe, thermal ablation is typically observed at approximately 106 W/cm2, which is three orders of magnitude higher than the power density used in this study.
2.2.2 Cyclic potentiodynamic polarization curves
Potentiodynamic polarization curves are a powerful tool for evaluating the corrosion behavior of alloys. In this technique – also referred to as linear sweep voltammetry, cyclic voltammetry or simply potential sweep – the potential is made to change at a constant rate over a chosen potential range, while the corrosion current density is observed. This experiment has been a widely used technique in electrochemistry. It is usually the first measurement to be carried out in a corrosion study, because it provides a “road map” for the experiment, indicating the potential regions where there is an
electrode activity [46].
After preparing the test sample as described in item 2.1, the specimen was immediately placed in the electrochemical cell and conditioned at -1200mV (vs. Ag/AgCl reference electrode) for two minutes in order to reduce any possible air-formed film. Then the potential was gradually increased, at a scan rate of 1mV/sec, from -1200mV to +500mV, and then reversed back to -1200mV. SERS measurements were made at every 100mV during the cyclic potentiodynamic polarization scans.
2.3 Evaluation of the effect of pH and ionic strength on corrosion performance
As described earlier (section 1.3.1), carbonation is one of the main causes of corrosion of conventional reinforcing steel in concrete structures. As a result of the carbonation
process (reaction of atmospheric CO2 with alkaline hydroxides in concrete), the pH of the
medium can be considerably reduced, leading to the breakdown of passive films and the onset of corrosion. Thus, it is of fundamental importance to evaluate the corrosion performance of microcomposite steel as a function of pH.
In this research, the corrosion resistance – expressed in terms of the polarization
resistance term (Rp) – was evaluated for both microcomposite and regular carbon steels as
a function of pH and ionic strength of the solution. The pH was varied from 9 to 13, and the ionic strength (Is) from 10-5 to 10-1. Half-cell potential and Linear Polarization
Resistance (LPR) experiments were performed in this study. Sections 2.3.1 and 2.3.2 present a brief introduction about these techniques, as well as details about the experimental setup used.
2.3.1 Half-cell Potential
The standard test method for half-cell potential measurements is described in ASTM C 876 (1997) [47]. The test apparatus is very simple, and consists of an external reference electrode, connecting wires and a high-impedance voltmeter that measures the potential difference between the rebar and the reference electrode.
If the bar is corroding, the excess electrons in the anode (the rebar) will tend to flow toward the cathode (the external electrode). Because of the way the terminals of the voltmeter are connected, the voltmeter indicates a negative voltage. A more negative
voltage reading is interpreted to mean that the embedded bar has more excess electrons and, therefore, there is a higher likelihood that the bar is corroding [33]. It is worth noting that, although the half-cell potential method may be used to obtain an indication of the likelihood of corrosion activity at the time of the measurement, it does not give any direct information on the rate of corrosion of the reinforcement [48].
In the present study, before performing a polarization resistance experiment, the test specimen – prepared according to the procedure described in section 2.1 – was placed in the electrochemical cell and exposed to the aqueous solution of interest for 30 minutes. After this period, and immediately before each LPR test, the open circuit potential (OCP) was recorded.
2.3.2 Linear Polarization Resistance (LPR)
The linear polarization resistance technique, or simply polarization resistance, is a well-established method for determining corrosion rate by using electrolytic test cells,
described in ASTM G59 [49]. This technique involves measuring the change in the open-circuit potential of the electrolytic cell when an external current is applied to it.
For a small perturbation about the open-circuit potential, there is a linear relationship between the change in applied current per unit area of electrode (Δi) and the change in the measured voltage (ΔE). The ratio ΔE/Δi gives the polarization resistance term (Rp). The
corrosion rate, expressed as the corrosion current density, is inversely related to the polarization resistance (Rp).
As briefly mentioned earlier, in this study the test specimen was placed in the
electrochemical cell and exposed to the aqueous solution of interest for 30 minutes before beginning a polarization resistance experiment. Then the open circuit potential (OCP)
was measured and a potential variation of -15mV to +15mV over OCP applied at a scan rate of 0.125mV/sec, while the corresponding changes in current were recorded.
In order to properly evaluate the corrosion behavior of microcomposite steel, and particularly to compare the relative performance of microcomposite and carbon steels, this test was performed at several pH levels (from pH=13 to pH=9). In a first set of experiments, the concentration of sodium hydroxide (NaOH) was varied without controlling the ionic strength of the solution. Iin a second set of tests, in addition to changing the pH, the ionic strength of the medium was kept constant (Is= 10-1) by adding
potassium sulfate (K2SO4) to the solution in different concentrations. Potassium sulfate
was chosen because it has no influence on the pH of the solution and is generally not expected to attack the steel. Naturally aerated aqueous solutions were prepared
immediately before each test. As discussed later in the results section (chapter 3), carbon steel typically loses its passive film at pH values between 11 and 10, while
microcomposite steel has maintained its corrosion resistance at lower-pH levels. Table 1 below presents the chemical composition of the aqueous solutions used for the linear polarization resistance tests.
Table 1 Solutions used for the linear polarization resistance experiments
(a) Variable pH (from 9 to 13) and variable ionic strength (μ from 10-5 to 10-1)
pH NaOH (mol/l) Is 13 0.1 1E-01 12 0.01 1E-02 11 0.001 1E-03 10 0.0001 1E-04 9 0.00001 1E-05
(b) Variable pH (from 9 to 13) and constant ionic strength (μ = 10-1)
pH NaOH (mol/l) Is K2SO4 (mol/l) 13 0.1 0.1 -- 12 0.01 0.1 0.03 11 0.001 0.1 0.033 10 0.0001 0.1 0.0333 9 0.00001 0.1 0.03333
2.4 Evaluation of the effect of chlorides on the corrosion performance and
determination of the chloride threshold ratio [Cl-]/[OH-]
Considering that chloride attack is one of the main causes of passive film breakdown and corrosion of steel reinforcement in concrete structures (see section 1.3.2), and that the onset of corrosion takes place after the concentration of chlorides ions in solution reaches a threshold value that depends on the type of steel being used, this study was aimed to investigate the corrosion behavior of microcomposite steel as a function of chlorides. In addition, the chloride threshold ratio (expressed as [Cl-]/[OH-]) required for the initiation of pitting corrosion was determined for microcomposite steel. Section 2.4.1 below describes the experimental technique and setup used for this study.
2.4.1 Potentiodynamic polarization curves
Potentiodynamic polarization curves, previously described in section 2.2.2, were also used to evaluate the effect of chlorides in the corrosion performance of microcomposite
steels. In the presence of chlorides, the onset of pitting corrosion can be verified in this test by the shifting of the transpassive-region-potential to lower values during the forward (anodic) scan. This new potential value is referred to as the pitting potential (Δφpit).
Pitting corrosion is initiated when a chloride threshold value (as represented by the ratio between Cl- and OH- ions in solution, or [Cl-]/[OH-]) is exceeded. A simulated concrete pore solution with constant [OH-] (0.55M KOH + 0.16M NaOH, as described by Taylor [41]) has been used for the tests, while the concentration of Cl- ions was changed by adding sodium chloride (NaCl) to the solutions. Additional experiments with a lower-pH pore solution (0.24M KOH + 0.08M NaOH) were performed in order to verify the value of the [Cl-]/[OH-] ratio. Table 2 below presents the chemical composition of pore
solutions used in this study.
Table 2 Aqueous solutions used for the linear polarization resistance experiments
[Cl-]/[OH-] [KOH] [NaOH] [OH-] [Cl-]
NaCl (g/l) 0.0 0.55 0.16 0.71 0.00 0.00 0.8 0.55 0.16 0.71 0.57 33.19 1.2 0.55 0.16 0.71 0.85 49.79 2.0 0.55 0.16 0.71 1.42 82.98 3.0 0.55 0.16 0.71 2.13 124.48 4.0 0.55 0.16 0.71 2.84 165.97 5.0 0.55 0.16 0.71 3.55 207.46 6.0 0.55 0.16 0.71 4.26 248.95 7.0 0.55 0.16 0.71 4.97 290.45 0.0 0.24 0.08 0.32 0.00 0.00 2.0 0.24 0.08 0.32 0.64 37.40 3.0 0.24 0.08 0.32 0.96 56.10 4.0 0.24 0.08 0.32 1.28 74.80
3 Results and Discussion
Experimental results and discussions are presented in this chapter. Results are initially presented along with a short description of the main features that can be observed, followed by their interpretation and discussion.
3.1 Cyclic Potentiodynamic Polarization Curves and SERS
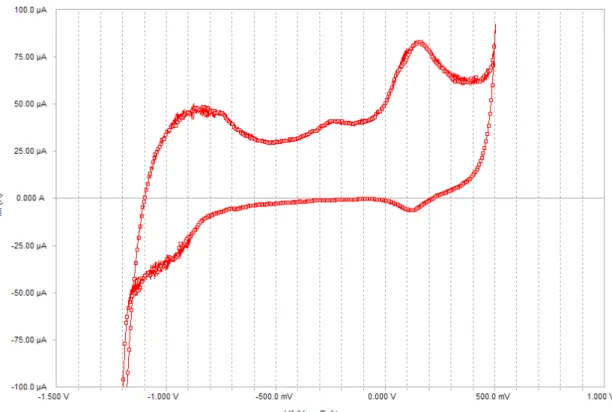
As described in section 2.2, Surface-Enhanced Raman Spectroscopy (SERS) experiments were performed as a function of applied potential. Figures 4 and 5 illustrate the cyclic potentiodynamic polarization curves for microcomposite steel in 0.55M KOH + 0.16M NaOH solution, with 0% and 3.5% NaCl, respectively. The 0.55M KOH + 0.16M NaOH pore solution represents a typical composition for concretes made with a 0.5 water-to-cement ratio and high alkali water-to-cement [41], and the 3.5% NaCl concentration corresponds to what is normally found in seawater. During the forward (anodic) scan, the potential was increased from -1200mV up to + 500mV at a scan rate of 1mV/sec, and then reversed back to -1200mV at a same rate in the reverse (cathodic) scan. SERS spectra were obtained at every 100mV, during both forward and reverse scans, as indicated in the figures by the dashed gridlines.
Both curves are characterized by the occurrence of three main anodic peaks during the forward scan, and two cathodic peaks during the reverse scan. The first anodic peak happens between approximately -1000mV and -600mV, being centered around -800mV; the second anodic peak, considerably smaller than the other two, happens between about -500mV and -100mV and it is centered around -240mV; the third anodic peak starts forming around -100mV and goes up to about +300mV.
Figure 4 Cyclic potentiodynamic polarization curve, microcomposite steel. Solution 0.55M KOH + 0.16M NaOH.
Figure 5 Cyclic potentiodynamic polarization curve, microcomposite steel. Solution 0.55M KOH + 0.16M NaOH + 3.5% NaCl.
In the reverse scan, the first reduction (cathodic) peaks occurs between approximately +250mV and 0V, being centered at about -120mV. The second cathodic peak seems to start forming around -750mV and is centered at about -1000mV.
Figure 6 shows a comparison between the polarization curves obtained in the experiments with and without chlorides. It can be noticed that there is very little difference between the two. The number and location of peaks is virtually the same, as well as the value of the current density throughout the test. The only exception is that the current density after the third oxidation peak is slightly higher for the steel immersed in the solution with 3.5% sodium chloride. -40.0 -30.0 -20.0 -10.0 0.0 10.0 20.0 30.0 40.0 -1.50 -1.00 -0.50 0.00 0.50 1.00 Vf (V vs. Ref.) I (μ A/ c m 2) 0.55M KOH + 0.16M NaOH
0.55M KOH + 0.16M NaOH + 3.5% NaCl
Figure 6 Cyclic potentiodynamic polarization curves, microcomposite steel. Comparison between 0.55M KOH + 0.16M NaOH solutions with 0% and 3.5% NaCl.
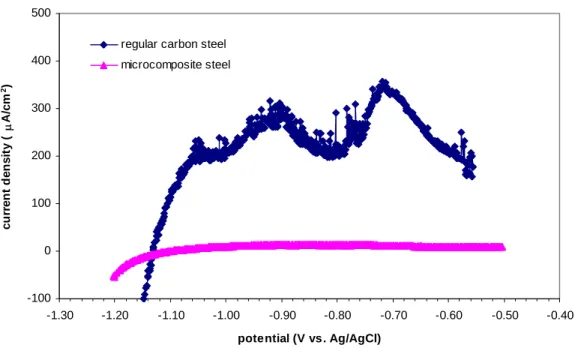
The polarization curves obtained for microcomposite steel show considerably lower corrosion current density values, as compared with regular carbon steel rebar, as
illustrated in figure 7. This figure shows anodic scans for both carbon steel rebar [30] and microcomposite steel in 0.55M KOH + 0.16M NaOH solution, following the same experimental procedure. -100 0 100 200 300 400 500 -1.30 -1.20 -1.10 -1.00 -0.90 -0.80 -0.70 -0.60 -0.50 -0.40 potential (V vs. Ag/AgCl) c u rr e nt d e ns it y ( μ A/ c m 2)
regular carbon steel microcomposite steel
Figure 7 Anodic potentiodynamic polarization curves, microcomposite and regular carbon steel. Solution 0.55M KOH + 0.16M NaOH. Both samples were gold-plated for SERS.
After passivation, the current density for microcomposite steel was around 11 μA/cm2, while that for carbon steel was about 140 μA/cm2 (~13 times higher). If these values were used to estimate corrosion rates, one would get approximately 1627 μm/yr (1.63 mm/yr) for carbon steel and 128 μm/yr (0.128 mm/yr) for microcomposite steel.
3.1.1 SERS spectra
While polarization curves provide a general overview of the corrosion behavior of the material as a function of potential, and identify the regions of electrode activity, the surface-enhanced Raman spectra allow us to probe the composition of the chemical species being formed in order to better understand the features observed in a polarization curve. The experimental setup, described in item 2.2, is such that the referred
experiments can be performed simultaneously.
Figures 8 to 12 show the main SERS spectra obtained for microcomposite steel in 0.55M KOH + 0.16M NaOH + 3.5% NaCl solution, as a function of applied potential, while figures 13 through 17 present the SERS results for microcomposite steel in 0.55M KOH + 0.16M NaOH solution. Individual SERS peak-fitting analyses are shown in Appendix A, while summary tables with peak fitting parameters (center, width, height and area for the peaks in each spectrum) are presented in Appendix B.
Due to the surface-enhancement, the Raman signal obtained in the present research is considerably stronger than what could be measured in previous studies that have used Raman spectroscopy to study passive films formed on steel in alkaline solutions (e.g. [28], [29] and [50]).
Similarly to what has been observed for the polarization curves, the SERS spectra for the solutions with and without chlorides were very similar to each other (see figures 8-12 and 13-18). The only differences were essentially slight changes in the intensity of the
acquired spectra. As will be further discussed in section 2.4, the concentration of
chlorides used here (3.5% NaCl, or about 0.6M of Cl- in solution) – although equivalent to the typical concentrations found in seawater – is considerably lower than the levels required for corrosion initiation in microcomposite steel in concrete pore solutions.
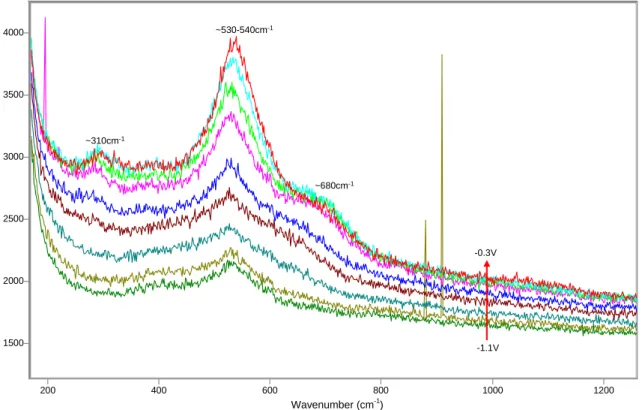
1500 2000 2500 3000 3500 4000 200 400 600 800 1000 1200 ~530-540cm-1 ~680cm-1 ~310cm-1 -0.3V -1.1V
Figure 8 SERS spectra between -1.1V and -0.3V, microcomposite steel, solution 0.55M KOH + 0.16M NaOH + 3.5% NaCl. 1500 2000 2500 3000 3500 4000 200 400 600 800 1000 1200 -0.2V +0.3V ~590cm-1 ~815-820cm-1
Figure 9 SERS spectra between -0.2V and +0.3V, microcomposite steel, solution 0.55M KOH + 0.16M NaOH + 3.5% NaCl.
Wavenumber (cm-1)
Wavenumber (cm-1
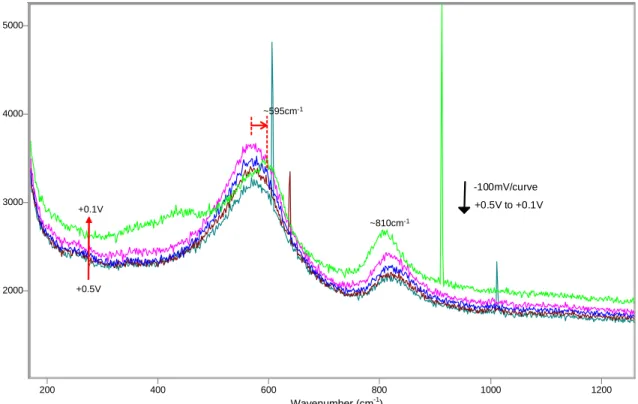
2000 3000 4000 5000 200 400 600 800 1000 1200 -1.2V +0.5V to +0.1V -100mV/curve ~595cm-1 ~810cm-1 +0.1V +0.5V
Figure 10 SERS spectra between +0.5V and +0.1V (reverse scan), microcomposite steel, solution 0.55M KOH + 0.16M NaOH + 3.5% NaCl.
2000 3000 4000 5000 200 400 600 800 1000 1200 (+0.1V to -0.5V) -100mV/curve ~810cm-1 ~595cm-1 -0.5V +0.1V ~555cm-1
Figure 11 SERS spectra between +0.1V and -0.5V (reverse scan), microcomposite steel, solution 0.55M KOH + 0.16M NaOH + 3.5% NaCl.
Wavenumber (cm-1)
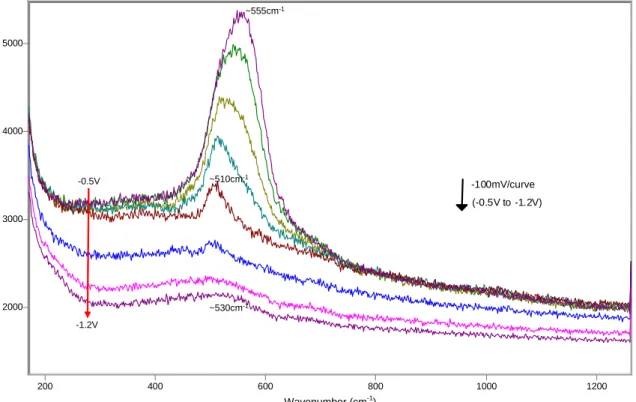
2000 3000 4000 5000 200 400 600 800 1000 1200 (-0.5V to -1.2V) -100mV/curve ~555cm-1 ~510cm-1 ~530cm-1 -0.5V -1.2V
Figure 12 SERS spectra between -0.5V and -1.2V (reverse scan), microcomposite steel, solution 0.55M KOH + 0.16M NaOH + 3.5% NaCl.
From the start, at potentials as low as -1200mV and -1100mV, the film is characterized by the presence of a strong peak at 530cm-1, which keeps growing steadily during the first oxidation peak verified in the polarization curve (see figures 5 and 8, and refer to the tables on Appendix B for more details on peak parameters). A new peak located at ~650cm-1 appears between -900mV and -800mV, followed by a smaller peak at ~280cm
-1
, which is detected for the first time at -700mV. At this same potential, the peak at ~650cm-1 doubles in area and appears as a pronounced shoulder in the spectrum. Both peaks continue to grow as the potential is further increased, as the peak located initially at ~650cm-1 shifts to ~675cm-1 at -600mV and then ~690cm-1 between -500mV and -400mV. A small peak at ~390cm-1 appears for the first time between -700mV and -600mV, but shows a considerable growth only when the potential increased between
Wavenumber (cm-1
-500mV and -100mV, which coincides with the occurrence of the second anodic peak in the polarization curve. At the same time, the peak at ~690cm-1 shifts to about 590cm-1 at -100mV and stabilizes at ~600cm-1 at potentials of 0V and higher. Similarly, the main peak at ~530cm-1 shifts to ~550cm-1 in the same potential range. In addition, a new peak at ~810cm-1 appears at 0V, and continues to grow significantly during the third oxidation peak observed in the corresponding polarization curve. A fourth peak, located at about 460cm-1, is also present at potentials higher than 0V. In summary, after the third
oxidation peak, the surface film is characterized by bands located at ~460cm-1, ~560cm-1, ~600cm-1 and ~810cm-1 (see figure 9).
Table 3 presents the locations of peaks in the Raman spectra of selected Fe and Cr oxides, hydroxides and oxyhydroxides. The data was compiled from several sources, and represents a summary of an extensive literature review of peak locations, presented in references [51] and [52].
Table 3 Locations of characteristic peaks in the Raman spectra of selected Iron and Chromium oxides, hydroxides and oxyhydroxides (cm-1). High-intensity modes are underlined. [51, 52]
Fe (II) Fe(OH)2 460 550 Fe (II, III) Fe3O4 300 320 420 540-560 663-680 α-Fe2O3 225-227 245 293-295 413-415 500-501 612-615 1320 γ-Fe2O3 263-265 300 345-350 380-395 505-515 645-650 660-670 710-715, 740 1440 α-FeOOH 245-250 298-300 385-397 414-420 470-480 550-560 685 1003 β-FeOOH 330 400-415 725-745 γ-FeOOH 252-255 380 526-528 650-660 1054 1307 δ-FeOOH 400 663-664 (broad) Fe(OH)3 692 (broad) Cr(OH)3 530 Cr2O3 300-306 342-351 397 540-551 602-609 Cr (VI) CrO3 213-233 336 376 399 495 562 975 1001 Fe (III) Cr (III) Iron Ch ro m iu m
Species Peaks (high intensity modes underlined)
It seems clear that the main peak at ~530cm-1, which dominates the spectra up to about -300mV, can be confidently assigned to Cr(OH)3. This species is thermodynamically
stable in this potential range [53], and seems to be an ubiquitous phase in passive films formed on chromium and stainless steels in neutral and mildly alkaline solutions [52]. Also during the first oxidation peak, and more specifically around -700 mV to -600mV, Fe3O4 is also likely being formed, which can account for the other Raman peaks observed
in this region. At potentials between about -600mV and -400mV, however, the Fe3O4 (Fe
II, III) phase seems to further oxidize into a Fe (III) phase composed most likely of γ -Fe2O3. The combined formation of α-FeOOH would also be possible. These observations
(except the chromium phase) seem quite consistent with what has been observed for the passive films formed on carbon steel under the same conditions, as reported in ref. [30]. Nevertheless, it should be noted that the peak at ~530cm-1 (assigned to Cr(OH)3) remains
considerably larger than the secondary peaks assigned to the iron species at these
potential levels (see, for instance, spectrum at -300mV). Cr(OH)3 seems therefore to be a
key component in the passive film formed on microcomposite steel.
At higher potentials, as the third anodic peak takes place in the polarization curve, the Raman spectra change considerably and are finally characterized by peaks at ~460cm-1, ~560cm-1, ~600cm-1 and ~810cm-1 as discussed above. There is no single or known species that could account for the all the referred peaks. The peak at about 810cm-1 has also been observed in previous studies on the characterization of passive films formed on chromium and stainless steel [52, 42], but has not received much attention as it was believed that it might correspond to Carbon species [52]. Species like Cr2O5 and Cr3O8
show bands at 814cm-1 and 825cm-1 [54], but the main peaks associated with these phases (885cm-1 and 902cm-1, respectively) are not present here. One other possibility, raised more recently in concurrent studies, is that the peak at ~810-815cm-1 might be associated
with the formation of a Cr(VI) species. The peaks formed at ~560cm-1 and ~600cm-1 could be possibly assigned to the formation of Cr2O3 (see table 3), but a high-intensity
peak corresponding to this phase (at about 300-306cm-1) is not present in the spectra obtained in this study. Besides that, according to Oblonsky and Devine [52], the presence of a peak at ~600cm-1 might be due to the formation of a Cr(OH)2-like species, or
perhaps CrOOH. It is noted, however, that bulk Cr(OH)2 is not thermodynamically stable
in water, and therefore it would be necessary to assume the presence of a Cr(III) barrier above Cr(OH)2. Ferrous hydroxide (Fe(OH)2) has peaks at 460cm-1 and 550cm-1 (which
would match two of the observed peaks), however this species seems to occur at much lower potentials in the passive films formed on carbon steel in concrete pore solutions [30]. In addition, as can be observed in figure 13, which shows Raman spectra of gold in 0.55M KOH + 0.16M NaOH solution, the formation of a gold oxide which has a
relatively strong Raman peak at ~550-570cm-1 is also verified at this potential range.
4000 6000 8000 10000 12000 14000 200 400 600 800 1000 1200 +1.0V +0.25V ~550cm-1 ~570cm-1 +0.40V
Figure 13 SERS spectra of gold at +0.25V, +0.40V and +1.0V; solution 0.55M KOH + 0.16M NaOH.
Thus the oxidation of the deposited gold particles (due to the Raman signal surface-enhancement process) is at least partially responsible for the observed peak at ~550cm-1. In the reverse scan (figures 10-12), no significant changes can be observed before the potential was reduced to +100mV. At this potential, the peak at ~550cm-1 shows a significant reduction, and the peak at ~600cm-1 grows slightly. The decrease in the ~550cm-1 peak at this point is likely due to the reduction of the gold oxide formed at higher potentials. In addition, a broad peak at about ~440cm-1 re-appears, which matches well what had been previously observed at +100mv during the forward scan. As the potential is further reduced from +100mV to -400mV (figure 11), the peak at ~810cm-1 is completely eliminated (see tables in Appendix B for additional details and peak
parameters), and the peaks at ~550cm-1 and 590-600cm-1 grow considerably. Notice that there is no cathodic peak forming between +100mV and -400mV during the reverse scan in the polarization curves, indicating that the phase corresponding to the peak at about 810cm-1 (possibly a Cr(VI) species) is likely going through chemical dissolution. It should be mentioned that, even if chemical dissolution of Cr(VI) species from the film is confirmed, the resulting concentrations of this ion in solution would be significantly smaller than the corresponding EPA standards for water potability. Also, this phase (responsible for the ~810cm-1 peak) appears to constitute an outer layer of the passive film. As this outer layer is removed, other phases corresponding to the peaks at ~550cm-1 and 590-600cm-1 are re-exposed and the corresponding bands thus gain in intensity. At -500mV, the peak at ~530cm-1 (corresponding to Cr(OH)3) has become once again the
cyclic polarization curve, and going through the second cathodic peak in the reverse scan, the film is reduced to its starting condition.
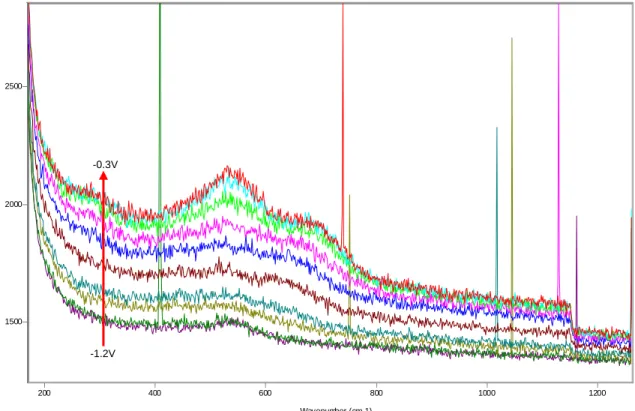
As previously noted, the SERS spectra for the solutions with and without chlorides were very similar to each other. No significant difference in the formation of Raman peaks could be observed in the spectra, except for a slight change in intensity (which is possibly related to changes in the laser alignment), as can be verified by comparing figures 8-12 and 13-18. 1500 2000 2500 200 400 600 800 1000 1200 Wavenumber (cm-1)
Figure 14 SERS spectra between -1.2V and -0.3V, microcomposite steel, solution 0.55M KOH + 0.16M NaOH.
-1.2V -0.3V
1500 2000 2500
200 400 600 800 1000 1200
Wavenumber (cm-1)
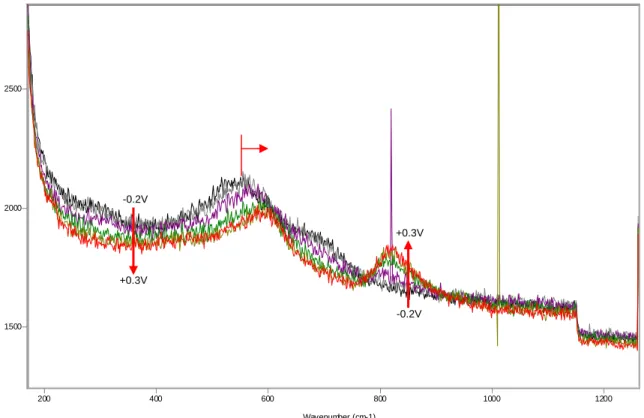
Figure 15 SERS spectra between -0.2V and +0.3V, microcomposite steel, solution 0.55M KOH + 0.16M NaOH. 1500 2000 2500 200 400 600 800 1000 1200 Wavenumber (cm-1)
Figure 16 SERS spectra between +0.5V and 0.0V (reverse scan), microcomposite steel, solution 0.55M KOH + 0.16M NaOH. -0.2V +0.3V +0.3V -0.2V +0.5V 0.0V
1500 2000 2500
200 400 600 800 1000 1200
Wavenumber (cm-1)
Figure 17 SERS spectra between 0.0V and -0.5V (reverse scan), microcomposite steel, solution 0.55M KOH + 0.16M NaOH. 1500 2000 2500 200 400 600 800 1000 1200 Wavenumber (cm-1)
Figure 18 SERS spectra between -0.5V and -1.2V (reverse scan), microcomposite steel, solution 0.55M KOH + 0.16M NaOH.
0.0V -0.5V
-0.5V
3.2 Effect of pH and ionic strength on corrosion performance
In this study, the pH of the environment was varied from 13 to 9, and the ionic strength (Is) from 10-1 to 10-5. Details about the experimental procedures and the composition of
the aqueous solutions used are presented in section 2.3.2.
3.2.1 Variable pH and constant ionic strength
Figure 19 below illustrates the results obtained for regular carbon steel rebar immersed in aqueous solutions in which the pH was varied by changing the concentration of NaOH (from 10-1 to 10-5 mol/l) and the ionic strength of the medium was kept constant (Is=10-1)
by adding potassium sulfate (K2SO4) to the solution. Potassium sulfate was chosen
because it has no influence on the pH of the solution and is generally not expected to attack the steel. In this figure, only the variations about the open-circuit values of
potential and current are plotted. Individual curves for each solution tested, including the absolute values of potential and current, are included in Appendix B. The slope of each line at the origin provides the polarization resistance term (Rp). The variation of Rp with
pH for carbon steel rebar when the ionic strength is kept constant is presented in figure 20.
-20.0 -15.0 -10.0 -5.0 0.0 5.0 10.0 15.0 20.0 -1.25 -1.00 -0.75 -0.50 -0.25 0.00 0.25 0.50 0.75 1.00 1.25 ΔI (μA) Δ V (m V v s . A g /A g C l) pH=13, Is=0.1 pH=12, Is=0.1 pH=11, Is=0.1 pH=10, Is=0.1 pH=9, Is=0.1
Figure 19 Polarization resistance, comparative plot showing ΔI vs. ΔV, carbon steel rebar. Solutions with variable pH (9 to 13) and constant ionic strength (μ =10-1).
26.26 19.10 0.58 0.55 0.74 0 5 10 15 20 25 30 35 40 45 50 pH=13, Is=1E-1 pH=12, Is=1E-1 pH=11, Is=1E-1 pH=10, Is=1E-1 pH=9.0, Is=1E-1 Solution R p ( k ohm s )
Figure 20 Polarization resistance (Rp), carbon steel rebar. Solutions with variable pH (9 to 13) and constant ionic strength (μ=10-1).
It can be noticed in figure 20 that the polarization resistance of carbon steel decreases as the pH of the environment is reduced, and a strong decline is verified at pH values of 11 and lower. This behavior is consistent with what would be generally expected for carbon steel in concrete pore solutions, as previously discussed in section 1.3.1.
The polarization resistance results obtained for microcomposite steel rebar, under the same test conditions, are presented in figure 21. The variation of Rp with pH for
microcomposite steel when the ionic strength is kept constant is shown in figure 22.
-20.0 -15.0 -10.0 -5.0 0.0 5.0 10.0 15.0 20.0 -1.25 -1.00 -0.75 -0.50 -0.25 0.00 0.25 0.50 0.75 1.00 1.25 ΔI (μA) Δ V (mV vs . Ag /A gC l) pH=13, m=0.1 pH=12, m=0.1 pH=11, m=0.1 pH=10, m=0.1 pH=9, m=0.1
Figure 21 Polarization resistance, comparative plot showing ΔI vs. ΔV, microcomposite steel. Solutions with variable pH (9 to 13) and constant ionic strength (μ =10-1).
23.51 24.86 28.94 20.86 19.36 0 5 10 15 20 25 30 35 40 45 50 pH=13, u=1E-1 pH=12, u=1E-1 pH=11, u=1E-1 pH=10, u=1E-1 pH=9.0, u=1E-1 Solution Rp (ko h m s )
Figure 22 Polarization resistance (Rp), microcomposite steel. Solutions with variable pH (9 to 13) and constant ionic strength (μ=10-1).
It can be noticed that microcomposite steel has not shown a reduction of polarization resistance as a function of pH (figure 22), in a stark contrast to the behavior verified for the regular carbon steel rebar (figure 20). As mentioned in section 2.3.2, the Rp value is
inversely related to the corrosion rate, and therefore the greater Rp, the lower will be the
corrosion rate.
Table 4 presents a comparative summary of the polarization resistance results obtained for both steels as a function of pH when the ionic strength of the environment is kept constant.
Table 4 Comparative summary, polarization resistance as a function of pH for both regular carbon and microcomposite steel, constant ionic strength.
pH Is Rp (kohms) OCP (mV) 13 0.10 26.26 -276.1 12 0.10 19.10 -318.6 11 0.10 0.74 -576.5 10 0.10 0.55 -565.2 9 0.10 0.58 -555.9 13 0.10 23.51 -404.1 12 0.10 24.86 -336.3 11 0.10 20.86 -299.3 10 0.10 19.36 -225.2 9 0.10 28.94 -148.8 Carb on stee l Mic ro -co mposite
3.2.2 Variable pH and variable ionic strength
Figure 23 presents the results of the linear polarization tests for carbon steel rebar in solutions in which the pH was varied by changing the concentration of NaOH (from 10-1 to 10-5 mol/l). No compensation was made to account for the changes in ionic strength, which thus changed between 10-1 to 10-5 (see section 2.3 for the chemical composition of the pore solutions used). The variation of Rp with pH when the ionic strength is also
varied is presented in figure 24, (log of Rp). It can be noticed that Rp is relatively constant
This behavior is likely due to the fact that the solubility of some iron oxides/hydroxides – like Fe(OH)2 for instance – is minimized at about pH=11 [53, 55, 56], which could in
turn lead to the formation of a less porous, more protective and thinner passive film on the surface of the steel.
-20.0 -15.0 -10.0 -5.0 0.0 5.0 10.0 15.0 20.0 -1.25 -1.00 -0.75 -0.50 -0.25 0.00 0.25 0.50 0.75 1.00 1.25 ΔI (μA) Δ V ( m V v s . Ag/ A gCl) pH=13, Is=0.1 pH=12, Is=0.01 pH=11, Is=0.001 pH=10, Is=0.0001 pH=9, Is=0.00001
Figure 23 Polarization resistance, comparative plot showing ΔI vs. ΔV, carbon steel rebar. Solutions with variable and variable ionic strength.
1.42 1.45 1.34 1.38 5.54 1.00 10.00 pH=13, Is=1E-1 pH=12, Is=1E-2 pH=11, Is=1E-3 pH=10, Is=1E-4 pH=9, Is=1E-5 Solution Log( R p )
Figure 24 Polarization resistance (Rp), microcomposite steel. Solutions with variable pH and variable ionic strength.
The polarization resistance results obtained for microcomposite steel rebar, under the same test conditions, are presented in figure 25. The variation of Rp with pH for
microcomposite steel when the ionic strength is kept constant is shown in figure 26.
-20.0 -15.0 -10.0 -5.0 0.0 5.0 10.0 15.0 20.0 -1.25 -1.00 -0.75 -0.50 -0.25 0.00 0.25 0.50 0.75 1.00 1.25 ΔI (μA) Δ V (mV vs . Ag /A gC l) pH=13 pH=12 pH=11 pH=10 pH=9
Figure 25 Polarization resistance, comparative plot showing ΔI vs. ΔV , microcomposite steel. Solutions with variable pH and variable ionic strength.
1.37 1.42 1.64 1.42 5.14 1.00 10.00 pH=13, u=1E-1 pH=12, u=1E-2 pH=11, u=1E-3 pH=10, u=1E-4 pH=9.0, u=1E-5 Solution Lo g ( R p)
Figure 26 Polarization resistance (Log Rp), microcomposite steel. Solutions with variable pH and variable ionic strength.
Table 5 presents a comparative summary of the polarization resistance results obtained for both steels as a function of pH when the ionic strength of the environment was not controlled.
Table 5 Comparative summary, polarization resistance as a function of pH for both regular carbon and microcomposite steel, variable ionic strength.
pH Is Rp (kohms) log(Rp) OCP (mV)
13 0.1 26.26 -276.1 1.42 12 0.01 28.43 -317.0 1.45 11 0.001 347900 -275.5 5.54 10 0.0001 23.84 -208.2 1.38 9 0.00001 21.84 -285.6 1.34 13 0.1 23.51 -404.1 1.37 12 0.01 26.59 -358.2 1.42 11 0.001 139000 -318.0 5.14 10 0.0001 26.33 -259.2 1.42 9 0.00001 43.78 -197.3 1.64 Carb on stee l Mic ro -co mposite
The behavior illustrated in figures 24 and 26 is obviously quite different than what would be usually expected for steel in concrete pore solutions, which illustrates the importance of controlling the variable ionic strength when studying the effect of pH on the corrosion performance of steel alloys. Furthermore, it seems that the effect of pH is in fact a function of the ionic strength of the medium.
It should be mentioned that the study presented in this section is not meant to be a comprehensive review on the effects of pH and ionic strength on the corrosion
performance of low carbon steel rebar and microcomposite steel in alkaline environments such as concrete pore solutions, but rather to gain additional insight into the corrosion behavior of microcomposite steel and investigate the differences in performance between this alloy and regular carbon steel rebar. Additional studies on the effect of ionic strength on passive film formation, and corrosion performance in general, should be performed in order to enhance the understanding of the phenomena reported here.
![Figure 1 Schematic representation of the advance of the depassivation front in a cracked region [31]](https://thumb-us.123doks.com/thumbv2/123dok_us/10058244.2498603/14.918.270.666.574.832/figure-schematic-representation-advance-depassivation-cracked-region.webp)
![Figure 2 Custom-designed electrochemical cell for simultaneous in-situ spectroscopic and electrochemical measurements [30]](https://thumb-us.123doks.com/thumbv2/123dok_us/10058244.2498603/20.918.177.734.565.961/figure-custom-designed-electrochemical-simultaneous-spectroscopic-electrochemical-measurements.webp)
![Table 2 Aqueous solutions used for the linear polarization resistance experiments [Cl - ]/[OH - ] [KOH] [NaOH] [OH - ] [Cl - ]](https://thumb-us.123doks.com/thumbv2/123dok_us/10058244.2498603/27.918.223.692.595.892/table-aqueous-solutions-linear-polarization-resistance-experiments-naoh.webp)