M
ultilateral Banking and
Development Financing in a
Context of Financial Volatility
Daniel Titelman
S E R
I E
financiamiento del desarrollo
Santiago, Chile, June 2002
121
Special Studies Unit
Executive Secretariat OfficeSpecial Studies Unit of ECLAC. The author wants to express his gratitude to Andras Uthoff, Coordinator, for his collaboration and comments to an initial version of this work and to Philippe Ferreira Portela, Research Assistant, for his invaluable statistical support. This study was conducted as part of the Korea Institute for International Economic Policy (KIEP)/Economic Commission for Latin America and the Caribbean (ECLAC) ROK01018 technical cooperation project: “The Role of the International Financial Institutions in the Development of Economic and Social Infrastructure in Latin America”.
The views expressed in this document, which has been reproduced without formal editing, are those of the author and do not necessarily reflect the views of the Organisation.
United Nations Publication LC/L.1746-P
ISBN: 92-1-121358-4 ISSN: 1564-4197
Copyright © United Nations, June 2002. All rights reserved. Sales No.: E.02.II.G.58
Printed in the United Nations, Santiago de Chile
Applications for the right to reproduce this work are welcome and should be sent to the Secretary of the Publications Board, United Nations Headquarters, New York, N. Y. 10017, U.S.A. Member States and their governmental institutions may reproduce this work without prior authorisation, but are requested to mention the source and inform the United Nations of such reproduction.
Contents
Abstract... 5
I. Introduction... 7
II. Anatomy of capital flows... 9
III. Vulnerability... 15
IV. Performance and macroeconomic policy... 19
V. The role of multilateral development agencies... 25
A. The Andean Development Corporation (Corporación Andina de Fomento (CAF)) ... 26
B. The Caribbean Development Bank (CDB)... 29
C. The Inter-American Development Bank (IDB) ... 32
D. The Latin American Reserve Fund... 38
E. The World Bank ... 38
VI. Summary and conclusions... 41
References... 43
Annex ... 45
Serie Financiamiento del desarrollo: issues published... 49
Tables
Table 1 Latin America and the Caribbean: Sources of External Financing ... 10Table 2 Net Private Capital Inflows, 1990-1999 ... 12
Table 3 Contribution of long-term External Financing by Groups of Countries... 13
Table 4 Latin America and the Caribbean: Workers’ Remittances... 14
Table 5 Indicators of External Vulnerability of Developing Countries ... 17
Table 6 Latin America and the Caribbean: Balance of Payments by groups of countries (1990-2000) ... 18
Table 7 Latin America and the Caribbean: Changes in Some Macroeconomic Variables 1990-2000 ... 20
Table 8 Latin America and the Caribbean: Foreign Exchange Regimes, 2000 ... 22
Table 9 Loan Approvals to the Andean countries, by the Andean Development Corporation (Corporación Andina de Fomento (CAF)), the Inter-American Development Bank (IDB) and the World Bank (1995-2000) ... 27
Table 10 Andean Development Corporation (Corporación Andina de Fomento (CAF)): Approval of Operations by Country, Operating Terms and Institutional Sector ... 27
Table 11 Loan Approvals by the Andean Development Corporation (Corporación Andina de Fomento (CAF)), for Projects and Programmes, by Economic Sector ... 28
Table 12 Caribbean Development Bank (CDB): Distribution of Loans, Contingent Loans, Equity and Grants Approved (net) by Countries ... 30
Table 13 Caribbean Development Bank (CDB): Summary of Total Financing Approved (net): Loans, Contingent Loans, Equity and Grants... 30
Table 14 Caribbean Development Bank (CDB): Summary of Total Financing Approved (net) by sector: Loans, Contingent Loans, Equity and Grants ... 31
Table 15 Inter-American Development Bank (IDB): Loan Approvals, Annual and Cumulative (1961-2000) ... 32
Table 16 Inter-American Development Bank (IDB): Non-Reimbursable Technical Cooperation ... 33
Table 17 Inter-American Development Bank (IDB): Disbursements, Annual and Cumulative (1961-2000) ... 34
Table 18 Inter-American Development Bank (IDB): Distribution of Loans by Sector ... 35
Table 19 Total Cost of Projects and Inter-American Development Bank (IDB) Contribution... 37
Table 20 Financing Provided to the Andean Countries by the Latin American Reserve Fund... 39
Table 21 World Bank: Regional Distribution of Loans ... 39
Table 22 World Bank: Distribution of Loans by Sector in Latin America and the Caribbean... 40
Figures
Figure 1 Latin America and the Caribbean: International Bond Issues... 10Latin America and the Caribbean: Conditions Governing International Bond Issues... 11
Figure 2 Eurobond differentials (1997-2000)... 16
Emerging Market Bond Index Global (EMBIG)... 16
Figure 3 Latin America: Basic Macroeconomic Indicators (1980-1999)... 21
Figure 4 Latin America and the Caribbean: Indexes of Real Effective Exchange Rates for Imports ... 22
Figure 5 GDP Growth and Net Transfer of Resources... 23
Figure 6 The role of the Andean Development Corporation (Corporación Andina de Fomento (CAF)) as Financial Intermediary ... 29
Abstract
In the 1990s, the economic performance of the Latin American and Caribbean economies was highly dependent on capital inflows into the region. Access to external financing coupled with better macroeconomic management, boosted growth and brought inflation down considerably. However, the processes of expansion and contraction on international financial markets led to volatility in international capital movements, which resulted in an unstable growth path. The paper discusses the composition and volatility of financial flows into Latin American and Caribbean countries. Indicators of external vulnerability and macroeconomic performance are also analysed.
The study also points out the role of multilateral banking in financing development in Latin American and Caribbean economies. Multilateral banking has played a significant role in support of public and private investments projects in the region, and by providing contra-cyclical financing when the private capital flows were volatile. To date, such banks have concentrated mainly on financing investment projects in different sectors. Indeed, in recent years, much emphasis has been placed on financing for the support of State and social sector management reforms.
In the near future multilateral banks should assume a leading role in improving access to private and public international resources. In this regard, the Andean Development Corporation (Corporación Andina de Fomento (CAF)), the Inter-American Development Bank (IDB) and the World Bank have already achieved positive results.
In particular, the development of instruments which will enable these institutions to mobilise financial resources for investment finance subject to collateral, guarantees, cofinancing arrangements, and, in general, any mechanism that can reduce the country risk of the economies in the region.
I.
Introduction
In the 1990s, the economic performance of the Latin American and Caribbean economies was highly dependent on capital inflows into the region. Access to external financing, coupled with better macroeconomic management, boosted growth and brought inflation down considerably. However, the processes of expansion and contraction on international financial markets led to volatility in international capital movements, which resulted in an unstable growth path.
Regional economic growth was determined by external financial flows, but access to financial sources varied widely from one country to the next. Thus, the benefits and challenges generated by international financial integration differ significantly depending on whether the countries concerned are among the more or less developed. Among the less developed, official financial flows, together with remittances from emigrants and foreign direct investment have been the major sources of current account financing. On the other hand, the more developed countries, have not only attracted a significant proportion of foreign direct investment, but also account for the highest levels of private debt and portfolio equity flows.
The external sources of financing available to countries in the region also influenced the characteristics of the external shocks that they had to confront during the 1990s. Thus, countries with greater access to private lending sources were faced with crises in which not only was the balance of payments current account an important factor, but in which the position of their capital account played a crucial role in the actual gestation and development of the crisis.
In particular, the fall in the supply of external financing, deterioration of the economy’s balance sheet and foreign exchange crisis occurred more or less simultaneously, in the short term. By contrast, the relatively less developed countries were subject mainly to problems arising from the trade balance of the balance of payments current account, so that crises and financing difficulties were determined rather by export and foreign exchange trends.
Multilateral Developing Banking (MDB), regional and sub-regional, has played an important role in providing external financing to the region. During the nineties, three fourth of net capital inflows to the countries of the region, with an income per capita below $US 2 000, was provided by MDB. This resources help to partially mitigate the negative effects of external shocks. For countries with a per capita income of $US 2 000 to 4 000 MDB’s flows represented 14% of net capital inflows. For richer countries, a per capita income above $US 4 000, MDB only represented 11% of total net flows. However, this financing has an important anti-cyclical component. Also, the financial conditions of MDB loans have been in better terms than private financing, with lower interest rates and longer maturities.
Multilateral banking has played a significant role in support of public and private investment projects in the region. In recent years, these resources have been channelled increasingly towards projects for reforming the social sectors and for State management. The dynamic of the international financial system, in particular with respect to the volatility of flows, suggests that multilateral banking must play a more active role by offering countries access to less expensive, more stable sources of international financing, preferably to medium and long term flows and for sectors that have traditionally been excluded, in particular small and medium-sized enterprises.
To this end, multilateral banking institutions need to devise instruments that by ways of reducing the risk ratings of the economies in the region, can help to attract funds. The mechanisms adopted by the CAF, the IDB and the World Bank through agencies and specialised programmes are examples of such instruments.
Apart from the fact that multilateral banks can act as catalysts in making funds available for investment, some claim that one of the concerns of multilateral financial institutions should be to provide emergency financing —currently centred in the International Monetary Fund— to relieve liquidity problems caused by the volatility of international financial markets. This ties in with the fact that liquidity crunches have serious repercussions on poverty levels, on the development of small and medium-sized enterprises and on unemployment levels, issues which multilateral institutions explicitly seek to address.
In what follows the composition and volatility of financial flows into the region, indicators of external vulnerability and macroeconomic performance are briefly considered. The role of the IDB, the CAF, the Latin American Reserve Fund and the World Bank is also examined in terms of their contribution to the region. Attention is also given to the role that they should play in the current international financial context.
II. Anatomy of capital flows
Financial integration of the economies in the region, as in other regions, has been accompanied by substantial changes in external financial flows. The ready availability of banking credit in the 1970s gave way to a serious financial squeeze in the 1980s. In the 1990s, access to external financing was strongly influenced by development towards the end of the 1980s, of stock markets in the emerging economies and the emergence of bond markets in the early 1990s, following the adoption of the Brady Plan, which gave a strong boost to the secondary bond market. In addition to this, Foreign Direct Investment (FDI) flows were strong, particularly in the second half of the decade.
As shown in table 1, FDI and bond issues were the main sources of financing in the 1990s. FDI expanded strongly in 1996 and 1999, accounting for three-quarters of net capital inflows and becoming one of the principal means of financing the current account deficit. In 2000, however, these flows contracted sharply (ECLAC, 2001a). In contrast to the other private financial flows, FDI proved relatively stable and even, in some cases, acted counter-cyclically at critical times (notably in Mexico, 1995 and Brazil, 1998).
Bond issues became increasingly important, interrupted only by the after-effects of the Mexican financial crisis in 1995 and the Asian crisis in 1997. Unlike FDI, these flows proved to be unsteady and financing conditions were highly sensitive to fluctuations on international markets. As a whole and contrary to claims that financial crises today are intense but short-lived, conditions on bond markets have not yet recovered, three years down the line, to their pre-Asian
crisis levels. (ECLAC, 2001a). During the first half of the 1990s, the average term for new issues in the region was between three and five years. In 1997, when bond sales were at their peak, it increased significantly, but declined again in the 1998-1999 biennium. Financial costs, which had fallen to their lowest levels in 1997, rallied strongly in August 1998 after the moratorium declared by Russia and, although the trend was downward, they remained above the levels that had prevailed before the Asian crisis (see figure 1).
Table 1
LATIN AMERICA AND THE CARIBBEAN: SOURCES OF EXTERNAL FINANCING
(Net flows in millions of $US)
1990 1991 1992 1993 1994 1995 1996 1997 1998 1999 2000a A. Debt Officialb 6 823 3 435 1 220 2 674 -1 301 9 307 -8 212 -4 447 9 125 2 275 -2 701 Bonds 101 4 133 4 738 20 922 14 306 11 793 29 764 10 562 18 306 19 067 10 965 Commercial banksc 2 731 1 275 4 302 201 6 212 15 068 16 200 29 646 -7 994 -16 130 4 339 B. Investment Direct 6 758 11 066 12 506 10 363 23 706 24 799 39 387 55 580 61 596 77 047 57 410 Equity 896 6 938 8 042 27 185 13 160 7 643 13 893 9 947 1 748 3 893 2 305 C. Grantsd 2 350 4 165 2 622 2 908 2 645 3 333 3 181 2 719 3 215 2 949 3 100 D. Equalization fundse 24 228 12 781 7 825 4 868 4 389 30 113 -1136 -4 038 8 885 5 881 -13 675
Source: Economic Commission for Latin America and the Caribbean (ECLAC), on the basis of official figures from the World Bank, the International Monetary Fund and the Bank for International Settlements.
a
Preliminary estimates.
b Including bilateral and multilateral financing, but not including IMF loans. c As of 1998, includes short-term flows.
d Not including technical cooperation. e
Including loans and use of IMF credit and exceptional financing. At the beginning of the 1990s, exceptional financing consisted mostly of overdue interest, but, in recent years, it has included funding from multilateral organisations other than the IMF, and from Governments of developed countries.
Figure 1
LATIN AMERICA AND THE CARIBBEAN: INTERNATIONAL BOND ISSUES
(Billions of $US) 0 3 6 9 12 15 18 21 I 1997 III I 1998 III I 1999 III I 2000 III I 2001 April
Figure 1 (continuation)
LATIN AMERICA AND THE CARIBBEAN: CONDITIONS GOVERNING INTERNATIONAL BOND ISSUES
Source: Economic Commission for Latin America and the Caribbean (ECLAC), on the basis of data from the International Monetary Fund, J.P. Morgan and Merrill Lynch.
Memo: Cost equals the sum of the average difference between bond issues and the return on long-term United States Treasury Bonds.
Net commercial banking flows into the region also rose to significant levels, but like bonds, proved to be highly volatile. They remained at moderate levels up to 1993, when they began to pick up, rising to a peak in 1997, only to fall again to negative values in 1998 and 1999. The financing conditions, especially the terms, have never been the same as before the debt crisis in the early 1980s. Portfolio equity flows, together with the issue of American depositary receipts (ADR) were the most unstable sources of financing.
Official and compensatory financing has, on the contrary, proven to be counter-cyclical, since it has increased at times when there have been drastic collapses in private investment, as in 1995 and 1998. This reflects the support provided by the International Monetary Fund, other multilateral organisations and some Governments of developed countries at critical times for different countries, notably, Mexico, at the end of 1994 and Brazil, in 1998 and early 1999. In recent years, bilateral inflows were negative for the region, as a result of the payment of debts incurred by Mexico with the United States in 1995. Multilateral sources were, thus, the principal official source of loan resources.
The exposure of different countries in the region to the effects of the volatility of external financing, varies significantly owing to their different degrees of access to such flows. Debt and investment flows from private sources have been concentrated essentially in the relatively more developed countries, which received around 90% of total debt flows and 85% of total investment flows (see table 2). This suggests that the perception being formed in international markets regarding economic development in the region is heavily influenced by what has occurred in a small group of countries.
8 9 10 11 12 13 14 I 1997 II III IV I 1998 II III IV I 1999 II III IV I 2000 II III IV I 2001 April % 0 3 6 9 12 15 18 Years
Table 2
NET PRIVATE CAPITAL INFLOWS, 1990-1999
(Annual averages in $US and percentages)
Foreign direct investment Portfolio equity flows Total private investment Memo (1999) (%)
Amount % Amount % Amount % GDPa
%
Latin America and the Caribbean 32 937 100 9 214 100 42 151 100 100 100
Low-income countriesb 1 845 5.6 8 0.1 1 853 4.4 5 14.4 Middle-income countriesc 3 844 11.7 902 9.8 4 746 11.3 10 15.4 High-income countriesd 27 248 82.7 8 304 90.1 35 552 84.3 85 70.2 Argentina 5 442 16.5 1 132 12.3 6 575 15.6 16 7.4 Brasil 9 909 30.1 2 785 30.2 12 694 30.1 30 34.2 Chile 1 937 5.9 288 3.1 2 226 5.3 4 3.0 México 8 179 24.8 3 750 40.7 11 929 28.3 27 19.7 Venezuela 1 676 5.1 311 3.4 1 986 4.7 6 4.8 Others 105 0.3 37 0.4 142 0.3 2 1.0
Bonds Commercial bank
loans and others
Total private debt Memo (1999)
(%)
Amount % Amount % Amount % GDPa
Population
Latin America and the Caribbean 13 647 100 10 691 100 24 337 100 100 100
Low-income countriesb 10 0.1 97 0.9 107 0.4 5.1 14.4 Middle-income countriesc 914 6.7 1 100 10.3 2 014 8.3 9.8 15.4 High-income countriesd 12 723 93.2 9 494 88.8 22 217 91.3 85.1 70.2 Argentina 4 871 35.7 578 5.4 5 448 22.4 16.2 7.4 Brazil 2 594 19.0 4 808 45.0 7 403 30.4 30.2 34.2 Chile 528 3.9 1 538 14.4 2 066 8.5 3.9 3.0 Mexico 4 202 30.8 2 317 21.7 6 519 26.8 27.4 19.7 Venezuela 353 2.6 -14 -0.1 340 1.4 5.9 4.8 Others 174 1.3 267 2.5 441 1.8 1.6 1.0
Source: Economic Commission for Latin America and the Caribbean (ECLAC), on the basis of official figures from the World Bank; Global Development Finance 2001; Latin American and Caribbean Demographic Centre-Population Division of ECLAC (Centro Latinoamericano de Demografía (CELADE)), and from national sources.
a Calculated on the basis of current values.
b The group of low-income countries includes the countries, where per capita Gross Domestic Product (GDP),
estimated at market exchange rates, was below $US 2 000 in 1998, and includes Bolivia, Dominican Republic, Ecuador, El Salvador, Guatemala, Guyana, Haiti, Honduras, Nicaragua and Paraguay.
c
The group of low-income countries is made up of those countries whose per capita GDP was between $US 2 000 and $US 4 000 in 1997 and which includes Colombia, Costa Rica, Jamaica, Panama and Peru.
d The group of high per capita income countries includes those countries whose per capita GDP was above
$US 4 000 in 1997, namely Argentina, Barbados, Brazil, Chile, Mexico, Trinidad and Tobago, Uruguay and Venezuela.
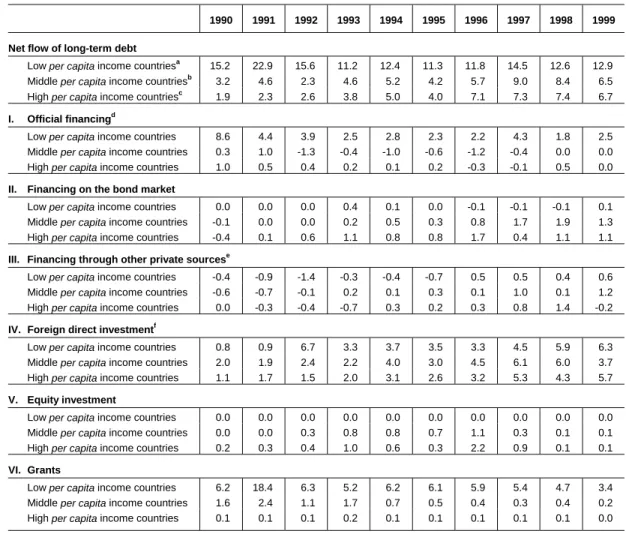
This concentration of flows is due to the different capacity of countries to adapt to the new international financial conditions. Measured in terms of their percentage of Gross Domestic Product (GDP), the relative importance of total net long-term flows increased in the high and middle per capita income countries, while it decreased in lower-income countries. In this last group, official financing and grants were cut back to less than half and this was not fully offset by increases in FDI, whose role in financing the current account of these countries still increased significantly to stand at 6% of GDP in 1999 (table 3).
Table 3
CONTRIBUTION OF LONG-TERM EXTERNAL FINANCING BY GROUPS OF COUNTRIES
(Percentages of GDP, simple averages)
1990 1991 1992 1993 1994 1995 1996 1997 1998 1999
Net flow of long-term debt
Low per capita income countriesa 15.2 22.9 15.6 11.2 12.4 11.3 11.8 14.5 12.6 12.9 Middle per capita income countriesb
3.2 4.6 2.3 4.6 5.2 4.2 5.7 9.0 8.4 6.5 High per capita income countriesc 1.9 2.3 2.6 3.8 5.0 4.0 7.1 7.3 7.4 6.7 I. Official financingd
Low per capita income countries 8.6 4.4 3.9 2.5 2.8 2.3 2.2 4.3 1.8 2.5 Middle per capita income countries 0.3 1.0 -1.3 -0.4 -1.0 -0.6 -1.2 -0.4 0.0 0.0 High per capita income countries 1.0 0.5 0.4 0.2 0.1 0.2 -0.3 -0.1 0.5 0.0 II. Financing on the bond market
Low per capita income countries 0.0 0.0 0.0 0.4 0.1 0.0 -0.1 -0.1 -0.1 0.1 Middle per capita income countries -0.1 0.0 0.0 0.2 0.5 0.3 0.8 1.7 1.9 1.3 High per capita income countries -0.4 0.1 0.6 1.1 0.8 0.8 1.7 0.4 1.1 1.1 III. Financing through other private sourcese
Low per capita income countries -0.4 -0.9 -1.4 -0.3 -0.4 -0.7 0.5 0.5 0.4 0.6 Middle per capita income countries -0.6 -0.7 -0.1 0.2 0.1 0.3 0.1 1.0 0.1 1.2 High per capita income countries 0.0 -0.3 -0.4 -0.7 0.3 0.2 0.3 0.8 1.4 -0.2 IV. Foreign direct investmentf
Low per capita income countries 0.8 0.9 6.7 3.3 3.7 3.5 3.3 4.5 5.9 6.3 Middle per capita income countries 2.0 1.9 2.4 2.2 4.0 3.0 4.5 6.1 6.0 3.7 High per capita income countries 1.1 1.7 1.5 2.0 3.1 2.6 3.2 5.3 4.3 5.7 V. Equity investment
Low per capita income countries 0.0 0.0 0.0 0.0 0.0 0.0 0.0 0.0 0.0 0.0 Middle per capita income countries 0.0 0.0 0.3 0.8 0.8 0.7 1.1 0.3 0.1 0.1 High per capita income countries 0.2 0.3 0.4 1.0 0.6 0.3 2.2 0.9 0.1 0.1 VI. Grants
Low per capita income countries 6.2 18.4 6.3 5.2 6.2 6.1 5.9 5.4 4.7 3.4 Middle per capita income countries 1.6 2.4 1.1 1.7 0.7 0.5 0.4 0.3 0.4 0.2 High per capita income countries 0.1 0.1 0.1 0.2 0.1 0.1 0.1 0.1 0.1 0.0
Source: The World Bank, Global Development Finance, Washington, 2001.
a The group of low-income countries includes those countries where per capita GDP, estimated at market
exchange rates, was less than $US 2 000 in 1998 and includes Bolivia, Dominican Republic, Ecuador, El Salvador, Guatemala, Guyana, Haiti, Honduras, Nicaragua and Paraguay.
b
The group of middle-income countries consists of those countries whose per capita GDP was between $US 2 000 and $US 4 000 in 1997 and which include Colombia, Costa Rica, Jamaica, Panama and Peru.
c The group of high income countries includes those countries whose per capita GDP was above $US 4 000 in
1997, namely Argentina, Barbados, Brazil, Chile, Mexico, Trinidad and Tobago, Uruguay and Venezuela.
d Official financing includes loans from bilateral and multilateral sources. e
Includes loans from commercial banks and other private creditors.
f
This refers to Foreign Direct Investment (FDI) inflows without deduction of the investments of the reporting economy abroad.
As can be seen in table 4, for lower income countries, migrant worker remittances have become a major source of resources. In countries such as El Salvador and the Dominican Republic, remittances were substantial throughout the decade of the 1990s. Remittances to Ecuador, Jamaica, Honduras and Nicaragua grew in the second half of the decade to account for between 6% and 13% of GDP, depending on the country.
Table 4
LATIN AMERICA AND THE CARIBBEAN: WORKERS’ REMITTANCES
(Percentages of GDP)
1990 1991 1992 1993 1994 1995 1996 1997 1998 1999
Total (simple average) 1.3 1.6 1.6 1.9 2.4 2.4 2.4 2.6 2.9 3.7
Argentina … … -0.1 0.0 0.0 -0.1 -0.1 -0.1 -0.1 -0.1 Barbados 1.2 1.2 1.6 1.6 1.7 1.6 1.7 2.0 2.1 … Bolivia 0.0 0.0 0.0 0.0 0.0 0.0 0.0 0.8 0.6 0.5 Brazil 0.1 0.3 0.4 0.2 0.3 0.4 0.2 0.1 0.1 0.2 Colombia 1.0 1.8 1.2 0.8 1.0 0.6 0.5 0.5 0.4 0.6 Costa Rica … … … 0.8 0.7 0.5 0.3 0.1 Ecuador 0.5 0.5 0.5 0.5 0.6 0.9 1.5 2.1 4.0 7.9 El Salvador 6.7 8.8 11.5 11.4 11.9 11.2 10.5 10.8 11.2 11.1 Guatemala 1.3 1.3 1.7 1.7 2.0 2.4 2.3 2.2 2.2 2.4 Honduras 1.6 1.7 1.8 1.7 2.5 3.0 3.1 3.4 4.2 5.9 Jamaica 3.1 3.5 4.5 4.2 10.1 10.4 9.8 8.5 8.4 8.4 Mexico 0.9 0.8 0.8 0.8 0.8 1.3 1.3 1.2 1.3 1.2 Nicaragua … … 0.5 1.3 2.7 4.0 4.8 7.4 9.4 13.2 Panama -0.1 0.0 -0.1 -0.1 -0.1 -0.1 -0.1 -0.1 -0.1 -0.1 Paraguay … … … 1.5 1.4 1.5 1.7 1.9 Peru 0.3 0.4 0.7 0.8 1.1 1.1 1.1 1.1 1.1 1.4 Dominican Republic 4.5 4.3 3.9 7.5 7.2 6.7 6.9 7.2 8.4 8.7
Trinidad and Tobago 0.1 0.1 0.1 0.4 0.5 0.6 0.5 0.5 0.8 …
Venezuela -1.4 -1.3 -1.4 -1.2 -1.0 -0.2 -0.4 -0.2 -0.2 -0.2
Source: Economic Commission for Latin America and the Caribbean (ECLAC), on the basis of official data from the International Monetary Fund (IMF), Balance of Payment Statistics, March 2001 and from national sources.
III. Vulnerability
In the 1990s, a series of external shocks in both the real and the financial sectors simultaneously affected the rate and sustainability of economic growth in the region. As shown below, this led to a growth path closely linked to the fluctuations in the global economy in particular to the international financial dynamic. Clearly, the dissimilar effects of changes in the international context on the different economies in the region reflect the heterogeneity of the imbalances and internal problems that these had to contend with throughout the 1990s.
At the financial level, factors of vulnerability were based both on the actual state of the economies themselves and on the phenomena of contagion and “herd” behaviour among international investors. The changes in sovereign risk in the 1990s were a good example of this behaviour.
The growing importance of bond markets —as a source of financing for some countries in the region— meant that sovereign risk became an important indicator of the perceived vulnerability of an economy. Insofar as the external public debt bonds are issued in dollars, the country risk premium basically reflects the probability of non-fulfilment of these commitments. This premium is measured as the difference between the cost of: (a) issuing bonds in dollars for the Governments of emerging economies, and (b) issuing similar bonds in dollars for the Government of the United States.
Variations in the country risk premium for countries in the region show that, after the Asian crisis, this premium bore little relationship to the fiscal solvency of countries but rather that it was a reflection of the perception among international agents of those countries’
access to international liquidity to enable them to honour their obligations. figure 2 shows that while the level of the premium reflects the particular state of the different economies, their dynamic proved very similar in different regions reflecting problems of contagion and “herd” behaviour. A comparison of the sovereign risk of countries in the region will reveal the same tendency. The Asian crisis in 1997 and the Russian moratorium in 1998 both resulted in an increase in country risk premium for all countries. Clearly, the amount of the increase is not the same, reflecting the special conditions prevailing in the different countries.
Figure 2
EUROBOND DIFFERENTIALS (1997-2000)
(Base points at month-end, over returns on United States Treasury Bonds)
EMERGING MARKETS BOND INDEX GLOBAL (EMBIG), (1995-2001)
Source: J. P. Morgan.
Memo: The Emerging Markets Bond Index Global (EMBIG), tracks total returns for US Dollar denominated debt instruments issued by emerging market sovereign and quasi-sovereign entities: Brady bonds, loans, Eurobonds, and local market instruments. Countries covered are Algeria, Argentina, Brazil, Bulgaria, Chile, China, Colombia, Cote d’Ivoire, Croatia, Ecuador, Greece, Hungary, Lebanon, Malaysia, Morocco, Mexico, Nigeria, Panama, Peru, the Philippines, Poland, Russia, South Africa, South Korea, Thailand, Turkey and Venezuela.
1995 1996 1997 1998 1999 2000 2001 0 2 0 4 0 6 0 8 0 1 0 0 1 2 0 1 4 0 1 6 0 1 8 0 2 0 0 2 2 0 2 4 0 2 6 0 2 8 0
JAN APR JUL OCT JAN APR JUL OCT JAN APR JUL OCT JAN APR JUL OCT JAN APR JUL OCT JAN APR JUL OCT JAN APR JUL
Total Return Mid
L a t i n A m e r i c a E u r o p e A f r i c a A s i a 0 1 0 0 2 0 0 3 0 0 4 0 0 5 0 0 6 0 0 7 0 0 8 0 0 9 0 0 1 0 0 0 1 1 0 0 1 2 0 0
SEP DIC MAR JUN SEP DEC MAR JUN SEP DEC MAR JUN SEP DEC MAR
Base points at month-end
A rg e n tin a B ra z il M e x ic o C o lo m b ia C h ile
The main national factors that account for the differences in risk perception among international investors regarding a country are political risk, foreign-exchange risk, the strength of fiscal accounts, the size of the current account deficit, the soundness and capitalisation of national financial and banking systems, in particular, their capacity to withstand fluctuations in interest rates and exchange rates and their capacity to honour their acquired payment obligations, especially their debt servicing obligations.
The crises observed in the second half of the 1990s suggest that the vulnerability of economies depends, among other factors, on the maturity and currency mismatches existing in the financial structure of firms, financial institutions and the public sector, as well as on the variation in the real exchange rate and the current account. The extent and characteristics of crises is determined by the way these variables interact with each other. Practically all countries that suffer financial crises had, to a greater or lesser degree, problems of liquidity due to excessively high short-term debt and/or large current account deficits. (Mexico 1995, Indonesia, Korea and Thailand 1997, Russia 1998, Brazil 1999).
In this context, there is growing concern over the variations in indicators relating to short-term liquidity requirements (measured as the ratio of short-short-term debt to total debt) and to the backing that countries have for meeting these obligations (measured as the ratio of short-term debt to international reserves).
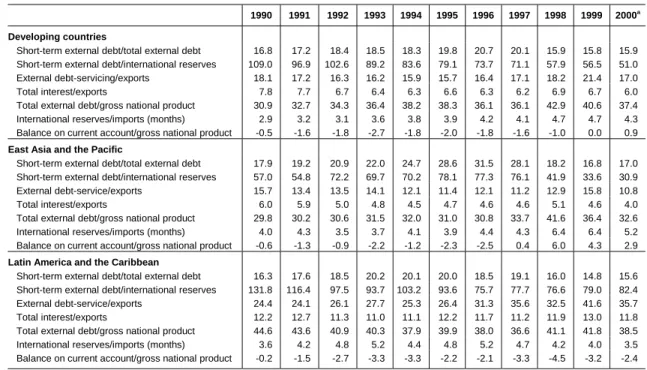
Since 1995, the ratio of short-term debt to total debt has declined significantly in countries of the region. Since that year, the short-term debt has on average been backed by international reserves to the extent that cumulative reserves have exceeded short-term debt levels. The pattern followed by these indicators in the region is similar to that observed among developing countries in other regions (see table 5). In practically all the emerging economies, there has been on average a fall in short-term debt and an improvement in the ratio of short-term external debt to reserves.
Table 5
INDICATORS OF EXTERNAL VULNERABILITY OF DEVELOPING COUNTRIES
(Percentages)
1990 1991 1992 1993 1994 1995 1996 1997 1998 1999 2000a
Developing countries
Short-term external debt/total external debt 16.8 17.2 18.4 18.5 18.3 19.8 20.7 20.1 15.9 15.8 15.9
Short-term external debt/international reserves 109.0 96.9 102.6 89.2 83.6 79.1 73.7 71.1 57.9 56.5 51.0
External debt-servicing/exports 18.1 17.2 16.3 16.2 15.9 15.7 16.4 17.1 18.2 21.4 17.0
Total interest/exports 7.8 7.7 6.7 6.4 6.3 6.6 6.3 6.2 6.9 6.7 6.0
Total external debt/gross national product 30.9 32.7 34.3 36.4 38.2 38.3 36.1 36.1 42.9 40.6 37.4
International reserves/imports (months) 2.9 3.2 3.1 3.6 3.8 3.9 4.2 4.1 4.7 4.7 4.3
Balance on current account/gross national product -0.5 -1.6 -1.8 -2.7 -1.8 -2.0 -1.8 -1.6 -1.0 0.0 0.9
East Asia and the Pacific
Short-term external debt/total external debt 17.9 19.2 20.9 22.0 24.7 28.6 31.5 28.1 18.2 16.8 17.0
Short-term external debt/international reserves 57.0 54.8 72.2 69.7 70.2 78.1 77.3 76.1 41.9 33.6 30.9
External debt-service/exports 15.7 13.4 13.5 14.1 12.1 11.4 12.1 11.2 12.9 15.8 10.8
Total interest/exports 6.0 5.9 5.0 4.8 4.5 4.7 4.6 4.6 5.1 4.6 4.0
Total external debt/gross national product 29.8 30.2 30.6 31.5 32.0 31.0 30.8 33.7 41.6 36.4 32.6
International reserves/imports (months) 4.0 4.3 3.5 3.7 4.1 3.9 4.4 4.3 6.4 6.4 5.2
Balance on current account/gross national product -0.6 -1.3 -0.9 -2.2 -1.2 -2.3 -2.5 0.4 6.0 4.3 2.9
Latin America and the Caribbean
Short-term external debt/total external debt 16.3 17.6 18.5 20.2 20.1 20.0 18.5 19.1 16.0 14.8 15.6
Short-term external debt/international reserves 131.8 116.4 97.5 93.7 103.2 93.6 75.7 77.7 76.6 79.0 82.4
External debt-service/exports 24.4 24.1 26.1 27.7 25.3 26.4 31.3 35.6 32.5 41.6 35.7
Total interest/exports 12.2 12.7 11.3 11.0 11.1 12.2 11.7 11.2 11.9 13.0 11.8
Total external debt/gross national product 44.6 43.6 40.9 40.3 37.9 39.9 38.0 36.6 41.1 41.8 38.5
International reserves/imports (months) 3.6 4.2 4.8 5.2 4.4 4.8 5.2 4.7 4.2 4.0 3.5
Balance on current account/gross national product -0.2 -1.5 -2.7 -3.3 -3.3 -2.2 -2.1 -3.3 -4.5 -3.2 -2.4
Source: World Bank, “Global Development Finance”, Washington, 2001.
Another factor of vulnerability arises from the fact that external debt service and profit remittances now absorb a substantial amount of gross capital inflows in some countries of the region thus becoming a major drain on liquidity. The composition of the current account deficit shows the increasing importance of these variables, in particular, in the case of middle and high-income countries. Nevertheless, for low-high-income countries, the trade deficit was, and continues to be, an important factor in the composition of the deficit. For the average of the region, the current account deficit during the 1990s reached close to 2.6% of GDP while the trade deficit was 1% of GDP (tables 6 and 7). Thus, as from 1998, vulnerability increased as a result of the decline in the external debt over GDP compared with the preceding years. The same applies to the ratio of external debt to exports, which shows a significant increase as from 1995. The external deficit, in terms of the current account deficit, increased in the second half of the 1990s (table 5).
Table 6
LATIN AMERICA AND THE CARIBBEAN: BALANCE OF PAYMENTS BY GROUPS OF COUNTRIES (1990-2000)
(Annual average as percentage of gross domestic product)
1990-2000 1990-1994 1995-1997 1998-2000a Balance on current account -2.6 -2.2 -2.6 -3.4
Low-income countries b -8.4 -9.6 -7.6 -7.1 Middle-income countries c -4.2 -2.9 -4.9 -5.7 High-income countries d -1.4 -1.1 -1.0 -2.2 Trade balance -0.9 -0.4 -1.0 -1.6 Low-income countries -10.3 -8.7 -10.4 -12.9 Middle-income countries -2.0 -1.2 -3.3 -2.2 High-income countries 0.7 1.2 1.0 -0.3
Balance on financial account 2.9 2.6 3.3 3.2
Low-income countries 2.6 -1.2 4.3 7.3
Middle-income countries 2.5 -0.2 5.5 4.0
High-income countries 2.5 2.5 2.6 2.4
Source: Economic Commission for Latin America and the Caribbean (ECLAC), on the basis of official data.
a Preliminary data.
b The group of low-income countries includes those countries, whose per capita GDP, estimated at
market exchange rates, was less than $US 2 000, in 1998, namely, Bolivia, Dominican Republic, Ecuador, El Salvador, Guatemala, Guyana, Haiti, Honduras, Nicaragua and Paraguay.
c
The group of middle-income countries includes those countries whose per capita GDP was between $US 2 000 and $US 4 000 in 1997 and is made up of Colombia, Costa Rica, Jamaica, Panama and Peru.
d The group of high per capita income countries includes those countries whose per capita GDP was
above $US 4 000 in 1997, namely Argentina, Barbados, Brazil, Chile, Mexico, Trinidad and Tobago, Uruguay and Venezuela.
IV. Performance and
macroeconomic policy
The consolidation of fiscal accounts and the fall in inflation rates were two of the main macroeconomic advances observed in the 1990s. In terms of fiscal adjustment, the deficit was maintained, on average, at around 1.6% of GDP for most of the decade, although the situation worsened during the recent crisis, when serious fiscal problems surfaced in some countries and the deficit widened in 1998-2000 to 2.6% of GDP (see table 7). The maintenance of moderate levels of fiscal deficit was consistent, however, with an upturn in public expenditure, thanks to an increase in fiscal revenue. On average, public expenditure showed an increase of just over four percentage points in relation to GDP; this was reflected basically in higher social spending, which moved from 10.1% of GDP in 1990 to 12.4% in 1997 (ECLAC, 2000).
Discipline in fiscal accounts was accompanied by tight monetary control and this was reflected in a significant increase in real interest rates. The reduction in inflation in most countries, however, meant that this control was consistent with a significant increase in the money stock and an expansion in domestic credit in real terms. Interest rates started to rise in the mid-1980s and remained positive in the 1990s. (table 7, ECLAC 2001a).
Table 7
LATIN AMERICA AND THE CARIBBEAN: CHANGES IN SOME MACROECONOMIC VARIABLES 1990-2000
(Annual averages and percentages)
1990-2000 1990-1994 1995-1997 1998-2000a
GDP growthb 3.2 3.8 4.4 2.2
Rate of inflation c 281.4 602.3 18.1 9.7
Net capital inflows (% of GDP)d 2.8 2.4 3.2 3.0
Fiscal deficit (as % of GDP)e -1.6 -1.2 -1.4 -2.6
Investment rate (% of GDP) 20.7 20.3 21.3 20.6
Balance on current account (% of GDP) -2.6 -2.2 -2.6 -3.4
Trade balance (% of GDP) -0.9 -0.4 -1.0 -1.6
Real deposit interest rate f 3.4 g 4.2 1.4 4.9
M2/GDPh 26.2 23.6 27.5 29.3
Domestic borrowing/GDP 33.1 32.5 31.8 35.6
Source: Economic Commission for Latin America and the Caribbean (ECLAC), on the basis of official data from the International Monetary Fund (IMF), International Financial Statistics, May 2001 and national sources.
a Preliminary data for 2000.
b Figures based on values at 1995 prices. c
December-December variation.
d
Corresponds to net autonomous capital inflows (including Errors and omissions).
e
Central government coverage. Simple averages.
f Simple average from 1993-2000. g Simple average from 1993-1994.
h M2 refers to money in circulation, plus deposits in current accounts of the private non-financial sector,
minus transfers, plus demand deposits as distinct from current accounts, plus demand savings deposits, plus private-sector term deposits.
Investment picked up following the sharp contraction in the 1980s. As from 1990, the return on international capital to the region facilitated a recovery in the rate of capital accumulation, but this was not the case throughout the region, since in most countries, the increase in investment was achieved through greater external financing without any corresponding expansion in national saving or in access by investors, especially small and medium-sized investors, to domestic or external long-term financing. Investment levels in Latin America remained lower than the levels prior to the debt crisis. This decline in the rate of investment was more significant in the larger countries —which were more exposed to private capital flows— as revealed by the variation in the investment ratio for Latin America, which shows a less favourable recovery if based on the weighted average (by level of GDP) than when based on a simple average of countries (see figure 3, ECLAC 2001a).
Capital inflows generated a tendency towards a real appreciation in national currencies, which lasted until 1998 (see figure 4).1 In the long run, this proved to be the “Achilles Heel” of stabilisation strategies, when capital flows decreased. The exchange-rate lag accentuated the dependence on the availability of external financial resources and replaced inflation risk by the risk of an external liquidity crisis. Stricter control of fiscal accounts and monetary prudence were not sufficient to prevent it (ECLAC, 2001a).
Figure 3
LATIN AMERICA: BASIC MACROECONOMIC INDICATORS (1980-1999)
(Percentage of GDP, weighted average)
(Percentage of GDP, simple average)
Source: Economic Commission for Latin America and the Caribbean (ECLAC), on the basis of official data. 0.14 0.15 0.16 0.17 0.18 0.19 0.2 0.21 0.22 0.23 0.24 1980 1981 1982 1983 1984 1985 1986 1987 1988 1989 1990 1991 1992 1993 1994 1995 1996 1997 1998 1999
National saving External saving 0.15 0.16 0.17 0.18 0.19 0.2 0.21 0.22 0.23 0.24 0.25 0.26 1980 1981 1982 1983 1984 1985 1986 1987 1988 1989 1990 1991 1992 1993 1994 1995 1996 1997 1998 1999
Figure 4
LATIN AMERICA AND THE CARIBBEAN: INDEXES OF REAL EFFECTIVE EXCHANGE RATES FOR IMPORTS
(Index 1995=100, based on CPI)
Source: Economic Commission for Latin America and the Caribbean (ECLAC), on the basis of data from the International Monetary Fund (IMF).
Memo: Refers to the average real (principal official) import-weighted exchange rates for the currency of each country against the currencies of its main trading partners. The weightings are the averages for the period 1994-1998.
Exchange-rate upheavals at the end of the decade accelerated the trend towards greater exchange rate flexibility, which with some exceptions prevailed in the region in the 1990s. Several countries decided to adopt flexible foreign exchange systems, generally a floating system with some degree of central bank intervention (dirty float), which in several cases replaced the controlled flexibility system (exchange-rate bands) adopted previously.2 In this way, as shown in table 8, the floating-rate system became the most common foreign exchange system in the region.
Table 8
LATIN AMERICA AND THE CARIBBEAN: FOREIGN EXCHANGE REGIMES, 2000
Fixed, semi-fixed or dollarized Controlled slide or floating band Floatinga
Argentina Bolivia Brazil
Ecuador Costa Rica Chile
El Salvador Nicaragua Colombia
Panama Dominican Republic Guatemala
Eastern Caribbean States Uruguay Guyana
Belize Venezuela Haiti
Jamaica Mexico Paraguay Peru
Trinidad and Tobago
Source: Economic Commission for Latin America and the Caribbean (ECLAC), “A Decade of Light and Shadow: Latin America and the Caribbean in the 1990s”, Bogota, 2001.
a Floating-rate systems usually imply a certain degree of intervention by the Central Bank (dirty float).
2 86 88 90 92 94 96 98 100 102 104 106 108 110 1990 1991 1992 1993 1994 1995 1996 1997 1998 1999 2000 b
The revival of capital inflows contributed to an upturn in production. On average, the rate of economic growth in the region rose from 1.0% per year in the 1980s to 3.0% in the 1990s. This advance, although satisfactory, did not enable the region to retrieve its pre-crisis growth level: 5.5% per year in 1945-1980. This pattern of relatively lower growth compared with the three and half decades prior to the debt crisis could be seen in most of the countries in the region (ECLAC 2001a).
Growth, moreover, was unstable and highly dependent on external financing (ECLAC, 2001a). As shown in figure 5, the main determining factor of the variations in the economic growth rate throughout the 1990s was the fluctuation in capital flows. The expansion in external financing coincided with a marked acceleration in productive activity in 1991-1994 and again in 1996-1997, but these growth phases were followed by periods of adjustment in 1995 and 1998-1999.
Figure 5
GDP GROWTH AND NET TRANSFER OF RESOURCES
(Index 1995 = 100, based on CPI and % of GDP)
Source: Economic Commission for Latin America and the Caribbean (ECLAC), on the basis of data provided by the International Monetary Fund (IMF) and national entities.
Memo: Net transfer of resources equals net capital inflows (including non-autonomous inflows, and errors and omissions), less the balance in the income account (profits and net interest).
Financial integration has meant that the number of instruments for managing external shocks has been restricted. In the 1990s, macroeconomic management in most countries was pro-cyclical, which in a number of cases, accentuated rather than moderated the effects of variations in international financing on the economic cycle. In particular, boom periods in such financing and the subsequent expansion in domestic credit in the countries, were reflected in higher —especially private— expenditure, which, together with exchange-rate appreciation, was reflected in cyclical deteriorations in the balance-of-payment current account. This situation made these countries extremely susceptible to any reversal of expectations. Both the current account and the price of assets had to be adjusted significantly when the international financial trend was inverted (ECLAC, 2001a). -1 0 1 2 3 4 5 6 1990 1991 1992 1993 1994 1995 1996 1997 1998 1999 2000 Index 1995 = 100 -2.0 -1.5 -1.0 -0.5 0.0 0.5 1.0 1.5 2.0 2.5 % of GDP
The intensity of the adjustment in countries depended not only on the size of the imbalances accumulated in boom periods, but also on the way in which these occurred. In several cases, in a context of weak regulatory frameworks and prudential supervision, balance-of-payments adjustments coincided with a loss in solvency of domestic financial institutions generating full national financial crises.
V. The role of multilateral
development agencies
As can be seen from the above, the financial integration of Latin American countries in the 1990s was marked by highly volatile capital flows, a major change in financial flows and a widely uneven pattern of access to external resources among countries in the region. Financial volatility had a major impact on the poor performance observed during the decade in terms of economic growth and poverty alleviation.
To the extent that financial volatility is based both on factors peculiar to countries and on exogenous elements, in particular problems of contagion and “herd” behaviour, the role of both the regional financial institutions and those of the Bretton Woods system must be redesigned, especially as far as multilateral development banking is concerned. These institutions, in a context of development financing must promote better access to international capital markets, support channelling of these resources towards productive and investment sectors and, where necessary, act as liquidity generators in a role of lender of last resort.
In this system, multilateral banking must be capable, on the one hand, of providing and facilitating access to financial resources that support activities that yield high social returns and which the private-sector is not prepared to finance. On the other, it must play a counter-cyclical role which allows access to financial resources at times when international private capital becomes scarce.
In countries with limited access to private markets, multilateral banking must maintain its traditional role as lender and provide institutional support. In this regard, it must continue to act as a preferential creditor over the private-sector in both concessionary and non-concessionary loans.
In countries that show greater access to private capital markets, the multilateral banking system must promote, on the one hand, broader private external financing (in terms of terms and currencies) and on the other, more stable access and at lower cost. To expand the market, it must generate initiatives and offer incentives that help to develop long term private markets in local currency and, in general, support financial innovations to facilitate the emergence of new financial instruments. In order to improve stability of access, it must be capable of supporting countries in case of liquidity problems, generate co-financing mechanisms with the private-sector, support emergency financing programmes, in particular, social safety nets and, in cases of insolvency, support and coordinate negotiations between official financing agencies, countries and the private-sector.
The role of multilateral development banks is not limited only to the financial field. These institutions must support countries through national and regional technical cooperation, promotion of dialogue, support for regional integration processes and for countries in their participation in global forums.
A.
The Andean Development Corporation (Corporación Andina
de Fomento (CAF))
In the Latin American context, the CAF has become one of the main multilateral banks in the Andean subregion. The Corporation is an international financial institution whose mission is to support the sustainable development of its shareholder countries and regional integration. Its principal members are the five countries of the Andean region: Bolivia, Colombia, Ecuador, Peru and Venezuela; in addition, its shareholders include the following countries: Brazil, Chile, Jamaica, Mexico, Panama, Paraguay, and Trinidad and Tobago.
Currently, the CAF grants loans and extends lines of credit to corporations, financial entities, and the public and private banking system, for financing external trade and working capital operations. In addition, it places at the disposal of the financial sector, overall loans and lines of credit for channelling resources towards various productive sectors, in particular, small and medium-sized enterprises. It offers development banking services to Governments and their agencies for financing priority projects mainly in physical infrastructure and integration sectors. It offers investment bank services, such as equity participation, procurement and guarantee for the issue of titles, project structuring and financing with limited guarantees (limited recourse lending, co-financing, syndicated loans, financial guarantees and others). It also provides financing for projects designed to promote human development and the integration of marginated groups (such as indigenous peoples).
In recent years, the Corporation has become the main source of multilateral financing for the Andean countries. Of a total of $US 27 billion approved for these countries by the IDB, World Bank, and CAF, in the five-year period 1995-2000, it provided 51% of the funds (see table 9).
The Andean countries have been the main recipients of funding from CAF, having received, on average, between 90% and 95% of approved loans. From 1995, on the one hand, the public sector of countries has been the recipient of a growing percentage of loans and, on the other, the proportion of medium and long term loans has increased sharply compared with short-term loans.
The former are geared basically towards financing the execution of investment projects and social projects, while the latter are for financing foreign trade operations and the working capital of firms (table 10).
Table 9
LOAN APPROVALS TO THE ANDEAN COUNTRIES, BY THE ANDEAN DEVELOPMENT CORPORATION (CORPORACIÓN ANDINA DE FOMENTO (CAF)), THE INTER AMERICAN DEVELOPMENT BANK (IDB), AND THE WORLD BANK (1995-2000)
(Millions of $US and percentages)
Cummulative 1995-2000 2000
CAF 13 447 50.6 2 276 51.4
IDB 8 014 30.1 925 20.9
World Bank 5 140 19.3 1 227 27.7
Total 26 601 100 4 428 100
Source: Annual reports of the CAF, the IDB and the World Bank.
Memo: Loan approvals do not necessarily add up to the amounts disbursed in a given year. The Andean countries are: Bolivia; Colombia; Ecuador; Peru, and Venezuela.
Table 10
ANDEAN DEVELOPMENT CORPORATION (CORPORACIÓN ANDINA DE FOMENTO (CAF)): APPROVAL OF OPERATIONS BY COUNTRY,OPERATING TERMS AND INSTITUTIONAL SECTOR
(Millions of $US) 1991 1992 1993 1994 1995 1996 1997 1998 1999 2000 Total countries 1 299.6 1 772.9 2 096.4 2 159.5 2 257.7 2 313.9 2 900.1 2 672.8 2 180.7 2 363.4 Bolivia 66.4 121.9 183.0 285.1 296.3 223.2 353.4 227.0 247.6 382.8 Colombia 197.1 304.9 628.9 410.7 478.7 361.9 225.7 330.6 735.8 773.2 Ecuador 180.1 232.8 251.7 426.3 416.3 541.0 628.0 384.1 267.5 398.0 Peru 536.6 520.5 451.0 725.0 597.8 301.3 530.2 953.1 630.1 451.0 Venezuela 220.6 417.7 397.2 247.5 448.7 679.4 588.4 564.5 160.8 271.4
Other shareholder countries
and regional operationsa
98.8 175.1 184.6 64.9 19.9 207.1 574.4 213.5 138.9 87.0
Total operational modalities 1 299.6 1 772.9 2 096.4 2 159.5 2 257.7 2 313.9 2 900.1 2 672.8 2 180.7 2 363.4
Long-term loans 313.7 401.1 498.7 995.6 1 202.0 1 284.7 1 627.9 1 045.6 988.1 1 539.7 Medium-term loans 7.7 125.8 182.1 311.2 215.7 267.0 1 045.0 660.8 476.3 402.3 Short-term loans 976.2 1 242.1 1 369.5 793.9 816.8 718.7 204.0 910.4 656.0 405.2 Other modalitiesb 2.0 3.9 46.1 58.8 23.2 43.5 23.2 56.0 60.3 16.2 Total sectors 1 299.6 1 772.9 2 096.4 2 159.5 2 257.7 2 313.9 2 900.1 2 672.8 2 180.7 2 363.4 Institutional sector Public sector 71.7 803.3 822.4 863.4 885.7 864.2 1 213.3 967.6 1 268.7 1 750.3
Private and semi-public sector 1 227.9 969.6 1274.0 1 296.1 1372.0 1 449.7 1 686.8 1 705.2 912.0 613.1
Source: Annual Reports of the Andean Development Corporation (Corporación Andina de Fomento (CAF)).
Memo: The loans approved are not necessarily fully disbursed in the year when approved, so that the amounts approved and disbursed are not generally the same for any given year.
a
These projects are generally designed to promote the physical integration of the Andean countries with neighbouring countries and also include operations with shareholder countries (Argentina, Brazil, Chile, Jamaica, Mexico, Panama, Paraguay, Trinidad and Tobago) and multinational operations (such as the approval of an equity participation for the creation of a Latin American investment guarantee corporation in 2000).
Since one of the main problems of the countries in the region is precisely the scarcity of medium and long-term funding for investment financing, the trend shown by CAF demonstrates how multilateral banks can play an major role in providing this type of financing, in particular to countries with limited access to private loan markets.
From a sectoral perspective, loans granted have been concentrated in the financial sector, transport and communications, manufacturing and, to a lesser extent, in agriculture (table 11).
Table 11
LOAN APPROVALS BY THE ANDEAN DEVELOPMENT CORPORATION (CORPORACIÓN ANDINA DE FOMENTO (CAF)), FOR PROJECTS AND PROGRAMMES, BY ECONOMIC SECTOR
(Millions of $US)
1991 1992 1993 1994 1995 1996 1997 1998 1999 2000
Agriculture, hunting and forestry - - - 80.4 74.3 17.1 21.5 62.4 52.5 58.1 Mining and quarrying, oil and
natural gas production
24.8 124.1 25.6 30.0 45.0 151.0 246.0 - - 195.0 Manufacturing 37.6 77.0 89.6 11.1 42.5 - 122.1 23.6 76.7 60.1 Electricity, gas and water supply 16.8 85.0 110.0 22.0 370.3 367.3 412.8 200.0 192.5 179.9 Transport, storage and
communications
29.8 95.0 139.5 415.5 316.0 275.4 472.4 940.5 402.0 340.3
Wholesale and retail trade - - - 2.5 - - -
-Public administration - - - 25.0 - 55.0 33.0 455.0
Hotels and restaurants 6.7 - - 35.6 21.2 2.0 3.0 2.0 19.9 22.9 Financial intermediation 198.0 20.0 134.0 319.0 220.0 405.0 261.5 130.5 345.0 331.2 Other community, social and
personal services
- - - 72.0 - 45.0 116.4 70.5 253.0 144.8
Education - - - 25.0 0.3 - 26.0 168.7
Totala 313.7 401.1 498.7 988.1 1 089.3 1 312.8 1 656.0 1 484.5 1 400.6 1 956.0
Source: Annual reports of the CAF.
Memo: The loans approved are not necessarily fully disbursed in the year when approved, so that the amounts approved and disbursed are not generally the same for any given year.
a
These totals relate to approved projects and programmes; total approved operations include these plus total corporate loans and international trade operations, total technical cooperation and Human Development Fund operations and total equity participation.
As pointed out, access by the different countries in the region to private global capital flows is highly uneven. This heterogeneity reflects the internal development of financial markets and the different levels of country risk assigned to their economies. In this context, multilateral banking will undoubtedly have a crucial role to play in the intermediation of financial funds from international markets towards the countries in the region.
As shown in figure 6, CAF has a much higher investment grade than its member countries. The Corporation is thus in a position to intermediate private financial funds from the international financial system towards its member countries. The chance to shelter behind this institution’s investment grade is expected to facilitate access by several of the relatively less developed countries to financing, while significantly reducing the cost of these resources.
Figure 6
THE ROLE OF THE ANDEAN DEVELOPMENT CORPORATION (CORPORACIÓN ANDINA DE FOMENTO (CAF)) AS FINANCIAL INTERMEDIARY
Source: Based on a presentation by Enrique García, Executive President of Corporación Andina de Fomento (CAF), at the Seminar on Development Banking, Santiago, Chile, 2001.
B.
The Caribbean Development Bank (CDB)
The Caribbean Development Bank is a regional financial institution established in Jamaica in 1969. The Bank was established for the purpose of contributing to the harmonious economic growth and development of the member countries in the Caribbean and promoting economic cooperation and integration among them, having special and urgent regard to the needs of the Less Developed Countries (LDCs) of the region. For this purpose, CDB has used the CARICOM definition of LDCs which comprises the following countries: Anguilla, Antigua y Barbuda, Belize, Dominica, Grenada, Montserrat, St. Kitts and Nevis, St. Lucia, St. Vincent and the Grenadines. To these are added the United Kingdom Overseas Territories of the British Virgin Islands, the Cayman Islands and the Turks and Caicos Islands. Adding The Bahamas, Barbados, Guyana, Jamaica and Trinidad and Tobago, these are the Borrowing Member Countries.
During 30 years of operation, CDB’s net financing approvals amounted to $US 1.9 billion, of which $US 1 billion, or 52.4%, was for the LDCs (table 12). A major objective of CDB —that having special regard to the needs of the LDCs— is therefore being met.
During 2000, from the total resources available 70.2% ($US 865.6 millions) was mobilised from sources outside the region, $US 169 millions (13.7%) was mobilised from regional member countries and $US 198.3 millions (16.6%) was generated by CDB’s reserves and current net income.3 Thus another objective —that of mobilising financial resources for the development of the region— is also being met.
3
The regional member countries, excluding the Borrower Member Countries, are: Colombia; Mexico, and Venezuela. The non-regional member countries are Canada; China; Germany; Italy, and the United Kingdom.
1993 1994 1995 1996 1997 1998 1999 2000 2001
Moody's Fitch S&P
TEQUILA CRISIS ASIAN CRISIS BRASILIAN CRISIS RUSSIAN CRISIS ARGENTINE CRISIS BBB -/ Baa3 BBB / Baa2 BBB+ / Baa1 A- / A3 A / A2
Table 12
CARIBBEAN DEVELOPMENT BANK (CDB): DISTRIBUTION OF LOANS, CONTINGENT LOANS, EQUITY AND GRANTS APPROVED (NET) BY COUNTRIES
(Millions of $US and percentages)
1970-2000 1997 1998 1999 2000
Countries
US$ % US$ % US$ % US$ % US$ %
Anguilla 23 1.2 -2 -4.5 2 1.5 - - 8 4.3
Antigua and Barbuda 33 1.7 15 27.5 1 0.6 - - 0 0.0
Bahamas, The 53 2.8 0 -0.3 -9 -7.4 10 6.6 0 0.0
Barbados 190 9.9 2 4.0 54 44.6 -1 -1.0 38 20.4
Belize 181 9.4 22 40.4 13 11.1 18 11.8 18 9.7
British Virgin Islands 53 2.8 0 0.0 - - 21 13.9 0 0.0
Cayman Islands 44 2.3 - - - -Dominica 137 7.1 14 25.4 0 -0.3 10 6.6 17 9.2 Grenada 99 5.1 4 6.8 6 5.2 2 1.2 12 6.4 Guyana 134 6.9 0 0.0 6 4.7 1 0.3 0 0.2 Jamaica 281 14.6 -14 -25.1 18 14.8 5 3.5 41 22.1 Montserrat 15 0.8 0 0.0 -2 -1.4 0 0.1 0 0.0
St. Kitts and Nevis 99 5.1 7 13.0 4 3.3 7 4.7 4 2.0
St. Lucia 198 10.3 6 11.3 4 3.3 46 30.5 17 9.2
St. Vincent and the Grenadines 104 5.4 0 0.8 4 3.3 0 0.1 6 3.2
Trinidad and Tobago 141 7.3 -8 -14.8 18 15.2 19 12.5 13 6.8
Turks and Caicos Islands 21 1.1 6 10.4 0 0.1 0 0.1 4 2.1
Regional 118 6.1 3 5.1 2 1.5 14 9.1 8 4.2
Less developed countriesa 1 009 52.4 72 131.1 32 26.7 105 69.0 85 46.2
Total 1 926 100 55 100 122 100 152 100 185 100
Source: Caribbean Development Bank (CDB), Annual Reports.
a The less developed countries are: Anguilla, Antigua and Barbuda, Belize, Dominica, Grenada, Montserrat, St. Kitts
and Nevis, St. Lucia, St. Vincent and the Grenadines. To these are added the United Kingdom Overseas Territories of the British Virgin Islands, the Cayman Islands and the Turks and Caicos Islands.
CDB provides loan financing to the governments of its Borrowing Member Countries and to public and private-sector entities in those countries. It also lends to private-sector entities without government guarantee, and invests in equities in those enterprises. As part of its loan financing, CDB includes technical assistance to public and private-sector enterprises in its Borrowing Member Countries, in majority throw grants provided at 76.8% for the 30 years of activity to the Less Developed countries (table 13). For example, as part of the technical assistance program, the CDB approved in 2000 a grant to assist in financing the establishment of an Agricultural Trade Negotiating Unit. This unit would help in preparing CDB Borrowing Member Countries to participate effectively in international agricultural trade negotiations under World Trade Organisation (WTO), the Free Trade Area of the Americas (FTAA) and other trading agreements.
Table 13
CARIBBEAN DEVELOPMENT BANK (CDB): SUMMARY OF TOTAL FINANCING APPROVED (NET):LOANS, CONTINGENT LOANS, EQUITY AND GRANTS
(Millions of $US) 1970-1999 2000 Total Loans 1 588.2 179.4 1 767.6 Contingent loans 5.3 - 1 767.6 Equity 15.9 0.9 5.3 Grants 131.9 4.6 136.5 Total 1 741.3 184.9 1 926.2
Since the adoption of the Strategic Plan 2000-2004, CDB has focused on poverty reduction. It provides technical assistance and loan financing to assist its Borrowing Member Countries in five broad strategic areas that are linked to sustained poverty reduction: poverty and vulnerability; broad-based economic growth, good governance and public policy, economic integration and environmental protection. To meet these strategic objectives, CDB operates in the following sectors: agriculture; industry (including mining); tourism; education and health; economic and social infrastructure (electricity, water and sewerage, transportation, housing) and the environment (including solid waste management).
For the period 1970-2000, the sectors that received more financial assistance were transportation, communication sea defence; and financing and distribution (45.5% of all cumulative approvals). Social services have received only a 11.9% of the total financing for the same period, but as the strategic objectives are changing and focusing to the reduction of poverty, for the period 1997-2000, this sector has received on average a 23.6% of the total approvals (table 14).
Table 14
CARIBBEAN DEVELOPMENT BANK (CDB): SUMMARY OF TOTAL FINANCING APPROVED (NET) BY SECTOR: LOANS, CONTINGENT LOANS, EQUITY AND GRANTS
(Millions of $US and percentages)
1970-2000 1997 1998 1999 2000
Sector
US$ % US$ % US$ % US$ % US$ %
Agriculture, forestry and fishing 112 5.8 0 0.5 7 5.9 0 0.1 11 5.9
Mining and quarrying 39 2.0 -22 -40.1 0 0.3 - - -
-Manufacturing 133 6.9 -1 -1.3 0 -0.1 -12 -7.9 0 0.0
Tourism 62 3.2 4 6.8 -6 -4.7 0 0.3 7 4.0
Transportation, communication
and sea defence 448 23.2 16 28.5 37 30.4 57 37.2 6 3.4
Power, energy and water 157 8.1 16 28.5 0 0.1 10 6.7 4 2.0
Social services 228 11.9 21 38.9 31 25.4 16 10.2 37 20.1
Multi-sector and others 320 16.6 1 2.7 6 5.2 35 23.3 88 47.5
Financing and distribution 429 22.3 20 35.5 46 37.4 46 30.1 31 17.0
Total 1 926 100 55 100 122 100 152 100 185 100
Source: Caribbean Development Bank (CDB), Annual Report 2000.
Presently, Caribbean countries face the challenge of a liberalised international environment, characterised by the erosion of preferential trade arrangements on which they have traditionally depended; changes brought on by radical technological developments in the fields of information and communication; and those likely to result from the future establishment of the Free Trade Area of the Americas (FTAA). Compounding these is the declining availability of concessionary aid resources. For this purpose, countries in the region will need to undergo major restructuring and global repositioning. In order to assist the Caribbean countries in this process, CDB and the Inter-American Development Bank (IDB), whose activities will be presented in the next section, have formed a Task Force for which the main objective is to develop proposals and programs for addressing the challenges faced by CARICOM member countries.