STAFFORDSHIRE UNIVERSITY
Faculty of Business, Education and Law
Business School
Assessing Banking Sector Stability with Special Reference to
Montenegro and Central and Eastern Europe
Maja IVANOVIĆ
September 2014
A thesis submitted in partial fulfilment of the requirement of Staffordshire
University for the award of the degree Doctor of Philosophy
i
Abstract
The aim of this research is to investigate the main weaknesses of the banking sector in Montenegro and, more generally, in Central and Eastern Europe. By contributing to the understanding of banking sector fragility, we seek to help regulatory authorities craft more effective regulations and policy interventions in order to minimize the costs that could arise from banking instability. The review of previous research suggests that an increase in the incidence of non-performing loans indicates increasing fragility of the banking sector and/or the lack of efficient banking supervision. Thus, the ratio of non-performing loans is taken as the key indicator of banking vulnerability. To examine the determinants of non-performing loans we use data at the individual bank level. We investigate whether in these countries the ratio of non-performing loans is driven predominantly by macroeconomic developments (i.e. similar factors to those recognized in the theory of financial crises) or by transition-specific factors, such as inadequate risk-assessments, the high risk appetite of banks’ management and the high concentration in the banking sector. This empirical analysis initially focuses on the sensitivity of the ratio of non-performing loans to macroeconomic and bank-specific factors in Montenegro. Subsequently, the analysis is extended to Central and East European countries. Bearing in mind the large presence of foreign banks in these countries, a particular feature of this analysis is that non-performing loans are modelled to capture differences between banks based on ownership structure. In order to account for time persistence in the structure of non-performing loans, a dynamic panel approach is used. However, in the Montenegrin model, given that the lack of cross sectional units precludes GMM Estimators, we investigate the use of FE estimation adjusted to take account of dynamic misspecification. The empirical findings suggest that strong performance in the real economy results in a lower ratio of non-performing loans but there is also a significant positive effect of past rapid loans growth in the second year after the end of the credit boom. The latter finding suggests that aggressive lending coincides with more reckless risk taking. Moreover, the empirical evidence suggests that some bank-specific features, which reflect banks’ management policies, affect the evolution of non-performing loans. The multi-national study suggests that foreign banks are likely to have lower ratios of non-performing loans. Based on our findings, regulatory authorities should expand their monitoring framework to include both macroeconomic and bank-specific indicators when assessing the stability of the banking system. In addition, regulators should be more concerned about any loosening of bank lending criteria in an upturn, since our results suggest a delayed effect of loans growth on the incidence of non-performing loans.
ii
Table of Content
ABSTRACT………….. ... I TABLE OF CONTENT... II LIST OF TABLES ... V LIST OF FIGURES ... VI LIST OF APPENDICES ... VIII LIST OF ABBREVIATIONS ... IX ACKNOWLEDGEMENTS ... XIICHAPTER 1: RECENT ECONOMIC DEVELOPMENT IN MONTENEGRO WITH SPECIAL
REFERENCE TO BANKING SECTOR STABILITY ... 1
1.1 Introduction ... 1
1.2 The Montenegrin Macroeconomic Environment ... 2
1.3 The Montenegrin Money Market ... 8
1.4 The Banking System ... 9
1.4.1 Number of Banks, Competition and Concentration of Banks ...9
1.4.2 Structure of Assets and Liabilities ... 10
1.4.3 Liquidity ... 17
1.4.4 Profitability ... 20
1.4.5 Market Risk ... 21
1.5 The Role of the Central Bank of Montenegro ... 22
1.6 The Stability of the Banking Sector in Montenegro ... 27
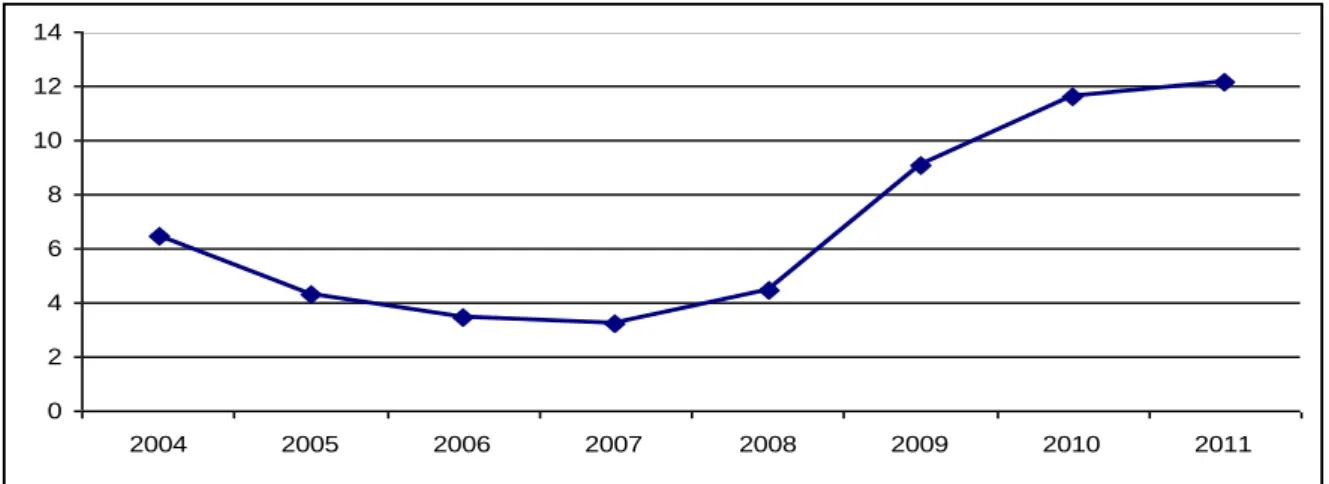
1.7 Comparative Developments in the Banking Sectors of Central and East European Economies ... 30
1.8 Conclusion and the structure of the thesis ... 32
CHAPTER 2: BANKING SECTOR INSTABILITY: CHARACTERISTICS, MECHANISMS AND CONSEQUENCES ... 34
2.1 Introduction ... 34
2.2 Financial and Banking Stability ... 35
2.2.1 Liquidity ... 39
2.2.2 Solvency ... 42
2.2.3 Profitability ... 43
2.3 Banking Crises ... 46
2.4 Links between Banking Sector Stability and Economic Activity ... 50
2.5 Non-Performing Loans ... 53
2.6 Contagion ... 60
2.7 Conclusion ... 63
CHAPTER 3: THE GLOBAL FINANCIAL CRISIS AND ITS IMPACT ON CENTRAL AND EAST EUROPEAN ECONOMIES ... 65
3.1 Introduction ... 65
3.2 The Global Financial Crisis ... 66
3.2.1 Causes of the Global Financial Crisis ... 67
3.2.2 Consequences of the Global Financial Crisis ... 72
3.3 Macroeconomic Vulnerabilities in Central and Eastern Europe in the Pre-Crisis Period ... 76
iii
3.4 Financial Linkages in Central and Eastern Europe ... 86
3.4.1 Banking in Central and Eastern Europe — an Overview of Bank Ownership ... 86
3.4.2 “Common Lender” and Cross-Border Linkages ... 90
3.5 Impact of the Global Financial Crisis on Central and Eastern Europe ... 93
3.5.1 Actions of Parent Banks in CEE in the Period of Crisis ... 99
3.6 Conclusion ... 104
CHAPTER 4: BANKING REGULATION AND SUPERVISION IN ORDER TO MAINTAIN BANKING STABILITY ... 106
4.1 Introduction ... 106
4.2 Regulation, Supervision and Banking Stability ... 107
4.2.1 Regulatory Challenges in Financial Systems Dominated by Foreign Banks ... 115
4.3 Review of the Basel Arrangements ... 118
4.3.1 Basel III ... 126
4.4 From Micro to Macro-Prudential Regulation and Supervision ... 129
4.4.1 The Instruments Used to Assess Banking Sector Stability ... 132
4.5 Conclusion ... 139
CHAPTER 5: ESTIMATION OF MACROECONOMIC AND BANK-SPECIFIC DETERMINANTS OF THE QUALITY OF LOANS IN MONTENEGRO ... 141
5.1 Introduction ... 141
5.2 Determinants of Non-performing Loans... 142
5.2.1 Macro Determinants of Non-performing Loans ... 143
5.2.2 Micro Determinants of Non-performing Loans ... 149
5.3 Data Analysis ... 157
5.4 Econometric Specification ... 159
5.5 Estimation Results ... 163
5.6 Conclusion ... 167
CHAPTER 6: ASSESSING THE DETERMINANTS OF THE QUALITY OF LOANS IN CENTRAL AND EAST EUROPEAN COUNTRIES ... 169
6.1 Introduction ... 169
6.2 Methodology and Empirical Consideration ... 170
6.3 Data Analysis ... 179
6.4 Estimation Procedure ... 184
6.5 Model 1- Results ... 189
6.6 Model 2 - Results ... 193
6.7 Comparison with Klein (2013) ... 201
6.8 Model 3 - Results ... 207
6.9 Model 4 - Results ... 210
6.10 Sample Selection ... 213
6.11 Conclusion ... 215
CHAPTER 7: CONCLUDING REMARKS ... 217
7.1 Introduction ... 217
7.2 Main Findings of the Research ... 218
7.3 Contribution to Knowledge ... 223
7.4 Policy Implications ... 226
7.5 Limitations of the Research ... 231
iv 7.7 Conclusion ... 234 REFERENCE………. ... 235 APPENDICES……... 264 APPENDIX 5……... 264 APPENDIX 6……... 269
v
List of Tables
Table 1.1 Main macroeconomic indicators for Montenegro from 2004 to 2012 ... 2
Table 1.2 Concentration of the top banks in Montenegro, end 2010 ... 9
Table 1.3 The quality of banking sector’s assets ... 14
Table 1.4 Loan to deposit ratio in Montenegro from 2004-2010 ... 17
Table 1.5 The degree of independence of the CBM ... 26
Table 2.1 Risk weights of on-balance-sheet assets ... 56
Table 2.2 Risk parameters by the IRB approach ... 57
Table 3.1 World trade: changes in volume of exports and imports, by major country groups, 2003-2012 ... 74
Table 3.2 Delivery on EBRD’s, EIB`s and World Bank`s Commitments under the Joint IFI Action Plan, up to end 2010 (in millions of Euros) ...103
Table 4.1 The body/agency which regulates and supervises commercial banks ...108
Table 4.2 The regulatory capital adequacy regimes the countries used as of end of 2010 ...119
Table 4.3 Components of Basel II ...120
Table 4.4 Basel II and Basel III capital requirements ...127
Table 4.5 Comparison between Microprudential and Macroprudential Supervision ...131
Table 5.1 Macroeconomic determinants of Non- performing loans ...148
Table 5.2 Bank-specific determinants of NPLs ...154
Table 5.3 Descriptive statistics for macro and bank-specific variables in Montenegro ...158
Table 5.4 Fixed effects linear model with an AR (1) disturbance ...163
Table 6.1 Exchange Rate Systems in CEE at the end of 2010 ...173
Table 6.2 Number of commercial banks by countries in the sample ...180
Table 6.3 Number of dependent variable observations by country and year ...180
Table 6.4 Descriptive statistics for macro variables ...182
Table 6.5 Descriptive statistics for bank-specific variables ...182
Table 6.6 Dynamic Panel System GMM estimations results from model 1 ...190
Table 6.7 Comparison statistics of System-GMM with OLS and FE in terms of the estimated coefficient on the lagged dependent variable ...191
Table 6.8 Dynamic Panel System GMM estimations results from the model 2 ...197
Table 6.9 Comparison statistics of System-GMM with OLS and FE in terms of the estimated coefficient on the lagged dependent variable – MODEL 2 ...198
Table 6.10 The combined coefficient of credit growth variable and Interaction2009 ...198
Table 6.11 Long-run coefficients for the variables ...199
Table 6.12 Comparison of the variables ...203
Table 6.13 Comparison of the results: significant variables only ...204
Table 6.14 Dynamic Panel System GMM estimations results from model 3 ...208
Table 6.15 Comparison statistics of System-GMM with OLS and FE in terms of the estimated coefficient on the lagged dependent variable – MODEL 3 ...209
Table 6.16 Long-run coefficients for the variables ...210
Table 6.17 Dynamic Panel System GMM estimations results from model 4 ...211
Table 6.18 Comparison statistics of System-GMM with OLS and FE in terms of the estimated coefficient on the lagged dependent variable – MODEL 4 ...212
vi
List of Figures
Figure 1.1 Capital and financial account in Montenegro from 2007 to 2012 ... 4
Figure 1.2 Structure of FDI inflows into Montenegro from 2008 to 2012 ... 6
Figure 1.3 Public debts as a percentage of real GDP in Montenegro from 2006 to 2012 ... 7
Figure 1.4 a) Total banking sector assets/ GDP (%) b) Annual growth of assets (%) in the period 2004-2012 ... 10
Figure 1.5 Structure of total assets in the period 2004-2012 ... 11
Figure 1.6 Annual growth of total outstanding loans in Montenegro, from 2004 to 2012 ... 12
Figure 1.7 Term structure of loans in Montenegrin banking sector from 2004 to 2012 ... 13
Figure 1.8 Share of non-performing loans in total loans in Montenegro, 2004 to 2012 ... 14
Figure 1.9 a) Banking sector`s asset by categories (good-A, special-B, substandard-C, doubtful assets-D and losses-E), in millions of euro ... 15
Figure 1.10 Structure of total liabilities in the period 2004-2012 ... 16
Figure 1.11 Banks’ borrowing from abroad, in millions of euro ... 17
Figure 1.12 Loan to deposit ratio in CEE at the end of 2010 ... 18
Figure 1.13 Movements in the ratio of liquid assets to short-term and long-term liabilities ... 19
Figure 1.14 Movements of ROA and ROE at the aggregate level in the period from 2004 to 2011 ... 20
Figure 1.15Aggregate exposure of foreign currency risk in Montenegro, in millions ... 21
Figure 1.16 Non-performing loans in Central and Eastern Europe, average as a % of total loans, 2004 to 2011... 31
Figure 3.1 The securitization process ... 69
Figure 3.2 GDP growth (annual %)a in Central and East European countries ... 76
Figure 3.3 a) Gross domestic investment (% of GDP) Figure 3.3b) Gross domestic savings (% of GDP) in CEE countries ... 77
Figure 3.4 Net private financial flows in Central and Eastern Europe (% GDP), 1999-2009 ... 78
Figure 3.5 Net capital flows to emerging regions in the pre-crisis period (% of GDP) ... 79
Figure 3.6 Net capital flows to countries in CEE (% of GDP) from 2004-2007 ... 79
Figure 3.7 Inward FDI / CAD Ratio in CEE (2006-2007) ... 80
Figure 3.8 Credit to the private sector (% GDP, 2004-2011) ... 82
Figure 3.9 The CEE Region: Catching Up from Low Levels of Intermediation ... 83
Figure 3.10 Change in deposit and credit to GDP (2003-2007), in percentage points ... 84
Figure 3.11 The relationship between pre-crisis credit growth and current account balances .... 85
Figure 3.12 Market Shares of Assets of Foreign-Owned Banks in the CEE Countries in 2011 ... 88
Figure 3.13 Market shares of foreign banks in CE and SEE countries by country of origin (in % total assets) in 2011 ... 89
Figure 3.14 Share of assets of CEE subsidiaries as % of group assets ... 90
Figure 3.15 Exposure of CEE countries to Western European countries in 2007 ... 92
Figure 3.16 GDP growth rate in CEE after 2007, on average (left) and by countries (right) ... 94
Figure 3.17 Net capital flows to emerging regions in the post-crisis period (% of GDP) ... 95
Figure 3.18 Net capital flows to countries in CEE (% of GDP) from 2007-2011 ... 95
Figure 3.19 Unemployment rate (%) in CEE economies in the post-crisis period ... 96
Figure 3.20 Growth of total loans (in % y-o-y change in Euros) in Central and East European countries ... 97
Figure 3.21 Average growth of total loans (in % y-o-y change in Euros) in Central, East and South East European countries ... 98
Figure 3.22 Share of non-performing loans in total loans (%) in CEE ... 99
Figure 3.23 Cross-border flows, % change by source in the global emerging regions in the period before and after the GFC ...101
Figure 3.24 Vienna Initiative improvements ...102
Figure 5.1 The growth of loans in Montenegro (aggregate data) and its lagged effect on the incidence of NPLs ...161
vii
Figure 6.1 Public debt as a % of GDP in CEE countries ...172
Figure 6.2 Foreign currency loans as a % of total loans in selected CEE countries from 2009-2011...173
Figure 6.3 Non-performing loans and adequacy capital ratios for CEE countries in 2011 ...175
Figure 6.4 Return on equity (ROE) in CEE countries in 2011 ...176
Figure 6.5 Loans to deposit ratio in CEE banking systems at the end of 2011 (%) ...177
Figure 6.6 Evolution of banks` non-performing loans from 1999-2011 ...183
Figure 6.7 Credit growth in CEE countries ...195
viii
List of Appendices
Appendix 5.1 Correlation Matrix ... 264
Appendix 5.2 Testing for CFR ... 265
Appendix 5.3 Model with time dummies ... 266
Appendix 5.4 Model without time dummies ... 268
Appendix 6.1 Correlation Matrix ... 270
Appendix 6.2. Estimation Procedure ... 271
Appendix 6.2.1 Fixed Effects ... 271
Appendix 6.2.2 System GMM ... 275
Appendix 6.2.2.1 Increasing Lag Limits and Using Collapse Command ... 276
Appendix 6.2.3 Model 1 ... 279
Appendix 6.3 Credit Growth Improvement Model- Model 2 ... 283
Appendix 6.4. Model 3 ... 287
Appendix 6.5 Model 4 ... 291
ix
List of Abbreviations
AMA - Advanced Measurement Approach AMCs - Asset Management Companies AR - Autoregressive Structure
BCBS - Basel Committee on Banking Supervision BIS - Bank for International Settlements CAD - Current Account Deficits
CAP - Capital Adequacy Ratio CBM - Central Bank of Montenegro CDOs - Collateralized Debt Obligation
CEBS - Committee of European Banking Supervisors CEE - Central Eastern Europe
CRF - Common Factor Restrictions
CH - Switzerland
CIR - Cost to income ratio
CIS - Commonwealth of Independent States CR - Credit growth rate
CRD - Capital Requirement Directive DEBT - Public debt
DLRM - Dynamic Linear Regression Model EAD - Exposure at default
EBA - EBA European Banking Authority
EBRD - European Bank for Reconstruction and Development
EC - European Commission
ECB - European Central Bank EIB - European Investment Bank ESRB - European Systemic Risk Board
EU - European Union
EU-15 - Member States of the European Union as of December 31,2003 2003
EUR - Euro
EWS - Early Warning Systems EXCR - Exchange rate
FDI - Foreign direct investment
FE - Fixed Effects
FSA - Financial Services Authority
FSAPs - The Financial Sector Assessment Program
FX - Foreign Exchange
GCC - Gulf Cooperation Council GDP - Gross Domestic Product
x
GFC - Global Financial Crisis
GFDR - Global Financial Development Report GMM - General Methods of Moments
IIF - Institute for International Finance IMF - International Monetary Fund INF - Inflation rate
INTER - Interest rate
IRB - Internal Rating-Based LCR - Liquidity Coverage Ratio LGD - Loss given default
LIBOR - London Interbank Offered Rate LTCM - Long-Term Capital Management LtD - Loans to deposit ratio
LTROs - Long-term refinancing operations MFIC - Montenegrin Foreign Investors Council
MPBS - Law on Measures for Protection of the Banking System MSHARE - Market Share
NPLs - Ratio of Non-Performing Loans to Total Gross Bank Loans NSFR - Net Stable Funding Ratio
OECD - Organisation for Economic Co-operation and Development OGM - Official Gazette Montenegro
OLS - Ordinary Least Squares
PCA - Principal Components Analysis PD - Probability of default
R&D - Research and Development
RE - Random Effects
ROA - Return on Average Assets ROE - Return on Average Equity
RU - Russia
RWAs - Risk-Weighted Assets
SCAP - Supervisory Capital Assessment Program SEE - South-Eastern Europe
SIV - Structured Investment Entities SPV - Special Purpose Vehicle
TR - Turkey
UK - United Kingdom
UNEMP - Unemployment rate
US - United States
USD - United States, Dollars VAT - Value Added Tax
xi
VI - Vienna Initiative
WB - WB World Bank
xii
Acknowledgements
I would like to thank the Open Society Foundation and Staffordshire University whose scholarship enabled me to make my contribution to science through this thesis. People who help other people gain knowledge and create are great people.
I owe a debt of gratitude to my principal supervisor professor Nick Adnett. There are a few things that shape us and leave a permanent mark: some books, love, music and some people. Professor Adnett is one of those people, owing to whose, in the first place human, then educational and professional attitude I have matured and certainly rounded up a stage of my growing up. His suggestions, useful criticism and high demands helped me finish this thesis, consider it good and believe in it. What is more important, he helped me build confidence in what I was doing. I have learned from him how valuable it is to be systematic, precise and concrete in research, which I will apply in my future work. I would also like to thank my second supervisor professor Geoff Pugh for his lucidity, dedication, intelligence and humour, which made it easier to navigate through this challenging journey.
I am deeply grateful to my family, always and forever. It is the point from which everything starts and where everything ends. My father, mother, sister and brother! Thanks to their overwhelming love and support I can do anything I want. Special thanks go to "the dearest women" in my life - my mom Nada, for her "anything is possible" encouragement, which always worked, and to my sister Iva, for all the moments we have shared and complemented, as the two halves of the same whole.
Lastly, I would like to extend my gratitude to the Central Bank of Montenegro for supporting my participation in this program at Staffordshire University.
1
CHAPTER 1:
Recent Economic Development in Montenegro
with Special Reference to Banking Sector Stability
Contents:
1.1 Introduction ... 1
1.2 The Montenegrin Macroeconomic Environment ... 2
1.3 The Montenegrin Money Market ... 8
1.4 The Banking System ... 9
1.4.1 Number of Banks, Competition and Concentration of Banks ... 9
1.4.2 Structure of Assets and Liabilities ... 10
1.4.3 Liquidity... 17
1.4.4 Profitability ... 20
1.4.5 Market Risk ... 21
1.5 The Role of the Central Bank of Montenegro ... 22
1.6 The Stability of the Banking Sector in Montenegro ... 27
1.7 Comparative Developments in the Banking Sectors of Central and East European Economies ... 30
1.8 Conclusion ... 32
1.1
Introduction
This Chapter provides an assessment of the main characteristics and developments of the Montenegrin banking sector, which are important for the analysis of the stability of the banking sector in Montenegro. The stock and money markets are still in their infancy, thus the banking sector has a dominant role in the financial system in Montenegro. Banks are the primary source of funding for all sectors of the economy. The banking sector is mostly foreign owned. It is frequently argued that a stable and efficient banking sector helps to accelerate economic growth. Banking stability in Montenegro is necessary not only to promote internal stability but also to attract the inflow of the foreign direct investment and the development of small and medium enterprises necessary for the convergence to the EU’s level of per capita GDP. Given the nature of the empirical analysis undertaken in the research programme reported in this thesis, the emphasis in this Chapter is on developments from 2004 to 2010, though more recent data is utilised when available.
The Chapter starts with a review of macroeconomic indicators of the Montenegrin economy (Section 1.2) followed by an analysis of the conditions in the money market (Section 1.3). Section 1.4 focuses on the banking sector, examining the degree of concentration and competition, the structure of banks’ assets and liabilities, and their exposures to credit, liquidity and market risk. Section 1.5 analyses the role of the Montenegrin Central Bank and its influence on the Montenegrin economy. Section 1.6 examines the need for a stable
2
banking system in Montenegro, while in Section 1.7 an initial comparison is made with banking sector developments elsewhere in Central and Eastern Europe. Finally, the Chapter concludes with section 1.8, which explains the main objectives of this research programme.
1.2
The Montenegrin Macroeconomic Environment
1Montenegro is a small and open economy. After a relatively low GDP growth rate in the first years of this millennium, during the three-year pre-crisis period Montenegro saw a remarkably accelerated economic growth with the average rate amounting to 8.7 per cent. The main factors that contributed to this rapid economic growth were: the introduction of the euro as official currency, privatization, trade liberalization and tax reform, the large inflows of foreign direct investment and the stable management of public finance. For example, in 2007 real GDP growth reached 10.7 per cent, the unemployment rate dropped to about 11 per cent, while average earnings increased by 30 per cent. In the same year, public spending accounted for 47 per cent of GDP, though the budget had a surplus of 6 per cent of GDP. In the same year, public debt was only about 27 per cent of GDP while the internal debt was about 14 per cent of GDP.
Table 1.1 Main macroeconomic indicators for Montenegro from 2004 to 2012
Source: Monstat database and Central Bank of Montenegro
However, the crisis induced a decline in economic activity and the deterioration of almost every macroeconomic indicator. Industry is one of the branches which was most severely hit
1All data are provided by Statistical Office of Montenegro - MONSTAT and the Central Bank of Montenegro
(CBM). Year 2004 2005 2006 2007 2008 2009 2010 2011 2012 Growth rate (%) 4.4 4.2 8.6 10.7 7.5 -5.7 2.5 3.2 -2.5 Inflation rate (%) 2.2 2.4 2.8 7.7 6.9 1.5 0.7 2.8 5.1 FDI Inflows (in thousand of Euro) 54,741 383,000 644,000 1,057,229 847,316 1,224,000 652,836 494,741 633,694 FDI Outflows (in thousand of Euro) 2,931 8,300 178,000 489,447 265,363 157,503 100,728 105,636 172,104 Net FDIs (in
thousand of Euro) 51,810 374,700 466,000 567,782 581,952 1,066,497 552,107 389,104 461,590 Current account deficit (% of GDP) -9.7 -9.1 31.1 -37.9 -47.7 -25.4 -20.0 -18.7 -14.7
3
by the crisis. The crisis strongly hit the Montenegrin metal industry as well as the related mining industry. In addition to the inherited problems, these branches have faced increasing problems in placing their products in international markets.
The crisis adjustment became apparent in the behaviour of inflation which reached its record low 0.7 per cent in 2010. Namely, over the three-year pre-crisis period the inflation rate averaged almost 6 per cent, in part reflecting the high rates of economic growth. The global financial crisis induced a decrease in aggregate demand, both national and international, resulting in low rates of inflation worldwide. Substantial monetary and fiscal stimuli used globally to combat recession inevitably have affected Montenegro, so in the post-crisis period inflation in Montenegro was a result of price rises in energy and food products which Montenegro mainly imported. The inflation rate in 2006 amounted to less than 3 per cent, though in 2007 it increased to 7.7 per cent (see Table 1.1).
In 2007, Montenegro had a very high balance of payments deficit (44 per cent of GDP), which was a consequence of the faster growth in expenditure on imports compared to income from exports in the trade balance. The main causes of that large deficit in the trade balance were: accelerated economic growth and increased foreign direct investment; and, in import-dependent activities, increased openness together with weak competitive ability of the domestic economy (CBM, 2008). Namely, the accelerated economic growth meant higher FDIs, and higher FDIs stimulated a higher import of goods. The latter is explained by the fact that the most FDIs have been in tourism and real estate (construction), and those sectors required large imports of goods for their further development.
4
Source: CBM database
Figure 1.1 Capital and financial account in Montenegro from 2007 to 2012
Furthermore, as shown in the Figure 1.1 in the 2007-2012 period the capital and financial account recorded net inflows as a result of net inflows of foreign direct investment sub-accounts. The portfolio sub-account recorded net outflows in all years except in 2010 and 2011, while the other investment sub-account recorded net outflows from 2009. Owing to euroization, the high level of external debt and large debt service requirements Montenegro is vulnerable to a slowdown in capital inflows and this requires the CBM to pursue a more prudent policy. Furthermore, given that Montenegro is a small country, even a relatively small shock may have a large impact on the economy. Thus, the CBM should enforce prudential norms, requiring sound capital buffers and take appropriate supervisory measures with problem banks. Bearing in mind the decline in the capital inflows and a large fall in external and domestic demand, significant external adjustment took place. Namely, the current account deficit was reduced by half between 2008 and 2010, even though imports contracted. However, in 2010 the capital account deficit was high at about 26 percent of
GDP, as exports and tourism hardlyrecovered.
During 2006–2010, net FDI financed on average 70 per cent of the current account deficit,
excluding the one-off inflows from the recapitalization and partial privatization of
Montenegro’s power utility in 2009. Access to capital was retained through foreign banks’
increased financial support to their Montenegrin subsidiaries, which contributed to a rise in
external debt. In terms of the share of FDIs in gross domestic product, which reached almost 25 per cent, Montenegro had the highest FDIs inflows in the region in 2007. Those FDIs have been concentrated in the growth-enhancing sectors of the economy. Factors which might have contributed to that high foreign direct investment inflows included privatization, the
-500000 0 500000 1000000 1500000 2000000 2007 2008 2009 2010 2011 2012
Direct investment Portfolio investment
5
introduction of VAT at rates from 17 per cent (that was lower than in other countries of the region), low taxes on profits at only 9 per cent and reductions in other barriers to business. Those were all factors that made FDIs in Montenegro more attractive.
In 2008 the net inflow of foreign direct investment (inflow minus outflow) increased by about 8 per cent compared to the previous year, while the total FDI inflows in 2008 decreased by about 20 per cent compared to 2007, of which 99 per cent related to non-residents investing in Montenegro and 1 per cent concerned the withdrawal of assets invested abroad. Outflow of the foreign direct investment in 2008 was also reduced by 45 per cent compared to the previous year. Looking at the structure of the outflow, 63 per cent were related to real estate while the withdrawal of foreign equity shares in domestic banks and companies amounted for 10 per cent. In that period, investments of residents of Montenegro in the banks and companies were reduced and they participated in total outflow of FDI with 19 per cent. The remaining 8 per cent of total outflow of FDI was dedicated to the reduction in inter-company debt and the withdrawal of share capital invested in another domestic company. Net FDIs were increasing until 2010, when they fell by 48 per cent (see Table 1.1). Even though net FDIs had a drastic fall, there had been still a significant FDIs inflow considering that there were no major privatisations in 2010.
Analysing the structure of inflows by country of origin in 2008, inflows from the EU
countries was 53.8 per cent of the total (the largest shares being from Cyprus2 about 15.5 per
cent and the UK about 8.3 per cent), while the largest investments from other countries come from the Russian Federation (15.1 per cent), Switzerland (7.9 per cent) and Serbia (5.2 per cent).
2
6
Source: CBM database
Figure 1.2 Structure of FDI inflows into Montenegro from 2008 to 2012
The structure of FDIs has improved a little from 2008. While investment in real estate has declined from 49% to 36% of total FDI, investment in companies and banks is more or less stabile (36% in 2007 and 34% in 2012). The decline of real estate in 2008 and 2009, was partly due to the smaller number of buyers from abroad, reduced supply of credit funds as a result of the crisis, and partly about the difficulties of registering land that emerged at the beginning of 2008. In addition, in 2008 foreign investments in local companies and banks amounted to 31 per cent less than the previous year. More diversified FDI has been noticed in 2010 and in later years. According to the CBM (2010) although Montenegro has not used all its potential to attract FDI, a new model of growth is required. The future development should be based on performance and competitiveness growth, international presence, and the further development of creativity and entrepreneurship.
The specificities of Montenegro, as small and open economy, indicate a large and volatile current account. For example, if any big project requires import of goods not locally produced, that may be quickly reflected in a build-up of current account deficits. The current account in the post-crisis period is lower than in the period before the crisis (see Table 1.1). However, this improvement in the balance of payments is not primarily the result of better competitiveness of the Montenegrin economy, but is rather due to global crisis and reduced domestic demand. According to the CBM (2010), the issue of competitiveness of the Montenegrin products in international market, both regarding their price and quality, remains a key problem that the economy will have to face in the future and require additional efforts to reduce the current account deficit.
0% 10% 20% 30% 40% 50% 60% 70% 80% 90% 100% 2007 2008 2009 2010 2011 2012
7
Given that from 2008 the fiscal deficit increased, a fiscal adjustment has been necessary, in order to ensure macroeconomic stability. With the decrease of GDP of about five per cent in 2009, the fiscal deficit increased rapidly. In addition, fiscal revenues declined, mainly because of non-payment of taxes and the liquidity problems of mainly state owned companies. The end of the expansion phase turned budget surpluses into significant deficits, resulting in a rise in public debt, with the Government issuing Eurobonds to finance their needs. Altogether, reflecting also the Government's support for the restructuring of large enterprises in the real sector, public debt increased to 51 per cent of GDP by the end of 2012.
Source: CBM database
Figure 1.3 Public debts as a percentage of real GDP in Montenegro from 2006 to 2012
Delayed and slowly progressing structural reforms in the public sector, which started before the global financial crisis and have not yet been completed, have contributed to the rising share of public spending in GDP. This may be justified in the short term, because the supply side is not yet generating the growth and corresponding tax revenue to cover government spending. Conversely, high government spending is being used to offset the still lacklustre performance of the private sector. If the public sector debt is to be sustainable, then in the long run it may be necessary to stimulate the competitiveness of the economy by strengthening the supply side, in particular export capabilities.
Overall, the macroeconomic indicators show that Montenegro in the pre-crisis years achieved macroeconomic stability and rapid economic growth. That was particularly important given the recent political turbulence in the region (the war in former Yugoslavia, hyperinflation and economic sanctions). Comprehensive reforms and macroeconomic stability enabled the signing of a Stabilization and Association Agreement with the EU and the application for EU
0 10 20 30 40 50 60 2006 2007 2008 2009 2010 2011 2012
8
membership. With the highest per capita FDI in Europe and the diversified origin of that FDI, Montenegro has relied and will continue to rely on FDI as a major source of growth. Specifically, foreign investors have been interested in the implementation of capital projects in infrastructure (highway) and energy (only 18 per cent of hydropower potential has been utilized) and major tourist projects on the Adriatic coast. However, as stated by Montenegrin Foreign Investors Council (MFIC) (2013), Montenegro should continue to reduce barriers to business, particularly in terms of faster decision-making at the state and local levels, which are necessary for the implementation of development projects. At the same time, it is necessary to encourage the diversification of the economic structure through an increase in small and medium enterprises and to continue strengthening their competitive abilities (Ivanovic et al., 2010).
1.3
The Montenegrin Money Market
The money market in Montenegro is in the early stages of development. The Montenegrin money market is characterized by a limited, or more precisely a scarce, choice of instruments and a relatively modest circle of market participants. There are several reasons for the slow development of this market. Until recently there was no adequate regulation of this market. In addition full euroization meant that the central bank has no transmission function. Additional reasons for the slow development of money markets were initially a very low and later high liquidity of banks, as well as the overall low level of liquidity in the Montenegrin economy. In a period of growth in banks' liquidity, the need for the issuance of their securities did not exist. However, in that period, the banks began to appear as the most important customers of short-term bills issued by Ministry of Finance to cover budget illiquidity.
In Montenegro the most widespread instruments in the money market are short-term treasury bills, which do not have a secondary market, bank guarantees and bilateral bank loans. The Central Bank of Montenegro, as the fiscal agent of the Ministry of Finance, organizes auctions of treasury bills with maturity 28, 56, 91 and 182 days. The Central Bank of Montenegro in this process has just a technical role, and receives funding for these operations. It publishes information on the amount of sales and the achieved average weighted interest rate. All finance raised from these auctions goes to the Ministry of Finance and the independence of the Central Bank is not jeopardised by this role. The participants in
9
the primary market of treasury short-term bills in Montenegro are: the Government (as the issuer), the Central Bank (as the fiscal agent) and, as the purchasers, banks, institutional investors (mostly insurance companies, stock exchanges, brokers and dealers), entities outside of the financial sector, as well as individuals.
Although there are inter-bank loans, they are made without an organized market, i.e. by agreement between the interested banks. Tradable deposit certificates and repurchase agreements as money market instruments did not exist until 2008, because of the high liquidity of banks. The Bank`s Law (2008) allowed banks to use these instruments based on the collateral of treasury bills with the Central Bank (repo transactions). Bank guarantees, although they exist in the form of guaranteeing the payment obligations of debtor, are not the subject of trading, and their possessor in case of an increased need for cash cannot sell them in a secondary market.
1.4
The Banking System
1.4.1 Number of Banks, Competition and Concentration of Banks
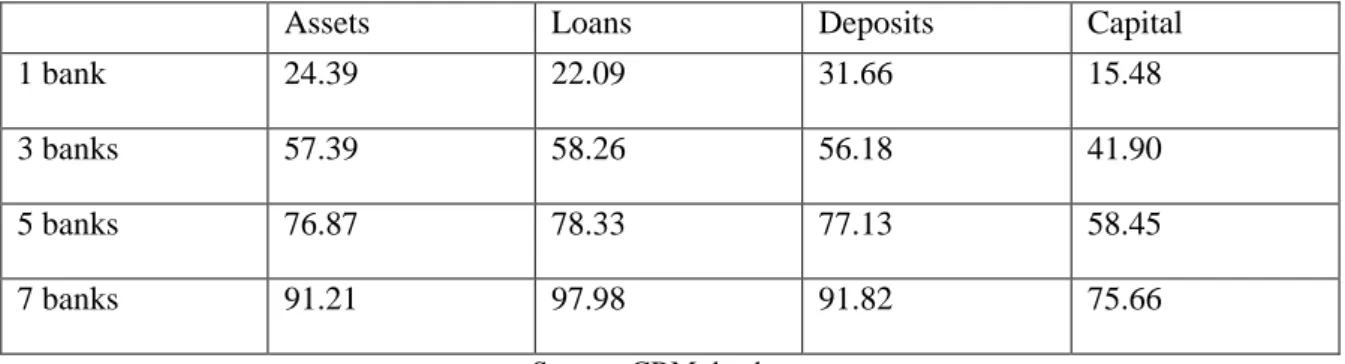
The Montenegrin banking sector is dominated by foreign banks. Namely, of the eleven banks which operate in Montenegro, nine of them are mainly foreign owned. Foreign-owned banks have around 90 per cent of total banking sector assets. Montenegrin banks have focused on the domestic market having little or no direct exposure to foreign markets. The degree of concentration in the Montenegrin banking system is very high (Table 1.2). At the end of 2010, one bank had a leading position with regard to all parameters, while the three largest banks accounted for 57 per cent of total assets and 56 per cent of deposits.
Table 1.2 Concentration ratio of the banking sector in Montenegro, end 2010
Assets Loans Deposits Capital
1 bank 24.39 22.09 31.66 15.48
3 banks 57.39 58.26 56.18 41.90
5 banks 76.87 78.33 77.13 58.45
7 banks 91.21 97.98 91.82 75.66
10
From 2004 to 2007, the Montenegrin banking sector expanded rapidly. The rapid growth was driven by the entry of foreign banks, along with increased domestic demand, particularly in the real estate sector (CBM, 2011). As outlined by Yildirim and Philippatos (2007), the presence of foreign banks may be beneficial for consumers by offering superior products and services, for the financial industry by increasing the quality of services and finally, for the economy by increasing efficiency. However, there may be some costs associated with the entry of foreign banks. Hellmann et al. (2000) reveal that in order to maintain or increase their market share foreign banks are inclined towards higher risk activities. These issues will be analysed further in Chapter 6. However, due to the overheated domestic demand and the impact of the global financial crisis the expansion of the banking sector halted in late 2008.
1.4.2 Structure of Assets and Liabilities
The impressive growth in the Montenegrin banking sector in the pre-crisis period, resulted in an increasing share of total banking sector assets in gross domestic product (GDP) from 26.6 per cent in 2004 to 111 per cent in 2007. Due to the influence of global financial crisis and restrictions on the credit activities of the banking sector, asset growth slowed down in 2008, increasing by 11 per cent. The asset growth stopped in 2009, declining by 8 per cent and further by 3 per cent in 2010. This decline continued until 2012.
Source: CBM database
Figure 1.4 a) Total banking sector assets/ GDP (%) b) Annual growth of assets (%) in the period 2004-2012
In the structure of total banking sector assets cash and cash equivalents (which include banks deposits at CBM and at other institutions abroad) and total outstanding loans are the most
27 38 67 111 107 102 97.3 86.9 89 0 20 40 60 80 100 120 2004 2005 2006 2007 2008 2009 2010 2011 2012 Assets/GDP 27.1 56.57 106 108 11 -8 -3 -4.55 -0.1 -20 0 20 40 60 80 100 120 2004 2005 2006 2007 2008 2009 2010 2011 2012 Annual growh of assets
11
important elements. From 2004 to 2008, their share in total assets constantly increased. However, the fall in the share of cash and cash equivalents in total banking sector assets became particularly worrying in 2008, pointing to the problems in the reduction of total deposits and difficulties related to the non-payment of outstanding credit claims.
Source: CBM database
Figure 1.5 Structure of total assets in the period 2004-2012
The expansion of the banking assets was based on the extremely high rate of credit growth, which was one of the highest in Central and Eastern Europe. Namely, in 2006 and 2007 extremely high rates of credit growth (125 per cent and 165 per cent, respectively) were a significant factor assisting the development of the real sector. However, such high growth rates in loans were not accompanied by adequate growth rates in provisions and capital, so that the Central Bank of Montenegro, in the fourth quarter of 2007 issued a set of restrictive measures, which limited credit growth in 2008. The biggest limitations were imposed on the biggest banks since the negative consequences of excessive credit expansion of those banks would have had the greatest impact on the overall stability of the banking sector. In addition to credit growth limitations, a requirement to maintain the solvency coefficient at a minimum 10 per cent in 2008 (legal minimum amounted to 8 per cent) was prescribed. Namely, increasing the amount of banks’ capital was expected to ensure adequate protection of banks’ clients’ interests. 0% 10% 20% 30% 40% 50% 60% 70% 80% 90% 100% 2004 2005 2006 2007 2008 2009 2010 2011 2012
12
Source: CBM database
Figure 1.6 Annual growth of total outstanding loans in Montenegro, from 2004 to 2012
Lending activity began to decline in the last quarter of 2008 due to the impact of the global financial crisis, with total loans outstanding falling by about two per cent in the last quarter of 2008, as banks became concerned about their worsening liquidity situation and the ability of their parent banks to provide additional financing. That decline continued in 2009, when total outstanding loans fell by 14 per cent, mainly due to banks’ deterioration of asset quality and a decline in demand for loans from the corporate sector, which was affected by the weakening situation in the real economy sector. In 2010, total outstanding loans declined by a further eight per cent. This decline continued until 2012.
According to the Central Bank’s classification of assets, loans are categorized as short term loans – approved for a period of one year and long term loans – loans approved for a period over one year. A tendency has been the growth of long-term loans in the reporting period, mainly because in the household loans there was a growth in mortgage loans, whilst loans to the private sector were mostly dedicated to the construction of tourist facilities, roads, etc.
121 57 125 165 25 -14 -8 -11 -4.77 -40 -20 0 20 40 60 80 100 120 140 160 180 2004 2005 2006 2007 2008 2009 2010 2011 2012
13
Source: CBM database
Figure 1.7 Term structure of loans in Montenegrin banking sector from 2004 to 2012
According to the banks reports to CBM, the quality of assets deteriorated from 2008. As can be seen in Figure 1.8, there has been a dramatic increase in the ratio of non-performing loans to total gross bank loans (NPLs). According to the CBM Quarterly Report (2009, December), asset deterioration was a consequence of the excessive credit growth in previous two years, which was stimulated by banks’ management motivated by quick profits, neglecting adequate and objective assessments of the financial ability of borrowers to repay loans. Thus, underestimation of assumed risks led to a deterioration in all parameters of the quality assets in the system. The high growth rates of economy motivated firms to undertake investment, leading to increased debt obligations for the business sector. Hence, the weakened economy, particularly the poor performance of the construction sector and the real estate market, contributed to a rapid increase in NPLs. This rapid increase of NPLs combined with increasing banking regulation, more stringent supervision, and the impact of those assets on banks’ risk-weighted assets (RWAs) encouraged Montenegrin banks to reconsider their long-term strategies concerning their assets. Namely, banks stopped approving new loans. Thus, an increase in non-performing loan ratios might be also due to the contraction in total outstanding loans as banks ceased lending, thus as a proportion of total loans NPLs increased.
0% 20% 40% 60% 80% 100% 2004 2005 2006 2007 2008 2009 2010 2011 2012
14
Source: CBM database
Figure 1.8 Share of non-performing loans in total loans in Montenegro, 2004 to 2012
In 2012, the reduction in lending by banks and the high burden of non-performing loans (NPLs) in banks' balance sheets, remained a challenge which could hamper economic growth.
For the purpose of adequate credit risk management, banks in Montenegro are obliged, pursuant to the Decision on Minimum Standards for Credit Risk Management in Banks (OGM, 87/09), inter alia, to classify risk asset and off-balance items in five categories (A, B, C, D, and E) and to allocate appropriate loan loss provisions.
Table 1.3 The quality of banking sector’s assets
Good Assets A Classify elements of assets that are estimated to be fully charged in accordance with the agreement
Special Assets B Classify elements of assets for which there is a low likelihood of
achieving a loss, and these elements of assets require special attention of bank because a potential risk, if would not be adequately followed, could lead to weaker prospects in charged
Substandard Assets C Classify elements of assets for which there is a high likelihood of achieving a loss, because clearly identified weaknesses
Doubtful Assets D Classify elements where, bearing in mind the ability of the debtor's credit, the value and possibility of realization collateral, payments are unlikely to happened;
Loss E Classify elements of assets that will be completely irrecoverable Source: The Decision on Minimum Standards for Credit Risk Management and Operations with Persons
Related with the Bank
5.53 3.6 2.86 3.16 7.2 13.5 21.0 15.5 17.6 0 5 10 15 20 25 2004 2005 2006 2007 2008 2009 2010 2011 2012
15
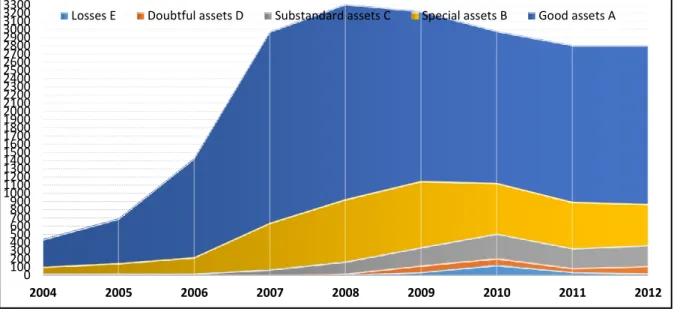
In order to have a clearer picture of the participation of non-performing assets to total assets, the following Figure 1.9 a) presents assets by categories, while the Figure 1.9 b) presents the evolution on non-performing assets by categories of substandard, doubtful assets and losses.
Source: CBM database
Figure 1.9 a) Banking sector`s asset by categories (good-A, special-B, substandard-C, doubtful assets-D and losses-E), in millions of euro
Source: CBM database
b) Non-performing assets by categories (substandard-C, doubtful assets-D and losses-E), extracted from 1.9 a), in millions of euro
In the structure of liabilities, the largest share belongs to deposits and obligations under borrowing. However, their share in total liabilities significantly changed from 2004 to 2010.
0 100 200 300 400 500 600 700 800 900 1000 1100 1200 1300 1400 1500 1600 1700 1800 1900 2000 2100 2200 2300 2400 2500 2600 2700 2800 2900 3000 3100 3200 3300 2004 2005 2006 2007 2008 2009 2010 2011 2012
Losses E Doubtful assets D Substandard assets C Special assets B Good assets A
0 100,000 200,000 300,000 400,000 500,000 600,000 2004 2005 2006 2007 2008 2009 2010 2011 2012
16
The positive trend in the share of total deposits stopped in 2007. Since that period, total deposits declined by almost 20 percentage points. The global financial crisis and loss of confidence in the banking sector caused a massive withdrawal of deposits. In addition, according to the CBM Supervision Report (March 2009) a further reason for the large reduction in total deposits, has been the case of non-payment of loans where the banks were using deposits as cash collateral. That meant that the deposits had not been withdrawn from the banks, but had been used for the payment of liabilities to banks. A massive withdrawals of deposits has been has been compensated with an increase in borrowings and credits. Looking at the Figure below, there has been a significant drop in the share of capital in total assets.
Source: CBM database
Figure 1.10Structure of total liabilities in the period 2004-2012
The most significant share of total borrowings was borrowings from abroad. According to the banks reports to CBM, the rapid growth of loans was mainly based on borrowings from abroad. Most of the borrowings from abroad refer to the borrowing from foreign parent banks, whose subsidiaries dominate the Montenegrin banking sector (see Figure 1.11).
0% 10% 20% 30% 40% 50% 60% 70% 80% 90% 100% 2004 2005 2006 2007 2008 2009 2010 2011 2012
17
Source: CBM database
Figure 1.11 Banks’ borrowing from abroad, in millions of euro
Funding from parent banks (borrowings from parent banks as a share of total liabilities) increased from 2005, reaching the peak in 2008. Financing from parent banks constituted 76 per cent of total borrowings at end-2008, exposing the banking sector to liquidity shocks in the case where parent banks were unable to sustain financing to their subsidiaries. However, this share decreased by 20 per cent in 2009, by 5 per cent in 2010 and a further 23 per cent in 2011.
1.4.3 Liquidity
The negative effects of the global financial crisis were reflected in Montenegrin banks' liquidity. In the last quarter of 2008, there was a significant reduction in total banks` deposits. In particular, large withdrawals happened due to the panic instigated by the media and negative experiences from failed foreign currency savings from the early `90s. As noticed in the previous subsection 1.4.1, high rates of credit growth were mainly financed by foreign parent banks’ lending to their Montenegrin subsidiaries, resulting in high loan-to-deposit ratios. The high loan-to-deposit ratio (LTD) exposed the banking sector to substantial liquidity shocks.
Table 1.4 Loan to deposit ratio in Montenegro from 2004-2010 2004 2005 2006 2007 2008 2009 2010 Loan to deposit ratio 103 77 87 121 169 154 140 Source: CBM database 0 100,000 200,000 300,000 400,000 500,000 600,000 700,000 800,000 900,000 1,000,000 2005 2006 2007 2008 2009 2010 2011
18
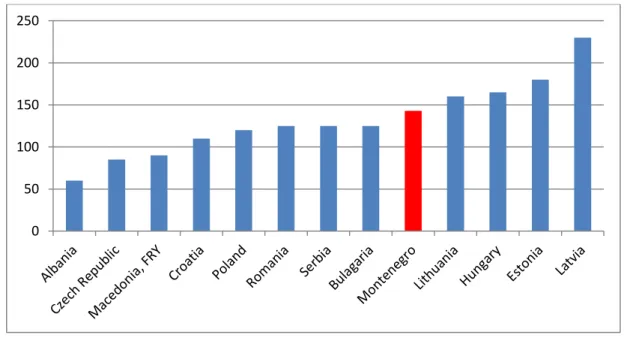
The LTD ratio that was increasing steeply until 2008, in 2009 it declined to 154 per cent, and then fell further to 140 per cent in 2010. However, those LTD ratios were extremely high. As illustrated in Figure 1.12, at the end of 2010 the LTD ratios in Montenegro were higher than in many Central and East European countries.
Source: IFS database
Figure 1.12 Loan to deposit ratio in CEE at the end of 2010
A large withdrawal of deposits severely subverted the liquidity of the banking sector in late 2008, although the situation has since improved. The system’s liquid assets to short term liabilities ratio declined in 2007 and 2008 (see Figure 1.13). It is most likely that banks with extreme credit growth rates were focused on future revenues. As explained in the previous section, the increase in the proportion of loans in banks’ total assets was, above all, the result of the declining share of cash, which therefore worsened the banks’ liquidity position. The liquidity ratio of liquid assets to short term liabilities declined from 32 per cent at the end of 2007 to 21 per cent at the end of 2008 (see Figure 1.13). Since then, liquidity at the aggregate level improved with a liquidity ratio of 26 per cent at the end of 2009, particularly because of CBM measures to improve liquidity in the system by lowering the reserve requirement rate, as well as due to large inflows as a result of privatization of one large state company. In 2010, the liquidity ratio improved further to about 33 per cent by year end.
0 50 100 150 200 250
19
Source: CBM database
Figure 1.13 Movements in the ratio of liquid assets to short-term and long-term liabilities
A further cause of the improvement in banking sector liquidity from 2009 was significant capital injections from the foreign parents’ banks that had signed an agreement called the Vienna Initiative. The goal of that agreement was to maintain the exposure of foreign parent banks in emerging Europe and to support their subsidiaries by capital injections, bank-specific guarantees etc. The Vienna Initiative will be analysed in more details in Chapter 3. The foreign parent banks gave strong support to their subsidiary entities in Montenegro and provided them with a sufficient amount of liquid assets for the regular servicing of obligations to clients, thereby preventing capital erosion. Five banks have received subordinated debts in 2008 to 2010, while, in 2009 a few banks have been recapitalized. As a result, the capital adequacy ratio (CAP) of the system stood at 15.4 per cent at end of 2010, well above the prudential minimum requirement of 10 per cent. Subsidiaries of foreign banks also had an opportunity to manage their NPLs through transferring them to the Asset
Management Companies (AMCs) of their parent banks.3Two Montenegrin banks have
chosen to permanently remove non-performing assets from their balance sheets by transferring them to factoring companies owned by their parent bank. Those factoring entities, therefore, were not subject to consolidation at the bank level. However, domestic banks have had to maintain their NPLs on their balance sheets. Moreover, increased
3
However, the transfer of NPLs into the Asset Management Companies (AMCs) of their parent banks does not affect our empirical analysis of NPLs presented in Chapter 5. Namely, those transfers had happened in 2011, while our empirical analysis includes developments from 2004 to 2010.
0.00% 10.00% 20.00% 30.00% 40.00% 50.00% 60.00% 70.00% 2004 2005 2006 2007 2008 2009 2010 2011
20
provisions for non-performing loans adversely affected the profitability of the bank, which will be discussed in the following sub-section.
1.4.4 Profitability
Profitability of the banking sector, after an upward trend from 2005 to 2007, was rapidly and drastically impaired in 2008. Analysing the profitability of the banking sector, we distinguish subjective and objective factors which had influence on the banks` profitability. Subjective weaknesses in some banks may refer at first to bad credit risk management which resulted in high levels of additional provisions being required (in accordance with the regulatory framework), high overhead costs, etc. Objective factors may be related to the prudential limits imposed on credit growth in 2008, withdrawal of deposit potential of the fourth quarter and almost complete suspension of the credit activity of banks that led to questions concerning the ability of some banks to service regularly their obligations to customers, more difficult access to external sources of funding, etc.
Source: CBM database
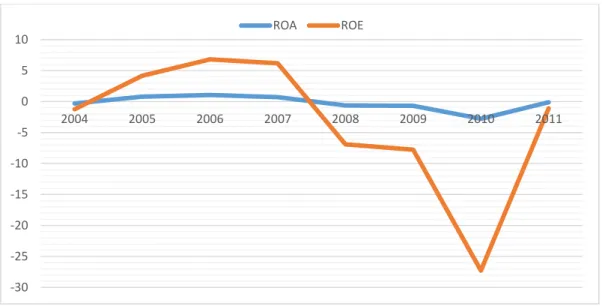
Figure 1.14 Movements of ROA and ROE at the aggregate level in the period from 2004 to 2011
These negative financial results consequently led to negative indicators of return on average assets (ROA) and return on average equity (ROE) at the aggregate level. As can be seen in
Figure 1.14, the ROA decreased from -0.6 per cent in 2008 to -0.7 per cent at end2009, to
-2.8 per cent at end-2010, and improved slightly to -0.1 per cent at end 2011. The ROE
declined from -6.9 per cent in 2008 to –7.8 per cent at end 2009, and declined dramatically in
-30 -25 -20 -15 -10 -5 0 5 10 2004 2005 2006 2007 2008 2009 2010 2011 ROA ROE
21
2010 reaching -27 per cent at end of 2010, whilst significantly improving to -1.1 per cent at the end of 2011.
1.4.5 Market Risk
The degree of exposure of banks to market risk primarily depends on the dominant activity of the bank. That has been an important component of risk for investment banks or in banks where a large part of the activities related to the trading book. The main drivers of market risk usually are the interest rates, exchange rates, stock indexes, etc. In modern developed financial systems it is assumed that the market quickly responds to various signals through variations in the prices of securities and thereby affects the value of the portfolio of banks (Furlong and Williams, 2006). However, in the Montenegrin banking system the overall level of market risk has been low. Trading securities, derivative financial assets and securities held to maturity have a negligible share of total banks assets (about 3 per cent in 2010). These have been new instruments for Montenegrin banks starting in 2009. After the introduction of the Euro as the official currency in Montenegro, the exposure to market risk in Montenegrin banks has been very limited, according to the CBM Financial Stability Report (2011b). In addition, the level of foreign exchange risk is low. The most common alternative currency either for loans and deposits throughout the period 2004-2012 was the USD; however from 2008 the banking sector had more liabilities than assets in the US currency (Figure 1.15).
Source: CBM database
Figure1.15 Aggregate exposure of foreign currency risk in Montenegro, in millions
-12000000 -10000000 -8000000 -6000000 -4000000 -2000000 0 2000000 4000000 2004 2005 2006 2007 2008 2009 2010 2011 2012
22
At the end of 2008 the currency structure of loans was: 5.8 per cent were related to loans in foreign currency. Deposits in foreign currency consisted 2.6 per cent of total deposits and banks borrowings in foreign currency accounted for 12.2 per cent of total borrowings.
Summing up the findings of this section, it has been found that the rapid expansion of the banking sector in Montenegro stopped in late 2008, largely due to the impact of the global financial crisis on the overheated domestic economy. This growth of banking sector assets in Montenegro was led by foreign banks. Foreign banks financed excessive credit growth that affected banks` liquidity position resulting in high loan to deposit ratios. Importantly, excessive credit growth posed a threat to the Montenegrin banking sector’s stability, bearing in mind that all sectors of the Montenegrin economy had a high level of debt. The weakened economy contributed to a rapid increase in non-performing loans. Finally, the crisis had a dramatic impact on banking sector profitability. The measures which the Central Bank of Montenegro introduced in order to protect the banking sector during the global financial crisis will be analysed in the following section.
1.5
The Role of the Central Bank of Montenegro
The Central Bank of Montenegro (CBM) was founded in 2001, based on the Law of the Central Bank of Montenegro which was adopted in 2000. Previously, it was a branch of the National Bank of Yugoslavia. Given the political circumstances and abuses of monetary policy in Yugoslavia, the Government of Montenegro in 1999 decided to replace the dinar (official currency of Yugoslavia) and to take over all powers in the field of monetary policy. Initially the Deutsche Mark was introduced as the official currency and later, in 2002, it was replaced by Euro. The Central Bank of Montenegro was founded as an independent institution responsible for monetary policy, establishing and maintaining a sound banking system and efficient payment system in Montenegro. Given that the monetary system of Montenegro has been based on the euro, as the official currency, and Montenegro's economy is fully euroised, the Central Bank Montenegro has no direct responsibility for issuing currency or price stability, which are the responsibilities of the ECB.
According to the Law on Central Bank, a primary objective of CBM is maintaining financial stability. The Central Bank of Montenegro is currently the only central bank that has identified financial stability as its primary objective. Other central banks have defined
23
financial stability as an objective, but only as a secondary one. However, it should be mentioned that CBM is only in charge of the banking sector and micro-financial institutions and it does not have a responsibility for other participants in the financial system, such as insurance companies, financial leasing companies, voluntary pension fund management companies etc. This issue has been partially overcome by the Financial Stability Council being chaired by the CBM Governor. The Financial Stability Council includes members of the Ministry of Finance, the Securities and Exchange Commission, the Insurance Supervision Agency and the Central Bank.
Although the Central Bank does not have the function of issuing currency, it has some instruments of monetary policy. The most important instrument is control of banks` reserve requirements. The reserve requirements for banks have an indirect impact on money supply (monetary policy). Given the lack of public confidence in the Montenegrin banking system at the beginning of the twenty-first century, the CBM initially conducted very restrictive obligatory reserve policies. However, as the situation in the banking system improved, this instrument was partly relaxed. According to the CBM (2012), this restrictive reserves policy preserved the banking sector in the crisis period. For example, only one bank had problems and that bank in 2008 requested financial assistance from the state, that loan was repaid in 2009, but underlying asset quality problems remained. The CBM has two further instruments affecting money supply. One instrument is loans to banks and the other open market operations - buying and selling of securities. For the purpose of meeting the liquidity requirements, the Central Bank can approve certain banks to use up to 50% of their reserve requirement deposits to maintain their required daily liquidity (Decision on Detailed Conditions for Granting Liquidity Loans to Banks; OGM, 15/11). Also the Central Bank could approve intra-day credit to meet liquidity requirements; under specified terms that whole amount of credit can be collateralized by securities issued by the State of Montenegro, EU Members States and international financial institutions or other securities deemed acceptable by the Central Bank (Decision on Bank Reserve Requirement to be Held With the Central Bank of Montenegro; OGM, 35/11). The other instrument is open market operations, which the CBM uses to purchase and sell securities in order to regulate the banking sector’s liquidity. Open market operations affect the interest rates, banks’ lending potential and activity, and consequently the economic activity in Montenegro. When buying securities the central bank creates a currency outflow and thus decreases the interest rate. The reverse
24
situation applies when selling securities. However, the CBM is not an issuing monetary authority and does not use open market operations to conduct traditional monetary policy. By open market operations CBM purchases and sells securities issued by Montenegro, EU Member States and international financial institutions, or other securities which are acceptable for this purpose. These operations may be performed through spot trading contracts or through direct trade with an individual bank using forward contracts (Decision on Open Market Operations, OGM 15/11).
The second objective of the CBM is to establish and maintain a sound banking system. As previously stated, the CBM is in charge of the supervision of all banks and micro financing institutions (currently 11 banks and 5 micro-financing institutions). Until 2008, the process of supervision was based on Basel I, since then there have been efforts to implement Basel II. The Basel II framework, which Kraft (2003) argued was a good example of the sustainable development of prudential ratios to meet constantly changing complex challenges, will be discussed in Chapter 4. Since 2008, with a view to maintaining banking sector stability and in order to meet Basel II requirements, the CBM has improved the regulatory framework. The CBM has adopted a new law on banks, with pertinent sub-legal legislation that has provided the legal framework for a gradual transition to Basel II, i.e. the Capital Requirement Directive (CRD). The adoption of the Law on Banks in 2008 and a set of by-laws in 2008 were largely compliant with EU directives and international standards. The CBM has implemented a prudent bank licensing policy and issuance of permissions and/or approvals to provide for the strengthening of corporate culture, competition and protection of depositors. In addition, the CBM has developed risk-based supervision with a portfolio management approach to banking supervision, with a particular emphasis on credit risk supervision. Finally, the CBM established cooperation and exchange of data with other regulatory bodies in the country with a view to strengthening consolidated supervision. Some requirements were even more stringent than the Basel II requirements. Namely, the minimum required solvency coefficient was set at 10 per cent, while according to the Basel II the minimum required amount should be 8 per cent.
To restore consumer confidence in the banking sector, the CBM adopted an emergency anti-crisis law in October 2008: the Law on Measures for Protection of the Banking System (MPBS). The provisions of this law were generally consistent with crisis responses seen in other countries, giving the government the authority to: (i) fully guarantee the deposits of all