P
olicy
R
eseaRch
W
oRking
P
aPeR
4457
Who Are the Net Food Importing
Countries?
Francis Ng
M. Ataman Aksoy
The World Bank
Development Research Group
Trade Team
January 2008
WPS44457
Public Disclosure Authorized
Public Disclosure Authorized
Public Disclosure Authorized
Abstract
The Policy Research Working Paper Series disseminates the findings of work in progress to encourage the exchange of ideas about development issues. An objective of the series is to get the findings out quickly, even if the presentations are less than fully polished. The papers carry the names of the authors and should be cited accordingly. The findings, interpretations, and conclusions expressed in this paper are entirely those of the authors. They do not necessarily represent the views of the International Bank for Reconstruction and Development/World Bank and its affiliated organizations, or those of the Executive Directors of the World Bank or the governments they represent.
P
olicyR
eseaRchW
oRkingP
aPeR4457
The purpose of this paper is to update the information
on net food importing countries, using different
definitions of food, separating countries by their level of
income, whether they are in conflict and whether they
are significant oil exporters. The study also estimates
the changes in net food importing status of these
countries over the last two and a half decades, and, most
important, the study measures the relative importance
of these net food imports in the import basket of the
countries. Our results show that while many low-income
countries are net food importers, the importance and
potential impact of the net food importing status has
been highly exaggerated. Many low-income countries
that have larger food deficits are either oil exporters or
countries in conflict. Food deficits of most low-income
This paper—a product of the Trade Team, Development Research Group—is part of a larger effort in the department to
explore the links between Poverty, Trade, and Agricultural Policies. Policy Research Working Papers are also posted on the
Web at http://econ.worldbank.org. The author may be contacted at [email protected].
countries are not that significant as a percentage of their
imports. Our results also show that only 6 low-income
countries have food deficits that are more than 10 percent
of their imports. Last two decades have seen a significant
improvement in the food trade balances of low-income
developing countries. SSA low-income countries are
an exception to this trend. On the other hand, there
are a group of countries which are experiencing civil
conflicts which are large importers of food, and these
countries can not meet their basic needs. They also need
special assistance in the distribution of food within their
boundaries. Therefore, one should modify the WTO
Ministerial Declaration, and focus on these conflict
countries rather than the broad net food importers.
Who Are the Net Food Importing Countries?
Francis Ng and M. Ataman Aksoy
1
JEL classification: F10, F13, Q17, Q18
Keywords: Agriculture, food policy, net food importing countries
1
Development Economics Research Group of the World Bank. Email correspondence to:
and
. The authors would like to thank J. Baffes, D. Mitchell, M. Olarreaga for their
helpful comments. The findings, interpretations, and conclusions expressed herein are those of the authors and
do not necessarily reflect the views of the World Bank and its affiliated organizations.
I. Introduction
The linkage between trade policy reforms and food security is of vital concern to many
developing countries. Ensuring food for all also poses enormous economic, political and
technological challenges. Many studies summarize the results designed to show how trade
and associated economic policy reforms have affected the agriculture sector and food supply
of farmers in a range of developing countries. The approach taken is to observe the actual
performance of those countries that have undergone policy reform in the past years and to
search for explanatory factors or, more often, to project the presumed consequences of
reforms through models of economic behavior (McCalla and Nash, 2007; Hertel et al, 2007;
Anderson and Martin, 2006, Thomas, 2006; Ingco and Nash, 2004). Precisely how
developing countries and the poor will be impacted by trade liberalization in agriculture
under the Doha Round is a complex issue. The presumption is that the liberalization will
broadly benefit the poor countries by removal of agricultural subsidies in the rich countries
(FAO, 2002).
In addition, one of the reservations against global agricultural reform has been the
prediction that food prices would increase as a result of these reforms and that would harm
low-income countries, many of which are net food importers. Food products receive
significant support either through tariffs or direct subsidies compared to other commodities.
This support is very high in industrial and some middle-income countries (Aksoy, 2005).
Tropical export commodities (such as coffee, tea etc.) receive almost no support and face
lower tariffs. Elimination of global subsidies and protection could lead to supply reductions
and price increases mostly for foodstuffs.
2This problem was acknowledged during the Uruguay Round Negotiations leading to a
ministerial decision that special measures should be taken to minimize the negative effects of
global reforms on food importing developing countries and Least Developed Countries. This
Ministerial Decision recognizes that “while the progressive implementation of the results of
the Uruguay Round as a whole will general increasing opportunities for trade expansion and
economic growth to the benefit of all Members, during the reform program least-developed
countries and net food-importing developing countries may experience negative effects in
terms of the availability of adequate supplies of basic foodstuffs from external sources on
reasonable terms and conditions, including short-term difficulties in financing normal levels
of commercial imports of basic foodstuffs” (WTO, 1994). In the same vein, an FAO report
on Trade Liberalization and Food Security points out that the majority of low-income
countries, especially Least Developed Countries, are net food importers. This point has been
highlighted again by Panagriya (2006), who argues that global reforms would hurt these poor
countries, especially the low-income countries in Sub-Saharan Africa (SSA) as well as the
poor rural households in the poorest countries.
2
For example, Aksoy and Beghin (2005) using multiple sources show that rice prices would increase by an
average of 33 percent with some varieties almost doubling in price. In other food items such as sugar, dairy, and
wheat, price estimates show increases of 40, 20-40, and 5 –10 percent respectively. Econometric and other
modeling exercises which use general equilibrium frameworks find slightly lower but still significant price
increases, especially for the foodstuffs.
Evidence for these conclusions relies primarily on the analysis undertaken by Valdes and
McCalla (1999). These authors show that the majority of developing countries are net food
importers. But they also show that developing countries are heterogeneous in terms of their
food and agricultural trade status. “While two thirds (105) of the 148 developing countries
are net food importers, two fifths are net agricultural exporters, including 33 low-income
countries. It also shows that at least 28 of the low-income food deficit countries are in fact
net agricultural exporters.”
3Only the evidence on the number of food importing countries
has been used in these discussions, despite the qualifiers in the original study.
In this debate, we are not trying to estimate the impact of food price changes, or model
the response of different groups of countries to these price changes. Our objective is more
limited. It is to present the evidence on the magnitude of food and agricultural trade for
different groups of countries to supply the basic information for the debates and discussions.
More precisely, the purpose of this paper is to update the information on net food
importing countries, using different definitions of food, separating countries by their level of
income, whether they are in conflict,
4or whether they are oil exporters.
5In addition, the
study estimates the changes in net food importing status of these countries over the last two
and a half decades, and, most important, the study measures the relative importance of these
net food imports in the import basket of the countries. We also present separate tables for
Least Developed and Sub-Saharan countries in the text and the annexes. Annex tables present
individual country information so that the readers can create their own classifications.
Our results show that while many low-income countries are net food importers, the
importance and potential impact of the net food importing status has been highly
exaggerated. Many low-income countries that have larger food deficits are either oil
exporters or countries in conflict. The remaining low-income countries, as a group, have a
trade surplus in food. If trade balances are measured using broad agriculture, rather than just
the narrowly defined food, then low-income countries, and the low-income countries in SSA,
have a large agricultural trade surplus. Last two decades have seen a significant improvement
in the food trade balances of low-income developing countries. SSA low-income countries
are an exception to this trend.
Food deficits of most low-income countries are not that significant as a percentage of
their imports. Our results also show that only 6 low-income countries have food deficits
(food defined narrowly) that are more than 10 percent of their imports. Of these 6, 1 is a large
oil exporter, 2 are in conflict, and only 3 – Benin, Guinea-Bissau, and Senegal – are in this
category. These three countries export other agricultural products. Benin exports cotton,
Guinea-Bissau has a large trade surplus in nuts, and Senegal exports peanut oil. Of these
three, only Senegal has an agricultural trade deficit.
On the other hand, there are a group of countries which are experiencing civil conflicts
which are large importers of food, and can not easily adjust their production and meet their
3
McCalla, 2001, p.171.
4
Countries in conflict have needs that are independent of their net trading status and need to be treated
differently.
5
We picked oil as an extreme case of dependence on mineral exports. One could use other definitions or
classifications.
basic needs. They also need special assistance in the distribution of food within their
boundaries. Therefore, one should modify the WTO Ministerial Declaration, and focus on
these conflict countries. We must accordingly agree to establish appropriate mechanism to
ensure that the implementation of the Doha Round Negotiations on trade liberalization in
agriculture does not adversely affect the availability of food aid at a level which is sufficient
to continue to provide assistance in meeting the food needs of conflict countries, especially
those that are also poor.
II. Data and Definitions
We have used two definitions of food in this paper.
The first category is termed “raw
food” that includes meats and dairy, grains, and fruits and vegetables. The second category is
raw food plus what we term “cash crops and feeds” which are tropical foodstuffs, i.e. coffee,
tea, cocoa, spices, nuts, and feeds, and agricultural raw materials such as cotton etc.
6This
category is called “all agriculture” throughout the paper. Detailed SITC classification of
different food groups is given in Appendix Table 1.
7In most of the earlier work, focus has been on major staples, especially grains as the
primary group representing food. Part of the reason is that support to agriculture in industrial
countries is concentrated in grains, meats, and dairy products. Furthermore the debates on
protection and trade policy are carried out usually on individual staples such as rice or maize.
Other food items, such as fruits and vegetables, which now constitute the largest part of
developing country exports, are usually assumed not to be supported to the same extent as
other food categories. Therefore, their prices are not expected to change as much with global
reforms.
8However, these are also products that are highly substitutable with the “raw”
foods.
Very narrow definitions of food are questioned even in the original work by Valdes and
McCalla (1999). There are substitution possibilities within the agricultural commodities and
farmers who produce tropical products or agricultural raw materials could shift into farming
food crops if relative prices change sufficiently. That is the reason for presenting the trade in
raw foods and “all agriculture” separately to show the possibilities for substitution within
agriculture. Therefore, alternative definitions and categories of food are also to illustrate in
which categories food deficits take place. This data presented in the Annex Tables, and will
help in understanding the contribution of different commodity groups to the overall food
deficits and surpluses.
6
There is a third category of agriculture related products such as processed foods and seafood, called “other
food”. We also present trade flows in these product groups in annex table 6 but do not include them in the main
discussions in the text.
7
There are problems even with this classification. In excluding processed foods, we have excluded items such
as refined sugars, peanut oil, cocoa oil and paste, etc. Depending on in which form the products are exported
makes a big difference in estimating net trade balance. For example, Senegal exports peanut oil which is in the
category of processed foods and are not included in the agriculture trade balance.
8
Diop and Jaffee (2005) question this assumption and show that there are significant protection for fruits and
vegetables especially in the EU. There are numerous other cases of support and protection for individual fruits
and vegetables in other countries. Thus, one can expect some price changes in fruits and vegetables as a result
of global trade reforms.
The second point is to separate countries not just by income and region, as has been done
previously, but to add a few more subgroups. Major food importing developing countries are
either oil exporters, or higher-income semi-industrialized countries.
In addition to the oil exporters, there are countries that have serious internal conflicts
which hinder their production of food. While these countries are vulnerable to higher food
prices, solutions to their problems lie beyond the reforms in global trade regimes. Their food
requirements and its distribution within these conflict areas need to be taken care of using
other mechanisms. These countries should not be confused with “other or normal”
developing countries. Thus, two other subcategories were added to the developing countries
classification; oil exporters, and countries in conflict.
9There is also another large group of countries that are small island states. They usually
sell services and import most of their needs, including some food. Although their numbers
are large, their trade is very small, along with their populations.
Net imports over time were also estimated to observe how the net food balance has
evolved for these groups of countries. To minimize yearly fluctuations, two-year averages for
the years 1980/81, 1990/91, 2000/01 and 2004/05 are used.
10Earlier data is presented
primarily for information and the discussions in the text are based on the net trade values for
2004/05.
To measure the relative importance of the food imports for these economies, we have
estimated the share of these net imports in their total imports. Merchandise imports are used
to measure of the potential impact of food price changes rather than merchandise exports,
because many countries export services and labor that is not captured in merchandise exports
data. Imports give a more accurate measure of the import capacity of these countries in terms
of the effects of a food price change. While many countries might have net imports of food,
the important issue whether these imports are large enough to have a significant impact on
the balance of payments of these countries.
The data on Least Developed Countries (LDCs) are presented separately in annex tables
9 and 10. The reason is because the WTO discussions have treated LDCs as a separate group
of countries, separate from other low-income countries. However, the discussions in the text
are carried out primarily in terms of low-income countries rather than LDCs.
We have analyzed the case of Sub-Saharan Africa separately, because the continent has
significant net food imports and the food deficits of SSA has been used in many arguments
against global reforms. It is also an agricultural region that has significant trade surplus in all
agriculture.
9
Oil exporters have been defined as countries where oil constitutes more than 40 percent of their exports
between 2000 and 2005. Similarly, conflict countries are defined as the countries that were in serious conflicts
in 2004/2005, which made it difficult for them to have “normal” food production. Annex table 2 shows the
countries in each group.
10
D. Mitchell has pointed out that by picking the beginning years of each decade, we might have picked the
years where food prices were low. Our judgment was to pick the decadal points and the data starts in this form
in 1980. Years, 2004/05 on which the discussion in this paper are based, are the years where the food price
levels are close to their average over the period in question.
Finally, trade data base has some gaps, especially in measuring intra developing country
trade. If the trade flows are with other developing, especially with low-income countries,
trade statistics tend to underestimate them. For this study, we did not use individual country
information other than what is available in the international trade database.
III. Net Food Status: Food Narrowly Defined
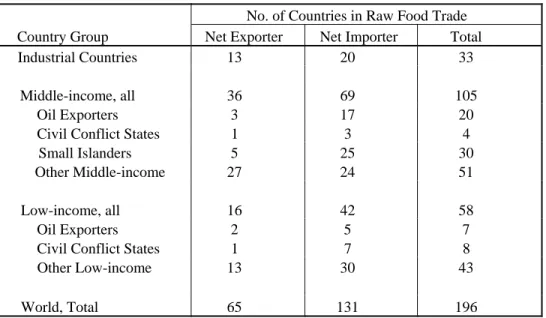
Table 1 shows the distribution of the countries in terms of their income status and their
net food balance for the “raw food” definition. For the years 2004/2005, there were 196
countries in the database with imports and exports of raw food items.
11Table 1: Country Classifications by Raw Food Trade (2004/05)
No. of Countries in Raw Food Trade
Country Group
Net Exporter
Net Importer Total
Industrial Countries
13
20
33
Middle-income, all
36
69
105
Oil Exporters
3
17
20
Civil Conflict States
1
3
4
Small Islanders
5
25
30
Other Middle-income
27
24
51
Low-income, all
16
42
58
Oil Exporters
2
5
7
Civil Conflict States
1
7
8
Other Low-income
13
30
43
World, Total
65
131
196
Notes: Food is defined as raw food in SITC Revision 2, excluding all cash crops,
processed food and seafood (see detailed classifications in Appendix Table 1).
The classification of country groups is provided in Appendix Tables 2 and 3.
Source: Based on partner data from UN COMTRADE Statistics.
As expected, most of the countries in the world are net food importers, i.e. 131 out of
196. This ratio is consistent with any other product group where the exporters tend to be
more specialized than the importers. 69 middle-income countries out of 105 and 42 out of 58
low-income countries are net food importers.
In terms of percentages, 39 percent of industrial countries, 34 percent of middle-income
countries, and 28 percent of low-income countries are net food exporters. If we exclude oil
exporters, countries in conflict, and island states, these ratios increase to almost 51 percent
11
There are some islands and territories that belong to industrial countries such as US or British Virgin Islands
etc. We have excluded these countries.
for the middle-income countries but only to 30 percent for low-income countries. Thus, a
“normal” middle-income country is much more likely to be net food exporter when
compared to a “normal” low-income country.
Of the 42 low-income countries that are net food importers, 5 are oil exporters and 7 are
conflict countries. Excluding these, 30 low-income countries are net food importers.
Table 2 shows the net exports of raw food, defined as meats and dairy products, grains
and cereals, and fruits and vegetables, and the ratio of net export balances to their total
imports for the selected 4 two-year periods for the groups defined in Table 1. Annex tables 1
and 2 show imports, exports, food trade balances, for individual countries, and for more
detailed product groups.
Table 2: Trade Balance for Raw Food by Income Group Country
Net Exports/Imports ($ million)
Net Exports as % of All Goods Imports
Country Group (No. of Country)
1980/81 1990/91 2000/01 2004/05 1980/81 1990/91 2000/01 2004/05
World (196)
-8,821
1,828
8,042
3,975 -0.6 0.1 0.1 0.0
Industrial Countries (33)
8,838 7,624
11,809 3,752
0.8 0.3 0.3 0.1
Middle-income, All (105)
-14,052
-4,802
-983
4,205
-3.4
-0.6
-0.1
0.1
Mid Income--Oil Exporters (20)
-4,686
-4,320
-7,163
-11,234
-4.4
-4.5
-3.6
-2.8
Mid Income--Civil Conflict (4)
-51
-123
-686
-793
-0.4
-0.7
-4.2
-3.0
Small
Island
Economies
(30)
-179 -147 -274 -462 -2.9 -1.6 -1.5 -1.8
Other Middle-income (51)
-9,135
-213
7,140
16,693 -3.1 0.0 0.5 0.7
Low-income, All (58)
-1,122
-393
13
-582
-2.0
-0.6
0.0
-0.2
Low-income--Oil Exporters (7)
-679
-320
-898
-1,634
-3.4
-2.8
-4.8
-4.6
Low-income--Civil Conflict (8)
-115
-162
-298
-437
-2.2
-2.5
-4.0
-4.0
Other Low-income (43)
-329
88
1,209
1,489
-1.1
0.2
1.1
0.7
Notes: Food is defined as raw food in SITC Revision 2, excluding all cash crops, processed food and seafood
(see detailed classifications in Appendix Table 1).
The classification of country groups is provided in Appendix Tables 2 and 3.
Source: Based on partner data from UN COMTRADE Statistics.
Few points are stand out in table 2. First, overall, industrial, and middle-income
countries, as a group, are net food exporters. Their surpluses, however, as a percentage of
their imports are small. For middle-income countries, the group average masks large net
imports by oil exporters, and large net exports of the other middle-income country group.
Countries in conflict have a deficit in food account but this is only about $800 million.
Similarly, small island economies group contain a lot of countries that have food deficits, but
their deficit is only about $500 million and constitutes only 1.8 percent of their imports.
Other middle-income countries, that are excluding the oil exporters, countries in
conflict, and small island economies, have a large export surplus. This surplus is caused
primarily by net exports of fruits and vegetables with deficits in meats and dairy, and grains.
This group is highly heterogonous within itself. The largest five net importers in this group
are Korea, Hong Kong, Taiwan, Singapore, and Malaysia. These are hardly the countries that
will be significantly affected by food price changes. Finally, middle-income countries have
switched from being a large net importer in 1980/81 to a marginal net exporter in 2004/05.
This change has been driven by non-oil and non-conflict middle-income countries whose
food exports have increased much more rapidly than their food imports.
Low-income countries, on the other hand, have small food trade deficit, which is only
0.2 percent of their imports. The reason for the net food importer status of low-income
countries is the large food imports by the oil exporting and conflict countries. Low-income
countries which are not oil exporting and are not in conflict are net food exporters, even with
the narrow food definition. Within the components of raw food, they have a balance in meats,
very small surplus in grains, and a bigger surplus in fruits and vegetables. Thus, food price
increases, would, on average, improve the trade situation of the low-income countries.
Just like the middle-income countries, low-income countries have seen their food trade
balance improve over the last few decades. Their food trade has shifted from a deficit of 2.0
percent of their imports in 1980/81 to a small deficit of 0.2 percent of their imports in
2004/05. Non oil and non conflict low-income countries (other low-income) have also moved
into a small surplus in 2004/05.
A positive trade balance does not mean that all developing countries would gain from
global agricultural reforms. Furthermore, lump sum transfer mechanisms that would tax the
gainers and compensate the losers from global reforms or food price increases are not
available. On the other hand, for most net importing countries, the impact might be so small
as to be easily manageable.
In this section, we will focus on low-income countries that have significant agricultural
deficits. The definition of significant is subjective but for the purposes of this study, two
cut-off points will be used. The first cut-cut-off point is countries whose net food (or agriculture)
imports constitute more than 5 percent of their total imports. The second cut-off point is
countries whose net food imports constitute more than 10 percent of their total imports.
Countries that have net food or agricultural imports of more than 5 or 10 percent of their total
imports will be considered as potentially vulnerable. 5 percent cut-off means that a 20
percent increase in food prices will have an impact equivalent to about 1 percent of their
imports, while a 10 percent cut-off point would have an impact of about 2 percent of their
imports. Shocks of these magnitudes should be easily manageable.
12There are 20 low-income countries whose raw food trade balance exceeds 5 percent of
their total imports. Of these 3 are oil exporters, and 4 are countries in conflict. Excluding
those, there are 13 low-income countries with large food deficits and 9 of the 13 are in SSA.
When the cut-off point is increased to 10 percent, only 6 low-income countries turn out
to be vulnerable. Of these, Yemen Republic is an oil exporter, Eritrea and Haiti are in
conflict, leaving only three vulnerable low-income countries. These are Benin,
Guinea-Bissau, and Senegal. Of these countries, Benin is a cotton exporter and when all agricultural
trade is taken into account, the country is almost self sufficient. Guinea-Bissau is an exporter
12
We should point out that these price changes are much less than the food price volatility observed in global or
domestic markets (Mitchell and Hoppe, 2006).
of nuts and when they are included, it has a significant agricultural trade surplus (almost 44
percent of its imports). Senegal is a special case where its major agricultural exports are
peanut oil, which is included in the category of processed foods and thus not included in both
raw food and all agriculture definitions. Thus, if real vulnerability is the main reason for the
concern about net food importers, even with a very narrow definition of food, very few
countries would be seriously affected by a significant food price increase.
13When food trade balances of LDCs are analyzed, the results are similar to the results of
low-income countries. Only 8 of the 50 LDCs have a raw food surplus, but 23 of them have
an agricultural trade surplus. In terms of vulnerability, using the 10 percent cut-off point,
only 8 of the 50 LDCs are vulnerable. Of these 8, 1 is an oil exporter, two are in conflict, 2
are small island states; leaving only three low-income countries listed above that can be
termed as “vulnerable”.
IV. Net Food Status: All Agriculture
Using a limited number of products in the measurement of food trade balance, and using
this balance to infer about the potential impact of price changes assumes that the countries
can not switch production from one group of agricultural commodities to another if relative
prices change significantly. While the substitution might not be perfect and not every product
can be efficiently and economically substituted, in most cases farmers can substitute across a
wide range of agricultural products. It might, therefore, be important to measure the
agricultural capacity of these countries by measuring their overall agricultural exports and
imports.
14Table 3: Country Classifications by All Agricultural Trade
No. of Countries in All Agricultural Trade
Country Group
Net Exporter
Net Importer Total
Industrial Countries
16
17
33
Middle-income, all
41
64
105
Oil Exporters
5
15
20
Civil Conflict States
0
4
4
Small Islanders
8
22
30
Other Middle-income
28
23
51
Low-income, all
34
24
58
Oil Exporters
4
3
7
Civil Conflict States
2
6
8
Other Low-income
28
15
43
World, Total
91
105
196
Notes: All agriculture is defined as all raw food, cash crops and agric raw materials
in SITC Revision 2, excluding processed food and seafood products
13
If we add the small island economies to the list, only two of them have raw food imports that are more than
10 percent of their imports. These are Comoros and Kiribati, whose food imports are only US$24 million.
14
(see detailed classifications in Appendix Table 1).
The classification of country groups is provided in Appendix Tables 2 and 3.
Source: Based on partner data from UN COMTRADE Statistics.
Table 3 shows the agricultural trade status of the same group of countries.
15As
expected, addition of the non raw food agricultural commodities changes the picture
significantly. With the raw food definition only 52 developing countries were net food
exporters. With the broader definition, 75 developing countries are net agricultural exporters.
Changes are minimal within the middle-income countries. Excluding the oil, island and
conflict countries, number of middle-income countries that are net agricultural exporters only
increase from 27 to 28.
The change in low-income countries, however, is very significant. Only 16 of the 58
countries were net exporters with a narrow definition of food. With the broader definition of
all agriculture, 34, or more than half the low-income countries become net agricultural
exporters. If the oil exporters and conflict countries are excluded, then 28 of 43 low-income
countries are net exporters of agricultural commodities. Thus, even in terms of numbers,
most of low-income countries are net agricultural exporters, and would benefit from an
increase in agricultural prices.
Table 4: Trade Balance for All Agriculture by Income Group Country
Net Exports/Imports ($ million)
Net Exports as % of All Goods Imports
Country Group (No. of Country)
1980/81
1990/91
2000/01
2004/05
1980/81
1990/91
2000/01 2004/05
World (196)
8,385
24,946
32,743
28,974 0.5 0.8 0.5
0.3
Industrial Countries (33)
3,534 6,127
13,600 2,141
0.3 0.3 0.3
0.0
Middle-income, All (105)
7,319
15,663
13,091
20,098 2.0 2.2 0.8
0.7
Mid Income--Oil Exporters (20)
-6,079
-5,120
-5,436
-8,595 -5.7 -5.3 -2.7
-2.2
Mid Income--Civil Conflict (4)
413
65
-422
-660
12.1
1.7
-2.6
-2.5
Small Island Economies (30)
110
52
-134
-262
1.8
0.6
-0.7
-1.0
Other Middle-income (51)
12,875 20,665 19,083 29,616
5.2 3.5 1.3
1.2
Low-income, All (58)
7,728
8,656
9,994
11,737 13.7 13.5 7.5 4.8
Low-income--Oil Exporters
(7) 809
1,024 424 209 4.1 8.8 2.3
0.6
Low-income--Civil Conflict (8)
604
315
-71
-190
10.8
4.7
-0.9
-1.7
Other Low-income (43)
6,315
7,317
9,642
11,718 20.5 16.0 9.1 5.9
Notes: All agriculture is defined as all raw food, cash crops and agricultural raw materials in SITC Revision 2,
excluding processed food and seafood products (see detailed classifications in Appendix Table 1).
The classification of country groups is provided in Appendix Tables 2 and 3.
Source: Based on partner data from UN COMTRADE Statistics.
15
We should point out that many countries move from being a net importer of food to an exporter of
agricultural commodities and vice versa. For example, among large countries, Indonesia moves from a food
deficit to an agricultural surplus country, while China has a large trade surplus in raw food but has a trade
deficit in all agriculture.
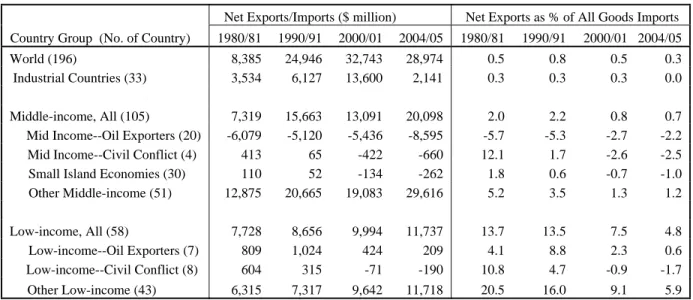
Table 4 shows the trade balances of the same groups of countries for broad agricultural
trade. Net trade balances do not change significantly with the broad agriculture definition for
industrial and middle-income countries. Deficits of middle-income oil, conflict, and island
countries decline slightly and the surplus of other middle-income countries increase to almost
1.2 percent of their imports; up from 0.7 percent with the narrow food definition.
The most dramatic change is in low-income countries. Their agricultural surplus is now
more than $10 billion in 2004/05 and is equivalent 4.8 percent of their imports. With the
broader agriculture definition, low-income oil exporters are now small net exporters of
agricultural products, and conflict countries have lower net imports. Other low-income
countries now have an agricultural trade surplus which is equivalent to 5.9 percent of their
imports. Thus, the low-income countries, as a group, are significant agricultural exporters,
and if they marginally substitute production of raw food products for other agricultural
products, they could gain from global trade reforms.
As pointed out above, using a narrow definition of food to measure the potential impact
of global price changes assumes that there is no substitution among agricultural products. If
broader agricultural rather than food balance is used, then the picture changes considerably.
Again excluding the countries in conflict and oil exporters, 9 out of the 13 large food deficit
countries now have either agricultural surpluses or smaller deficits than 5 percent, and 2
countries that had small food deficit now end up having a larger agriculture deficit.
16It turns out that there are only 6 low-income countries that have an agricultural trade
deficit that is more than 5 percent of their imports. These are Bangladesh, Democratic
Republic of Korea, Mauritania, Nepal, Niger, and Senegal. If the low-income oil exporters
and conflict countries are included, then low-income countries with net agricultural deficits
of more than 5 percent of their imports, increases to 10. In addition to the above 6 countries,
Yemen, East Timor, Eritrea, and Haiti, get included in the vulnerable list.
17Among the middle-income countries, only four have agricultural deficits that exceed 5
percent. These are Egypt, Albania, Jordan, and Georgia. There are also 8 island states which
could be vulnerable, and these are Tuvalu, Samoa, Palau, Micronesia, Maldives, Kiribati,
Cook Islands, and Cape Verde. However, in 2004/2005 their combined agricultural deficit
was US$131 million.
If the cut-off point is increased to net agricultural imports constituting more than 10
percent of total imports, number of vulnerable countries decreases significantly. Only one
middle-income country now is vulnerable and that country is Algeria, a major oil exporter.
There are 4 small island states in this category. These are Cook Islands, Kiribati, Micronesia,
and Samoa, which have a combined agricultural trade deficit of US$ 45 million.
There are only 5 low-income countries that have an agricultural trade deficit of more than
10 percent of their imports. These are, Democratic Republic of Korea, Senegal, Yemen,
16
These two countries are Nepal and Niger.
17
Other cut-off points can be used, along with more detailed tradeoffs between different agricultural product
groups. Individual country information is presented in the annexes so the readers can make their own
calculations.
Eritrea, and Haiti. If we exclude oil exporters, and countries in conflict, only Korea and
Senegal turn out to be vulnerable countries.
Thus, while the figures of food deficit countries look significant, when looked at closely,
many have special reasons for deficits, such as having a conflict or exporting a valuable
commodity such as oil. Others have deficits, but these deficits are too small for the potential
price increases to have a significant impact on their trade balances. These findings suggest
that the debate on food vulnerable countries is not very important, and should not be taken
very seriously.
V. Sub-Saharan Africa: A Special Case?
In most of the discussions, it has been argued that Sub-Saharan Africa has many
countries that are significant net food importers and global trade reforms will particularly
hurt the continent. In this section we repeat the same exercise we undertook for all countries
for the SSA countries.
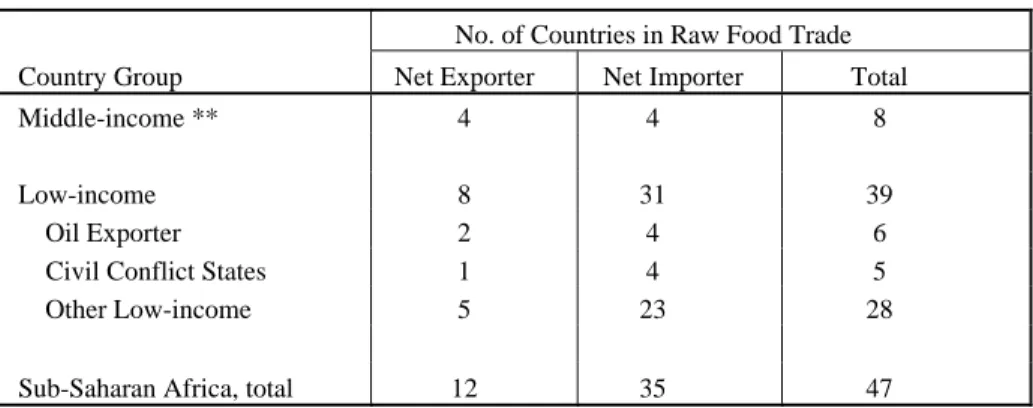
It is clear from table 5 why SSA has been treated as special. Only 12 of the 47 SSA
countries are net exporters of raw food. Even if conflict and oil exporting countries are
excluded, only 5 of the 28 low-income African countries are net food exporters. The rest are
net food importers. These ratios are much lower than other low-income countries shown in
table 1.
Table 5: African Country Classifications by Raw Food Trade
No. of Countries in Raw Food Trade
Country Group
Net Exporter
Net Importer Total
Middle-income **
4
4
8
Low-income
8
31
39
Oil Exporter
2
4
6
Civil Conflict States
1
4
5
Other Low-income
5
23
28
Sub-Saharan Africa, total
12
35
47
Notes: Food is defined as raw food in SITC Revision 2, excluding all cash crops,
processed food and seafood (see detailed classifications in Appendix Table 1).
The classification of country groups is provided in Appendix Table 4.
** Gabon is also in oil exporter, we added it to the middle-income group,
not to create another group for just one country.
Going beyond the number of countries and looking at the overall trade balances for
groups of countries, Sub-Saharan Africa, as a group, has a trade deficit in raw foods which is
slightly more than 1 percent of their imports. Middle-income SSA is food surplus but
low-income SSA is a net food importer.
Unlike other low-income countries, being oil exporter or having civil conflict does not
make that much different in net food imports of low-income SSA countries as a percentage
of their imports. All three groups have deficits of about 3 percent of their imports.
Table 6: African Trade Balance for Raw Food by Income Group Country
Net Exports/Imports ($ million)
Net Exports as % of All Goods Imports
Country Group (No. of Country)
1980/81
1990/91
2000/01
2004/05
1980/81
1990/91
2000/01
2004/05
Sub-Saharan Africa, All (47)
-137
231
14
-1,329
-0.3
0.5
0.0
-1.1
SSA Middle-income (8)
733 737
1,109
1,257 5.0 4.9 3.9 2.5
SSA Low-income (39)
-869
-506
-1,094
-2,586
-2.5
-1.7
-2.4
-3.4
SSA Oil Exporters (6)
-566
-210
-682
-1,333
-2.9
-1.9
-4.0
-4.0
SSA Civil Conflict States (5) -35
-62
-60
-178
-0.7
-1.1
-1.0
-2.5
Other SSA Low-income (28)
-269
-234
-353
-1,074
-2.4
-1.8
-1.5
-3.0
Notes: Food is defined as raw food in SITC Revision 2, excluding all cash crops, processed food and seafood
(see detailed classifications in Appendix Table 1).
The classification of country groups is provided in Appendix Table 4.
** Gabon is also in oil exporters, we added it to the middle-income group, not to create another group for
just one country.
Source: Based on partner data from UN COMTRADE Statistics.
The picture shown above does not however mean that SSA would definitely lose under
global reforms. The continent is a significant agricultural exporter that tends to export other
agricultural products and import primarily grains. Table 7 shows the number of SSA
countries that are net exporters of agricultural commodities.
Table 7: African Country Classifications by All Agricultural Trade
No. of Countries in All Agricultural Trade
Country Group
Net Exporter
Net Importer Total
Middle-income **
6
2
8
Low-income
26
13
39
Oil Exporter
4
2
6
Civil Conflict States
2
3
5
Other Low-income
20
8
28
Sub-Saharan Africa, total
32
15
47
Notes: All agriculture is defined as all raw food, cash crops and agric raw materials
in SITC Revision 2, excluding processed food and seafood products
(see detailed classifications in Appendix Table 1).
The classification of country groups is provided in Appendix Table 4.
** Gabon is also in oil exporters, we added it to the middle-income group,
not to create another group for just one country.
Source: Based on partner data from UN COMTRADE Statistics.
Looking at net agricultural exporters and importers, rather than net raw food exporters
changes the picture completely (Table 8). 32 out of 47 SSA countries are net agricultural
exporters; and if the oil and conflict countries are excluded, than 20 out of 28 low-income
SSA countries are net agricultural exporters.
In terms of trade balance, SSA countries have a massive export surplus in agricultural
commodities which constitutes almost 9 percent of their imports. Unlike other low-income
countries, raw food trade deficits have not decreased, but have increased over the last 25
years.
Unlike other low-income countries globally, in SSA, even the oil exporters and countries
in conflict have agricultural surpluses. All groups of countries have agricultural trade
surpluses. Other SSA low-income countries, that is excluding oil exporting and conflict
countries, have a massive export surplus which is equal to almost 20 percent of their imports.
Thus for most SSA countries, small changes in their agricultural production mix will
generate enough food for their citizens and can turn most of them into net raw food
exporters.
Table 8: African Trade Balance for All Agriculture by Income Group Country
Net Exports/Imports ($ million)
Net Exports as % of All Goods Imports
Country Group (No. of Country)
1980/81
1990/91
2000/01
2004/05
1980/81
1990/91
2000/01
2004/05
Sub-Saharan Africa, All (47)
8,485 8,367 9,612
11,314 16.8 18.2 12.8
9.0
SSA Middle-income (8)
2,082 2,141 2,860 3,353 14.2 14.2 10.0
6.7
SSA Low-income (39)
6,402 6,226 6,753 7,961 17.9 20.2 14.6 10.5
SSA Oil Exporters (6)
1,166
1,458 1,197 1,085
6.0 12.9
7.0
3.3
SSA Civil Conflict States (5)
511
313
130
34
10.5
5.6
2.2
0.5
Other SSA Low-income (28)
4,892 4,700 5,890 7,309 39.6 31.8 24.5 19.8
Notes: All agriculture is defined as all raw food, cash crops and agricultural raw materials in SITC Revision 2
excluding processed food and seafood products (see detailed classifications in Appendix Table 1).
The classification of country groups is provided in Appendix Table 4.
** Gabon is also in oil exporters, we added it to the middle-income group, not to create another group for
just one country.
Source: Based on partner data from UN COMTRADE Statistics.
In terms of vulnerability, using the 10 percent cut-off point, limiting the trade to raw
foods, and excluding oil exporters and conflict countries, only 3 low-income countries can be
considered vulnerable. These are the same 3 identified earlier, namely Benin, Guinea-Bissau,
and Senegal. If all agricultural trade definition is used, then only 1 country, Senegal can be
considered vulnerable.
VI. Conclusions
There have been serious debates on the impact of global reforms on poor countries. One
of the points raised against global agricultural reforms is the anticipated increase in food
prices and the assertions that most low-income countries are net food importers and would
suffer from these price increases.
This paper shows that while it is true that most low-income countries are net food
importers, their imports are negligible, and they have a large trade surplus in other
agricultural commodities which can be easily substituted for foods if relative prices change
significantly. Net food imports of low-income countries are very small, only 0.2 percent of
their imports. Part of the reason for this small food trade deficit is the oil exporters and
countries in conflict which have large raw food deficits. If these are excluded, then even
low-income countries have a surplus in food trade.
While a large number of low-income countries are net food importers, majority of them
are net agricultural exporters, and their agricultural trade surplus is almost 5 percent of their
imports. If the oil and conflict countries are excluded, the trade surplus increases to 6 percent
of imports. That is they import food and export other agricultural commodities. Most can
easily shift from producing other agricultural commodities to producing food if the food
prices change significantly
Being a net food importer and an agricultural exporter is especially pronounced in
low-income SSA. From a deficit of 3.4 percent of imports with narrow food, the region becomes
a net agricultural exporter and its trade surplus reaches almost 11 percent of it imports. Thus
even a small substitution in their agricultural export products into food would eliminate their
deficits.
There are only 3 vulnerable low-income countries, i.e., countries whose net narrow food
trade deficit is more than 10 percent of their imports, excluding oil exporters and conflict
countries. Of these 3, Benin and Guinea-Bissau export cotton and nuts, respectively, and
Senegal exports peanut oil which is not included in our measures.
Furthermore, raw food trade balances for developing countries have been improving for
the last 25 years. Low-income countries, excluding the ones in conflict and oil exporters,
have moved from a deficit of 1 percent of their imports in 1980/81 for raw food trade, to a
surplus of about 1 percent of the imports in 2004/05. SSA countries have not experienced the
same transformation.
These results suggest that the almost automatic reaction, that food price increases are bad
for low-income countries, needs to be qualified.
On the other hand, there are a group of countries that are experiencing civil conflicts and
are large importers of food, and can not easily adjust their production and meet their basic
needs. They also need special assistance in the distribution of food within their boundaries.
Therefore, one should modify the WTO Ministerial Declaration, and focus on these conflict
countries. We must accordingly agree to establish appropriate mechanism to ensure that the
implementation of the Doha Round Negotiations on trade liberalization in agriculture does
not adversely affect the availability of food aid at a level which is sufficient to continue to
provide assistance in meeting the food needs of conflict countries, especially those that are
also poor.
References
Aksoy, M. Ataman, (2005), “Global Agricultural Trade Policies”, in Aksoy, and Beghin,
Global Agricultural Trade and Developing Countries,
Washington DC: World Bank.
Aksoy, M. Ataman and John C. Beghin (2005),
Global Agricultural Trade and Developing
Countries
, Editors, Washington DC: World Bank.
Anderson, Kym and Will Martin (2006),
Agricultural Trade Reform and the Doha
Development Agenda,
Editors, Washington DC: A co-publication of Palgrave Macmillan and
the World Bank.
Diop, N, and S.M. Jaffee, (2005), “Fruits and Vegetables: Global Trade and Competition in
Fresh and Processed Product Markets”, in Aksoy and Beghin,
Global Agricultural Trade and
Developing Countries,
Washington DC: World Bank.
Ayres, Wendy and Alex McCalla (1996), “Rural Development, Agriculture, and Food
Security”,
Finance and Development
, 33: 8-11, December.
FAO (2002), “Trade Liberalization and Food Security: Conceptual Links”, Chapter 3 in
Trade Reform and Food Security
, Rome: FAO Document.
Hertel, T, R. Keeney, M. Ivanic and L. A. Winters (2007), “The Distribution Effects of WTO
Agricultural Reforms in Rich and Poor Countries”,
World Bank Research Digest
, 1(3),
Spring.
McCalla, Alex (2001), “What the Developing Countries Want from the WTO”,
The Estey
Centre Journal of International Law and Trade Policy
, 2(1), 165-177.
McCalla, Alex and John Nash (2007),
Reforming Agricultural Trade for Developing
Countries
, Editors, Washington DC: World Bank.
Mitchell, D., and M. Hoppe (2006), “From Marrakesh to Doha: Effects of Removing Food
Subsidies on the Poor”, in R. Newfarmer,
Trade, Doha, and Development,
Washington D.C:
World Bank.
Ingco, Merlinda and John Nash (2004),
Agriculture and the WTO: Creating a Trading
System for Development
, Editors, A co-publication of the World Bank and Oxford University
Press.
Panagariya, Arvind (2006), “Agricultural Liberalization and the Least Developed Countries:
Six Fallacies”,
The
World Economy: Global Trade Policy 2005,
edited by David Greenaway
,
Boston: Blackwell Publishers.
Thomas, Harmon (2006),
Trade Reform and Food Security: Country Case Studies and
Synthesis
, editor, Rome: FAO.
Valdes, A and Alex McCalla (1999), “Issues, Interests and Options of Developing
Countries”,
paper presented at the World Bank Conference on Agriculture and the New
Trade Agenda in WTO 2000 Negotiations
, Geneva, October.
World Bank (2001), “Trade Policies in the 1990s and the Poorest Countries”, Chapter 2 in
Global Economic Prospects and the Developing Countries
, Washington, DC: World Bank.
WTO (1994), “Net Food-Importing Developing Countries”,
Agriculture: Explanation
, web
Appendix Tables
Appendix Table 1: The Classification of Food and Agricultural Products in SITC Revision 2
All Agriculture (0+1+2+4-27-28) SITC Product Name
Raw Food Meats and Dairy Products 00 Live animals chiefly for food
011 Meat, edible meat offals, fresh, chilled
0223 Milk & cream, fresh, not concentrated
0251 Eggs in shell
Grains and Cereals 041 Wheat and meslin
042 Rice
043 Barley, unmilled
044 Maize (corn), unmilled
045 Cereals, unmilled, others, rye, oats etc.
Vegetables and Fruits 054 Vegetables, fresh, chilled or frozen
0571-0575 Fruits, citrus etc.
0579 Other fresh or dried fruits nes
Cash Crops Figs and Nuts 0576 Figs, fresh or dried
0577 Nuts, edible, fresh or dried
Tropical Products 0611 Sugars, beet and cane, raw, solid
0616 Natural honey
0711 Coffee, green, roasted or sub
0721 Cocoa beans, whole or broken, raw or roasted
074 Tea and mate
075 Spices
Feeds, Oilseeds and Tobacco 0811 Hay and fodder, green or dry
121 Tobacco, unmanufactured; tobacco refuse
22 Oil seeds and oleaginous fruits
Other Food Processed Food 012 Meat & edible offals, salted, smoked
014 Meat & edible offals, prep. & preserved
0224 Milk & cream, preserved, concentrated
023 Butter
024 Cheese and curd
0252 Eggs not in shell
046-048 Meals and flour of wheat, other cereal preps. nes
056 Vegetable, roots & tubers, prepared or presv.
058 Fruit, preserved and fruit preparation
0612 Refined sugars and other products
0615 Molasses
0619 Other sugars, sugar syrups, artificial
062 Sugar confectionery and other sugar prep.
0712 Coffee extracts, essences/concentrated
0722 Cocoa powder, unsweetened
0723 Cocoa butter and cocoa paste
073 Chocolate & other food prep. products
0812-0819 Bran, oil cake, meal fodder and other food wastes
09 Misc. edible products and preparation
111 Non alcoholic beverages nes
112 Alcoholic beverages
122 Tobacco manufactured
Other Food Seafood 034 Fish, fresh (live or dead), chilled, frozen
035 Fish, dried, salted or in brine ; smoked
036 Crustaceans and molluscs, fresh, chilled
037 Fish, crustaceans and molluscs, prep.
Non-Food Agricultural Raw Materials 21 Hides, skins and furskins, raw
23 Crude rubber, crude, synthetic
24-25 Cork, wood, pulp and waste paper
26 Textile fibres, silk, cotton, jute etc.
29 Crude animal and vegetable materials
Appendix Table 2: The Classification of Income Group Countries
Industrial Group (33) Low-income Group (58) Middle-income Group (105)
Australia Afghanistan Albania Lebanon
Austria Angola Algeria Libya
Belgium Bangladesh Antigua and Barbuda ** Macao
Canada Benin Argentina Macedonia, FYR
Cyprus Bhutan Armenia Malaysia
Czech Republic Burkina Faso Aruba ** Maldives **
Denmark Burundi Azerbaijan Marshall Islands **
Estonia Cambodia Bahamas, The ** Mauritius
Finland Cameroon Bahrain Mexico
France Central African Republic Barbados ** Micronesia, Fed. State **
Germany Chad Belarus Morocco
Greece Comoros ** Belize Namibia
Hungary Congo, Dem. Rep. Bermuda ** Nauru **
Iceland Congo, Rep. Bolivia Netherlands Antilles **
Ireland Cote d'Ivoire Bosnia and Herzegovina New Caledonia **
Italy East Timor Botswana Niue **
Japan Equatorial Guinea Brazil Oman
Latvia Eritrea Brunei Palau **
Lithuania Ethiopia Bulgaria Panama
Luxembourg Gambia, The Cape Verde ** Paraguay
Malta Ghana Chile Peru
Netherlands Guinea China Philippines
New Zealand Guinea-Bissau Colombia Qatar
Norway Haiti Cook Islands ** Romania
Poland India Costa Rica Russian Federation
Portugal Kenya Croatia Samoa **
Spain Korea, Dem. Rep. Cuba Saudi Arabia
Slovak Republic Kyrgyz Republic Djibouti Serbia and Montenegro
Slovenia Lao PDR Dominica ** Seychelles **
Sweden Lesotho Dominican Republic Singapore
Switzerland Liberia Ecuador South Africa
United Kingdom Madagascar Egypt, Arab Rep. Sri Lanka
Mali Fiji ** St. Lucia **
Mauritania Gabon St. Vincent & Grenadin**
Moldova Georgia Suriname
Mongolia Grenada ** Swaziland
Mozambique Guatemala Syrian Arab Republic
Myanmar Guyana Taiwan, China
Nepal Honduras Thailand
Nicaragua Hong Kong, China Tonga **
Niger Indonesia Trinidad and Tobago
Nigeria Iran, Islamic Rep. Tunisia
Pakistan Iraq Turkey
Papua New Guinea Israel Turkmenistan
Rwanda Jamaica Tuvalu **
Sao Tome & Principe ** Jordan Ukraine
Senegal Kazakhstan United Arab Emirates
Sierra Leone Kiribati ** Uruguay
Solomon Islands ** Korea, Rep. Vanuatu **
Somalia Kuwait Venezuela
Sudan Tajikistan Tanzania Togo Uganda Uzbekistan Vietnam Yemen Zambia Zimbabwe
Note: Industrial countries are based on traditional high-income 23 OECDs and new EU-10 countries. ** included in the middle-income small islander group.
Appendix Table 3: The Classification of Other Special Group Countries
Oil Exporters (27) Small Islanders (30) Civil Conflict Countries (12)
Algeria Antigua and Barbuda Afghanistan
Angola Aruba Algeria (see oil exporter)
Azerbaijan Bahamas, The Angola (see oil exporter)
Bahrain Barbados Azerbaijan (see oil exporter) Brunei Bermuda Bosnia and Herzegovina
Cameroon Cape Verde Congo, Dem. Rep.
Congo, Rep. Comoros East Timor
Ecuador Cook Islands El Salvador
Equatorial Guinea Dominica Eritrea
Gabon Eq. Guinea (see oil exporter) Haiti
Iran, Islamic Rep. Fiji Iran (see oil exporter)
Iraq Grenada Iraq (see oil exporter)
Kazakhstan Kiribati Lebanon
Kuwait Maldives Liberia
Libya Marshall Islands Nigeria (see oil exporter)
Nigeria Micronesia, Fed. Sts. Russian Fed. (see oil exporter)
Norway (see industrial countries) Nauru Serbia and Montenegro
Oman Netherlands Antilles Sierra Leone
Qatar New Caledonia Somalia
Russian Federation Niue Yemen Rep. (see oil exporter)
Saudi Arabia Palau
Sudan Samoa
Syrian Arab Republic Sao Tome and Principe
Trinidad and Tobago Seychelles
Turkmenistan Solomon Islands
United Arab Emirates St. Kitts and Nevis
Venezuela St. Lucia
Yemen Rep. St. Vincent & Grenadines
Tonga
Trinidad & Tobago (see oil exporter)
Tuvalu
Vanuatu
Notes: Oil exporters are based on at least 40 percent of fuels in total merchandise exports from UN COMTRADE Statistics.
Small islanders are those small economies with independent or autonomous administration, excluding colonized or dependent territories.
Civil conflict countries are drawn from countries with recent serious war outbreaks from the study by Paul Collier on "Economic Cause of Civil Conflict and their Implications for Policy", 2000.
Appendix Table 4: The Classification of Sub-Saharan African Countries
All Sub-Saharan
Africa (47)
Of Which
Middle-income (8)
Low-income (39)
Oil Exporters (7)
Civil Conflict
(5)
Botswana Angola
Lesotho Angola
Congo, Dem.
Rep.
Cape Verde
Benin
Liberia
Cameroon
Eritrea
Gabon
Burkina Faso
Madagascar
Congo, Rep.
Liberia
Mauritius Burundi
Malawi
Equatorial
Guinea
Sierra Leone
Namibia Cameroon
Mali Gabon
Somalia
Seychelles
Central African
Rep. Mauritania
Nigeria
South Africa
Chad
Mozambique
Sudan
Swaziland
Comoros
Niger
Congo, Dem.
Rep.
Nigeria
Congo, Rep.
Rwanda
Cote d'Ivoire
Sao Tome & Princ.
Equatorial
Guinea
Senegal
Eritrea
Sierra Leone
Ethiopia
Somalia
Gambia, The
Sudan
Ghana
Tanzania
Guinea
Togo
Guinea-Bissau
Uganda
Kenya
Zambia
Zimbabwe
Note: Also see Appendix Tables 2 and 3 for details.
Annex Table 1: Composition of Raw Food Exports, Imports and Net Imports by Income Group Country
Exports ($ million) Imports ($ million) Net Imports ($ million) Net Imports as % of All Imports
Country Group (No. of Country) 1980/81 1990/91 2000/01 2004/05 1980/81 1990/91 2000/01 2004/05 1980/81 1990/91 2000/01 2004/05 1980/81 1990/91 2000/01 2004/05
Raw Food, excl. Cash Crops
World (196) 65,630 112,287 146,569 203,166 74,450 110,459 138,528 199,190 -8,821 1,828 8,042 3,975 -0.6 0.1 0.1 0.0
Industrial Countries (33) 51,062 84,957 103,111 138,612 42,224 77,333 91,301 134,859 8,838 7,624 11,809 3,752 0.8 0.3 0.3 0.1
Middle-income, All (105) 12,881 25,027 38,618 57,525 26,933 29,829 39,601 53,320 -14,052 -4,802 -983 4,205 -3.4 -0.6 -0.1 0.1
Mid Income--Oil Exporters (20) 539 1,813 3,931 5,871 5,225 6,133 11,094 17,105 -4,686 -4,320 -7,163 -11,234 -4.4 -4.5 -3.6 -2.8
Mid Income--Civil Conflict (4) 431 555 211 343 482 678 898 1,135 -51 -123 -686 -793 -0.4 -0.7 -4.2 -3.0
Small Island Economies (30) 80 251 148 130 259 398 423 592 -179 -147 -274 -462 -2.9 -1.6 -1.5 -1.8
Other Middle-income (51) 11,831 22,408 34,327 51,181 20,967 22,620 27,187 34,488 -9,135 -213 7,140 16,693 -3.1 0.0 0.5 0.7
Low-income, All (58) 1,426 1,924 4,715 6,891 2,548 2,318 4,702 7,473 -1,122 -393 13 -582 -2.0 -0.6 0.0 -0.2
Low-income--Oil Exporters (7) 230 137 323 502 909 457 1,221 2,136 -679 -320 -898 -1,634 -3.4 -2.8 -4.8 -4.6
Low-income--Civil Conflict (8) 33 28 41 79 148 189 339 516 -115 -162 -298 -437 -2.2 -2.5 -4.0 -4.0
Other Low-income (43) 1,163 1,760 4,351 6,310 1,492 1,672 3,142 4,820 -329 88 1,209 1,489 -1.1 0.2 1.1 0.7
Meats & Dairy Products
World 21,010 40,867 52,217 73,534 20,559 40,140 51,980 76,788 451 727 237 -3,253 0.0 0.0 0.0 0.0
Industrial Countries 17,707 34,620 44,401 60,486 15,921 32,386 37,898 55,583 1,786 2,233 6,503 4,902 0.2 0.1 0.2 0.1
Middle-income, All 2,828 5,764 7,092 12,084 4,188 7,289 13,276 19,828 -1,360 -1,525 -6,184 -7,744 -0.3 -0.2 -0.4 -0.3
Mid Income--Oil Exporters 80 227 541 832 1,763 1,745 3,815 7,131 -1,683 -1,518 -3,274 -6,299 -1.6 -1.6 -1.6 -1.6
Mid Income--Civil Conflict 208 281 30 34 154 158 333 434 54 123 -303 -400 0.5 0.7 -1.8 -1.5
Small Island Economies 4 4 7 13 116 174 196 284 -113 -171 -189 -271 -1.8 -1.9 -1.0 -1.1
Other Middle-income 2,536 5,252 6,514 11,204 2,154 5,212 8,932 11,978 382 40 -2,418 -774 0.1 0.0 -0.2 0.0
Low-income, All 338 357 689 918 296 320 696 1,284 42 37 -7 -366 0.1 0.1 0.0 -0.1
Low-income--Oil Exporters 75 31 54 144 162 98 252 431 -87 -67 -198 -288 -0.4 -0.6 -1.1 -0.8
Low-income--Civil Conflict 3 0 0 0 17 36 68 120 -13 -36 -67 -120 -0.3 -0.5 -0.9 -1.1
Other Low-income 259 327 634 774 117 187 376 733 142 140 258 42 0.5 0.3 0.2 0.0
Grains & Cereals
World 23,304 26,465 35,588 43,526 37,055 31,712 33,827 42,650 -13,751 -5,247 1,761 876 -0.9 -0.2 0.0 0.0
Industrial Countries 20,525 22,265 25,309 29,747 13,087 12,523 11,098 14,673 7,438 9,742 14,211 15,075 0.7 0.4 0.3 0.3
Middle-income, All 2,094 3,395 8,246 10,767 19,909 16,954 17,136 20,204 -17,815 -13,559 -8,890 -9,437 -4.3 -1.7 -0.5 -0.3
Mid Income--Oil Exporters 16 232 791 1,493 2,855 3,342 4,741 5,504 -2,839 -3,110 -3,950 -4,011 -2.7 -3.2 -2.0 -1.0
Mid Income--Civil Conflict 25 39 32 136 234 181 249 305 -210 -142 -216 -169 -1.8 -0.8 -1.3 -0.6
Small Island Economies 3 2 26 9 65 85 73 96 -62 -83 -47 -87 -1.0 -0.9 -0.2 -0.3
Other Middle-income 2,051 3,121 7,396 9,129 16,755 13,345 12,074 14,299 -14,704 -10,224 -4,677 -5,170 -5.0 -1.5 -0.3 -0.2
Low-income, All 642 642 1,980 2,987 2,002 1,520 3,032 4,601 -1,359 -878 -1,051 -1,614 -2.4 -1.4 -0.8 -0.6
Low-income--Oil Exporters 104 9 19 10 636 257 847 1,497 -532 -248 -827 -1,487 -2.7 -2.1 -4.4 -4.2
Low-income--Civil Conflict 6 0 3 31 116 124 224 297 -110 -124 -221 -266 -2.1 -1.9 -3.0 -2.5
Vegetable & Fruits
World 17,778 39,368 51,115 74,334 13,181 32,446 45,122 67,314 4,597 6,922 5,993 7,019 0.3 0.2 0.1 0.1
Industrial Countries 10,093 23,500 27,887 39,872 10,308 27,590 35,918 53,944 -215 -4,090 -8,031 -14,072 0.0 -0.2 -0.2 -0.2
Middle-income, All 7,180 14,879 21,173 31,442 2,213 4,370 8,075 11,713 4,967 10,509 13,098 19,729 1.2 1.3 0.8 0.7
Mid Income--Oil Exporters 442 1,345 2,546 3,474 520 960 2,276 4,074 -78 385 270 -600 -0.1 0.4 0.1 -0.2
Mid Income--Civil Conflict 151 179 140 148 75 235 240 291 76 -57 -99 -143 0.6 -0.3 -0.6 -0.5
Small Island Economies 71 245 111 103 41 90 102 138 31 154 9 -35 0.5 1.7 0.1 -0.1
Other Middle-income 6,516 13,111 18,376 27,717 1,578 3,084 5,458 7,210 4,938 10,026 12,917 20,507 1.7 1.5 0.9 0.8 Low-income, All 436 908 2,028 2,965 172 387 898 1,423 264 520 1,130 1,543 0.5 0.8 0.8 0.6 Low-income--Oil Exporters 50 97 249 349 80 61 85 131 -29 36 164 218 -0.1 0.3 0.9 0.6 Low-income--Civil Conflict 23 27 38 47 6 22 39 79 17 6 -1 -32 0.3 0.1 0.0 -0.3 Other Low-income 362 783 1,741 2,570 86 305 774 1,213 277 478 966 1,357 0.9 1.1 0.9 0.7
Note: See classifications of country groups and product categories in Appendix Tables 1-3.
Annex Table 2: Agriculture and Other Food Exports, Imports and Net Imports by Income Group Country
Exports ($ million) Imports ($ million) Net Imports ($ million) Net Imports as % of All Imports
Country Group (No. of Country) 1980/81 1990/91 2000/01 2004/05 1980/81 1990/91 2000/01 2004/05 1980/81 1990/91 2000/01 2004/05 1980/81 1990/91 2000/01 2004/05
All Agriculture
World (196) 241,586 419,122 572,225 805,960 232,519 393,800 532,940 772,158 9,067 25,322 39,285 33,802 0.6 0.8 0.6 0.4
Industrial Countries (33) 157,581 287,093 368,136 509,289 150,181 286,072 360,321 518,415 7,401 1,021 7,815 -9,125 0.7 0.0 0.2 -0.2 Middle-income, All (105) 68,430 112,582 173,644 254,944 66,813 94,802 147,355 215,591 1,617 17,780 26,289 39,352 0.4 2.2 1.5 1.4 Mid Income--Oil Exporters (20) 2,042 4,878 18,969 26,779 14,022 15,536 31,082 48,426 -11,979 -10,658 -12,114 -21,646 -11.3 -11.1 -6.0 -5.4 Mid Income--Civil Conflict (4) 1,773 2,068 1,357 2,235 1,811 2,564 2,979 4,005 -37 -497 -1,622 -1,770 -0.3 -2.7 -9.9 -6.7
Small Island Economies (30) 697 1,048 1,651 2,190 853 1,363 1,731 2,225 -156 -314 -80 -36 -2.6 -3.5 -0.4 -0.1
Other Middle-income (51) 63,917 104,588 151,667 223,739 50,128 75,339 111,562 160,935 13,789 29,249 40,105 62,804 4.7 4.4 2.7 2.6
Low-income, All (58) 14,041 17,248 29,679 40,652 9,082 8,919 19,776 31,181 4,959 8,328 9,903 9,471 8.9 13.1 7.3 3.8
Low