Letterkenny Institute of Technology
A thesis submitted in partial fulfilment of
the requirements for the Master of Science in Computing in Enterprise Applications Development Letterkenny Institute of Technology
Comparing the Performance of
Enterprise Applications on Limited
Operating Systems
Author:
Linda McGrath B.Sc.
Supervisor:
Mrs Ruth Lennon M.Sc., B.Sc.
Submitted to the Higher Education and Training Awards Council (HETAC) September 2012
Declaration
I hereby certify that the material, which l now submit for assessment on the pro-grammes of study leading to the award of Master of Science in Computing in Enterprise Applications Development, is entirely my own work and has not been taken from the work of others except to the extent that such work has been cited and acknowledged within the text of my own work. No portion of the work contained in this thesis has been submitted in support of an application for another degree or qualification to this or any other institution.
Signature of Candidate Date
I hereby certify that all the unreferenced work described in this thesis and submitted for the award of Master of Science in Computing in Enterprise Applications Devel-opment, is entirely the work of Linda McGrath. No portion of the work contained in this thesis has been submitted in support of an application for another degree or qualification to this or any other institution.
Acknowledgements
This thesis would not have been possible without the support of many people. The author is especially grateful and would like to sincerely thank her supervisor and course creator Mrs Ruth Lennon for her continued guidance, support, and understanding. The author would also like to extend her gratitude to the Head of Computing Department Mr Thomas Dowling, and all the staff in Letterkenny Institute of Technology for all their help over the years. Finally the author would like to express her thanks to her family and friends for their support throughout writing this thesis.
Abstract
These days a Smartphone is just as important as a computer. It is essential that users select a device that has the best performance possible. This thesis used sim-ulation to compare the performance of an application on two of the most popular mobile operating systems, Android and Windows Phone 7. An application was de-veloped using the Android SDK/Java and Silverlight’s C#/XAML respectively. This application tested the performance of threads, file I/O, database loads, buffering, and caching on both operating systems. Both simulation devices were set up with the exact same specifications. The performance was measured using response times, CPU, and memory usage. This work shows that there were major differences in the performance results. With the response times Windows Phone 7 out performed Android in every scenario except buffering. Windows Phone 7 also used the least memory in every sit-uation except loading when a web page without caching. However when it came to CPU usage Android used half of what Windows Phone 7 did.
Contents
1 Introduction 9 1.1 Purpose . . . 9 1.2 Background . . . 9 1.3 Outline of Report . . . 10 2 Literature Review 11 2.1 Introduction . . . 112.2 Limited Operating Systems and Mobile Devices . . . 11
2.2.1 Android . . . 13 2.2.2 Windows Phone 7 . . . 15 2.2.3 Conclusion . . . 16 2.3 Performance . . . 17 2.3.1 Performance Metrics . . . 18 2.3.2 Performance Analysis . . . 20 2.3.3 Performance In Smartphones . . . 24 2.3.4 Benchmarking . . . 27 2.3.5 Conclusion . . . 27 2.4 Conclusion . . . 28 3 System Design 29 3.1 Introduction . . . 29 3.1.1 Project Scope . . . 29 3.2 Functional Requirements . . . 30
3.3 Non Functional Requirements . . . 31
3.4 UML Diagrams . . . 31
3.4.1 Use Case/Sequence Diagrams and Descriptions . . . 31
3.4.2 Class Diagrams . . . 43
3.4.3 System Flow Diagram . . . 46
3.5 Software Implementation . . . 47 3.5.1 Threads . . . 47 3.5.2 File . . . 49 3.5.3 Load . . . 50 3.5.4 Buffer . . . 52 3.5.5 Cache . . . 55 3.5.6 Performance Metrics . . . 57 3.5.7 Summary . . . 60
4 Testing 62
4.1 Introduction . . . 62
4.2 Specifications . . . 62
4.3 The PerformanceApp Software . . . 63
4.3.1 Threads . . . 63 4.3.2 File . . . 64 4.3.3 Load . . . 64 4.3.4 Buffer . . . 65 4.3.5 Cache . . . 65 5 Results 67 5.1 Introduction . . . 67 5.2 Threads . . . 68
5.2.1 Set Thread Count . . . 68
5.2.2 Run Threads . . . 69
5.2.3 Total Thread Task . . . 70
5.3 File . . . 72
5.3.1 Save/Write to File . . . 73
5.3.2 Read File . . . 74
5.3.3 Total File Task . . . 75
5.4 Load . . . 77
5.4.1 Create/Add to DB . . . 78
5.4.2 Query DB . . . 79
5.4.3 Total Load Task . . . 80
5.5 Buffer . . . 82
5.5.1 Buffer Track . . . 83
5.5.2 Total Track Play Time . . . 83
5.5.3 Total Buffer Task . . . 84
5.6 Cache . . . 86
5.6.1 Load Page Without Cache . . . 86
5.6.2 Load Page Using Cache . . . 88
5.7 Conclusion . . . 90
6 Conclusions 92 6.1 Introduction . . . 92
6.2 Limited Operating System Performance . . . 92
6.3 Further Work . . . 95
List of Figures
2.1 Memory Usage Screen from File Task . . . 23
2.2 Windows Phone Performance Analysis Graph from Thread Task . . . . 24
3.1 Use Case Diagram for the PerformanceApp software. . . 32
3.2 Thread Sequence Diagram . . . 34
3.3 File Sequence Diagram . . . 36
3.4 Load Sequence Diagram . . . 38
3.5 Buffer Sequence Diagram . . . 40
3.6 Cache Sequence Diagram . . . 43
3.7 Android Class Diagram . . . 44
3.8 Windows Phone 7 Class Diagram . . . 45
3.9 System Flow Diagram . . . 46
5.1 Set Thread Average Time . . . 69
5.2 Run Threads Average Time . . . 70
5.3 Total Thread Task Average Time . . . 71
5.4 Total Thread Task CPU Usage . . . 71
5.5 Total Thread Task Memory Usage . . . 72
5.6 Save File Average Time . . . 74
5.7 Read File Average Time . . . 75
5.8 Total File Task Average Time . . . 76
5.9 Total File Task CPU Usage . . . 76
5.10 Total File Task Memory Usage . . . 77
5.11 Add to DB Average Time . . . 79
5.12 Query DB Average Time . . . 80
5.13 Total Load Task Average Time . . . 81
5.14 Total Load Task CPU Usage . . . 81
5.15 Total Load Task Memory Usage . . . 82
5.16 Buffer Overall Average Time . . . 83
5.17 Play Track Average Time . . . 84
5.18 Total Buffer Task CPU Usage . . . 85
5.19 Total Buffer Task Memory Usage . . . 85
5.20 Load Page Without Cache Average Time . . . 87
5.21 No Cache Task CPU Usage . . . 87
5.22 No Cache Task Memory Usage . . . 88
5.23 Load Page Using Cache Average Time . . . 89
List of Tables
2.1 Android vs Windows Phone 7 . . . 16
3.1 Run Threads Use Case Description. . . 33
3.2 Read File Use Case Description. . . 35
3.3 Run Load Use Case Description. . . 37
3.4 Play Track Use Case Description. . . 39
3.5 Load web page Using Cache Use Case Description. . . 41
1 Introduction
1.1 Purpose
This document is the final dissertation for M.Sc in Enterprise Application Develop-ment. It gives the Software Requirements Specification for a thesis on Comparing the Performance of Enterprise Applications on Limited Operating Systems.
1.2 Background
Throughout the last number of years the popularity of Smartphones and devices, such as tablets, has soared. With such a wide variety of operating systems available for these devices, it is important to know how each operating system performs, especially as these devices are becoming an integral part of business as well as leisure. Many limited operating systems, such as Android and Windows Phone 7, are not limited to one particular brand or type of device. The Android operating system can be found running on a Sony Ericsson device as well as a Samsung device. This makes it difficult to determine the performance of the operating system itself. In order to get a clear idea of the performance of these operating systems, the PerformanceApp software artefact was developed.
and Windows Phone 7 device or emulator. For the purpose of this thesis, the Perfor-manceApp application was run through the Android and Windows Phone 7 emulators. The emulators were set up with matching specifications. The PerformanceApp appli-cation recorded several measurements: the response times taken to complete specific tasks, the CPU usage and the memory usage. The measurements were selected to provide a broad view of the operating system’s performance, and were used to help determine which operating system performed best in these specific areas. These mea-surement tasks are discussed in detail in Chapter 3. This thesis contains a literature review which discusses the background of mobile devices, the operating systems they run, performance metrics, and existing research on the performance of limited oper-ating systems. The thesis also discusses the requirements for the PerformanceApp software, how the software was tested, the results obtained and the conclusions drawn based on the results.
1.3 Outline of Report
Chapter 2 reviews the background of Smartphones, operating systems, and perfor-mance.
Chapter 3 examines design diagrams for the software including UML diagrams. Chapter 4 tests the performance application.
Chapter 5 analyses the results of the testing and discusses its findings. Chapter 6 closes the thesis and suggests further research.
2 Literature Review
2.1 Introduction
This chapter discusses the technologies and methodologies that were used in the devel-opment of this thesis. Areas covered include: Smartphone devices and their operating systems, the various areas of a systems performance, and existing research on the performance of limited operating systems.
2.2 Limited Operating Systems and Mobile Devices
A survey taken in 2008 suggested that of the 154.4 million people in employment in the United States, 72.2% used a mobile device or Smartphone at some point to carry out their job on the move. This percentage is expected to rise to 75.5% by 2013, which will be approximately 119.7 million people using a Smartphone for their work. These figures show how vital Smartphones and mobile devices have become. Due to wide availability of Smartphones, the market has a higher expectation for better per-formance. The performance of Smartphones should be analysed to determine which device provides the best performance Riedy et al. (2011). Due to the demand for Smartphones, their applications must be reliable, have low power consumption, and should also have a high performance level.
There is a wide array of mobile operating systems available. For the scope of this thesis, two of these operating systems were selected: Android and Windows Phone 7. The selection of these two operating systems was based on their popularity and availability across a large array of devices. The operating system acts as an interface between the user and the hardware components of a device, whether it be for Android or Windows Phone 7. User preference is often based on the operating system rather than the device itself. Two Smartphones with the same hardware specifications running different operating systems can produce different performance results. This thesis ran matching applications on two device emulators with the same hardware specifications using the two different operating systems. The purpose of this was to determine which handled specific tasks best. Knowing which operating system performs specific tasks best will aid users in selecting their Smartphones.
For this thesis, the application that ran on the emulators was a piece of software called PerformanceApp. The software was developed for both the Android and Win-dows Phone 7 operating systems and tested on their respective device emulators. The PerformanceApp application was designed and developed purposely to test specific performance aspects of both operating systems that are commonly used. The Perfor-manceApp has the ability to:
• spawn threads
• read and write text to an internally stored file
• run loads against a database
• buffer and play a MP3 file from an on-line source
Mobile applications tend to be developed for multiple operating systems Kim et al. (2009). These applications may be written in different programming languages but their functionality is the same. Windows Phone 7 applications are developed using Silverlight or XNA, and Android applications are developed using Java or, in some cases, C or C++. For this thesis the Android PerformanceApp was developed using the Android SDK/Java in Eclipse, while the Windows Phone 7 version of the Perfor-manceApp was developed using Silverlight’s C#/XAML in Visual Studio 2010 Express for Windows Phone.
Java and Silverlight’s C#/XAML were chosen for developing the two versions of the PerformanceApp software as they are the most popular languages for their respective application development. The two versions of the PerformanceApp software mirror each other in both design and functionality. The reason for this was so the performance
of the two could be compared. It is important to note that ideally a version of
the PerformanceApp software would have been developed for all the major operating systems and tested on each operating system’s device. However for the scope of this thesis that was not possible, it does provide an area for further research.
2.2.1 Android
Developed by Open Handset Alliance as part of Google, the Android operating system is one of the main competitors against Apple’s iPhone and BlackBerry. Unlike Apple’s iOS and BlackBerry OS, Android is available on a wide array of devices regardless of the brand. The current version at the time of this thesis was Android version 4.0 Ice Cream Sandwich. Version 4.0 uses the Android API level 14, which provides a unified framework for developing applications for Android phones as well as Android tablets Android (2012c).
Android provides a SDK and emulator for developers to write their own applications and gives them the opportunity publish them on Android Market. These applications can then be downloaded for free or purchased. Android applications are generally writ-ten in Java, however Android NDK allows developers to use other languages such as C and C++. As previously stated, for the purpose of this thesis the Android SDK/Java was used as it is the most commonly used language for developing Android applications Android (2012b).
The PerformanceApp software used a database to run loads against the system to determine its performance level. For database storage, Android cannot use the full version of SQL, however it does have access to SQLite. SQLite is a light weight ver-sion of SQL which is perfectly suited for a mobile device. It is one of the most popular relational databases available for mobile devices. SQLite only requires a small amount of disk space and memory to run, and is a persistent database. The popularity coupled with its ability were the reasons SQLite was used for the load task for the Android version of the PerformanceApp software.
Android has been developed on a Linux kernel, however, due to architecture changes made by Google, Android is a completely different operating system, and as such porting Linux applications to Android can be difficult. A Linux kernel was chosen as the systems hardware abstraction layer because it has been ‘tried and tested’ over the years. As part of the Android Runtime, there is the Dalvik Virtual Machine. This uses .dex files to convert .class and .jar files at build time to run more efficiently on a device with limited processing power such as a Smartphone Android (2012a). Android applications are allocated a space in internal storage. These applications are limited and each application is ‘sand-boxed’ to its own allocated storage space. Applications can only access their own storage. This is for security purposes as it stops applications
reading information from other applications. The allocated memory is attached to the application and once that application is uninstalled any data belonging to it is also destroyed.
2.2.2 Windows Phone 7
Windows Phone 7 is the successor to Windows Mobile, with the latter finishing off at version 6.5.5. Although Windows Phone 7 replaced Windows Mobile, the two plat-forms are not backward compatible Ziegler (2010). The current version at the time of this thesis was 7.5 Mango. Windows Phone 7 was selected as one of the two operating systems that were compared, as it has gained a rapid increase in popularity, as well as being available on a wide range of devices.
The Windows Phone 7 architecture contains the Hardware Foundation layer. This contains a set list of the minimum hardware requirements that a Smartphone running Windows Phone 7 must conform to. The specifications required by Microsoft ensure that all devices using the Windows Phone 7 operating system are of a high standard. This list includes: ARM7 CPU, a GPU that can use DirectX, a camera, and a multi-touch capacitive display. This is to create a sense of consistency across all devices running the operating system for both users and developers. It is also to ensure the operating system performs smoothly on all devices that it runs on. Another hardware feature to encourage consistency are the three buttons found on the front of each device. These buttons, back, start, and search, provide quick navigation throughout the phone. The drivers for the Windows Phone 7 kernel are pre-written by Microsoft which provides a uniform experience for developers Interoperability (2011).
Like Android, each application is isolated into its own ‘sandbox’ in the device’s in-ternal memory for security purposes. This memory space is known as isolated memory,
which is attached to its respective application. If an application is uninstalled, its isolated memory is cleared. The Applications Framework, which is part of the Win-dows Phone 7 architecture, allows an application to be coded in both Silverlight and XNA. XNA is a framework primarily used for developing games. Silverlight is an event driven framework which makes it easy and fast to build rich UI’s and both it and XNA use Microsoft’s CLR Interoperability (2011). For the purpose and the nature of the software that was developed for this thesis, Silverlight using C#/XAML was used.
2.2.3 Conclusion
The following table provides a comparison of the Android and Windows Phone 7 operating systems.
Android Windows Phone 7
Version Used: 4.0 Ice-cream Sandwich 7.5 Mango
Development Language:
Android SDK/Java (OOP) Silverlight’s C#/XAML
(OOP)
IDE: Eclipse Visual Studio 2010 Express
for Windows Phone
Database: SQLite Linq-to-SQL
App storage loca-tion:
Internal (sandbox) Internal(sandbox)
Architecture: Built on a Linux based kernel
(drivers)
Almost all drivers built by Mi-crosoft
OS Availability: Any device Any device (must meet
stan-dards)
Smartphones and mobile devices are used everywhere for both business and leisure. The performance of an application on a device is vital. The different architectures of operating systems can result in certain areas of an application performing better on one operating system than on another. There are many mobile operating systems available, however Android and Windows Phone 7 were selected for the purpose of this thesis. Table 2.1 shows a comparison of both operating systems. As the table showed the two operating systems chosen have several features in common. Both operating systems are not tied to a particular brand of phone or device, they are among the most popular mobile operating systems available, and both are developed using an Object Oriented Programming language. They both use the same ‘sandbox’ method of storing and protecting applications.
The table also shows that both operating systems are capable of the same function-ality despite using different methods. It would have been interesting to see which single form of database connectivity would perform best between the two devices. However as Linq-to-SQL is only available on Windows Phone 7 devices this comparison was not possible. SQLite and Linq-to-SQL were chosen as they are the two most optimised forms of database connection available for each respective operating system. The PerformanceApp software was designed and developed to test areas of performance on the two operating systems. While the two versions of the software were written in different programming languages, both versions perform the exact same functionality. The functionality of the PerformanceApp software is discussed in detail in Chapter 3.
2.3 Performance
Performance was the key area of this thesis. Performance Metrics, Smartphone Per-formance, Performance Analysis and Benchmarking are covered in this section.
Stantchev and Malek (2008) tell us that performance can be defined as: “the system output that represents the number of successfully served re-quests from a total of input rere-quests during a period of time.”
2.3.1 Performance Metrics
Performance metrics are measurements used to determine the performance of a sys-tem. There are many metrics that can be used to measure a systems performance. The following are some of the most common: CPU usage, disk I/O rate, response time, throughput, scalability, path length and load Parekh et al. (2006).
Chiew (2009) say performance is the measure of how fast a system request can be completed, however a systems performance also takes in how efficiently the system runs. Performance can also be classed as how fast the system starts up and how the system runs under varying workloads. Unfortunately what the developer may believe to be good system performance may be different to what a customer perceives as being good performance. Joines et al. (2003) state that it is important to evaluate a systems performance, and while doing so the following should be watched: Load, Throughput, Response Time, Path Length, Bottlenecks and Scalability. They also state that these six can be further broken down into two separate groups, measurement and optimisation.
The Measurementcan be broken down into:
• Load: the measure of the amount of work, or data, that the system performs.
For this thesis, the load was measured by gathering the CPU usage throughout the tests.
did not allow for sufficient results.
• Response time: the time it takes between a request being given and the request being completed. Joines et al. (2003) say response time can be defined as:
RT =T2−T1.T1 (2.1)
Where T1 is time measured when the request is sent and T2 is time measured after the request is complete. This equation was used throughout the thesis to determine the response time for each task performed.
The response time was recorded for each task carried out for this thesis using this equation.
The Optimizationcan be broken down into:
• Path length: the number of steps needed to complete a request.
• Bottlenecks: when a system receives more requests than it can handle and the
data flow comes to a stand-still. Parekh et al. (2006) says putting an application through trails of various workloads allows you to identify bottlenecks.
• Scalability: this is adding resources, usually hardware, to the system to improve its performance. However, simply adding resources can change the dynamics of an application resulting in the application requiring tuning Joines et al. (2003). There are several ways a system can be up-scaled, the most common are:
– Vertical Scaling: also known as scaling up, this usually involves adding hardware components like memory or processors to a single machine to improve its performance.
– Horizontal Scaling: can also be called scaling out. Horizontal scaling is when more machines are added to a system to improve performance, e.g. going from one web server to two or three.
– Linear Scaling: this is almost like a blend of vertical and horizontal scaling where a systems resources double. Linear scaling rarely happens in the real world Joines et al. (2003).
For the scale and nature of this thesis, scalability was not carried out. Further re-search could be carried out in this area in order to determine how various hardware configuration affect the performance of the operating systems.
2.3.2 Performance Analysis
Lilja (2000) says Performance Analysis has three fundamental techniques:
• Analytical Modelling: these are mathematical models that have a closed form
solution. They are equations written to describe the performance behaviour of a system.
• Simulation: this is also a type of model, however they are tailored to simulate a particular system. Simulations are often used in place of analytical models when the systems is very complex. Results are not always accurate as no simulation can create a real life scenario.
• Measurements of Existing Systems: monitoring or using benchmarks from an
existing system. These results tend to be a little more accurate but it is difficult to change any of the parameters.
For this thesis, Equation 2.1 was used to determine the response times for each of the tasks carried out throughout the PerformanceApp software. Ideally the Perfor-manceApp software would have been run and tested in a real life environment such as an Android or Windows Phone 7 device. However, due to a Smartphone or device being unavailable, it was unavoidable to use methods such as simulation. While this
Phone 7 both provide an emulator for such circumstances. If both an Android and a Windows Phone 7 device were available, it would be an area for further research to measure the performance of both the real life devices against the emulators to see how they compare.
Kotsis (2006) gives five steps that were very useful for the performance analysis process. These steps provided a great starting point and guideline for the performance analysis stage of the PerformanceApp software. The steps followed were:
i) decide on the metrics to be used for testing the system ii) set how much of a workload is to run on the system
iii) chose how and what tools are going to be used to test the system iv) record all the results gathered
v) make adjustments and improve the system based on the information gathered These steps were followed throughout the process of this thesis and the development of the Android and Windows Phone 7 versions of the PerformanceApp software. As the previous steps mentioned, the performance tools for the PerformanceApp software could not be chosen until the metrics were decided. The five steps described by Kotsis (2006) were invaluable to this thesis. Following the first step, the CPU usage, memory usage load, and response time were chosen as the metrics that were to be recorded. The seconds step varied from task to task. The workload set on each task had to be enough so that it would show any affect there was on the performance, but not so much that the entire application would come to a standstill. For step three there was a great variety of performance analysis tools available for both Java and Silverlight/C# and XAML. Choosing which one to use depended on what it was needed for and which
IDE was being used.
For this thesis a combination of coding and application tools were used to gather the results. For Android, code was used to obtain the CPU usage, and an application
called Memory Usage was used to obtain the memory usage. For Windows Phone 7
the CPU usage was gathered by the Windows Phone Performance Analysis Tool. This tool also gathered the memory usage, however it showed this information in graphical form and did not give any numerical detail. To obtain the memory usage in detail, code was written to gather the results. Steps four and five used the results gathered from step three to determine which of the two operating systems performed specific task best.
In order to gather the data for the PerformanceApp software, tools were required to gather individual information. This information was used to compare the performance of the two versions of the PerformanceApp software which helped determine which performed specific tasks best. For both the Android and Windows Phone 7 versions of the application, a combination of coding and software tools were used to gather the
CPU and memory usage. For Android, an application calledMemory Usage was used
to gather information on the amount of memory the application used, and code was used to gather the CPU usage information. For Windows Phone 7, code was written to obtain the memory usage, and the Windows Phone Performance Analysis Tool was used to determine the CPU usage.
The Memory Usage application was developed by TwistByte LLC, and shows the current memory usage, peak memory, priority, and process identification of each ap-plication or service running on the device. Fig 2.1 provides a snapshot of the readings achieved while measuring the file task on Android. This Fig shows the amount of
memory that was available to the device and how much of the device’s resources the PerformanceApp software required for the file task.
Figure 2.1: Memory Usage Screen from File Task
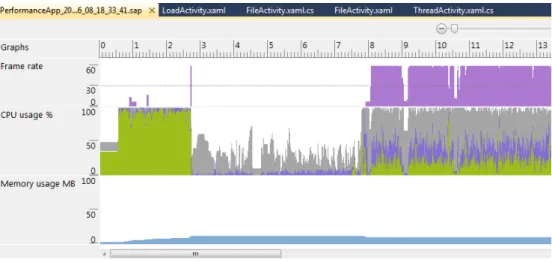
Microsoft have provided theWindows Phone Performance Analysis Tool for profiling Windows Phone 7 applications. The Performance Analysis Tool runs in the background gathering data as functions in applications are used. The data is then presented in a graphical overview to show details such as Frame rate, CPU usage and memory usage. These results can be expanded and can give suggestions for improvements Microsoft (2012). Despite gathering memory usage information, the Performance Analysis Tool was not used for this purpose in this thesis. Code was written in order to obtain the memory usage of the PerformanceApp software. Fig 2.2 shows a snapshot of the Windows Phone Performance Analysis Tool in use for the thread task.
Figure 2.2: Windows Phone Performance Analysis Graph from Thread Task
2.3.3 Performance In Smartphones
Smartphones are infinitely more advanced than they were several years ago. Most now rival, if not match, the performance of some tablet computers. Smartphones have their limitations, having a limited power supply, processing power and memory. With these devices running off battery power it is important find ways of conserving energy. Lee and Lee (2011) tells us that writing more efficient code can enhance an application’s performance as well as improving an application’s energy consumption levels.
Lee and Lee (2011) have performed research in an area similar to this project. This thesis compared the performance of two matching applications on Android (written in Java) and Windows Phone 7 (written using Silverlight’s C#/XAML). The idea of this was to compare which of the operating systems performed specific tasks best. Lee and Lee (2011) have done a project where they wrote two matching applications. Both applications were written for Android, one in Java and one in Native C using the Android NDK. They tested five areas: JNI delay, Integer parsing, Floating point, mem-ory access and String processing. Section 2.2.1 explained how Android runs on the
Dalvik Virtual Machine. The Dalvik Virtual Machine has been specifically designed for devices with slow CPUs and restricted memory Lee and Lee (2011). For the purpose of measuring time in the project, Lee and Lee (2011) used a method similar to what was used in this project. Lee and Lee (2011) retrieved the current time in nano seconds. For this thesis the current time was recorded in milli seconds, this was the case for both versions of the PerformanceApp software. The time was recorded twice per task, at the beginning and at the end. Equation 2.1 shows the start time was then subtracted from the end time in order to determine the length of time taken for a task to be completed. The research carried out by Lee and Lee (2011) showed that in three of the five tests carried out, using Native C produced the best results having been faster with the Integer parsing, Floating point and Memory Access tests. Java won out with the other two tests which were JNI Delay and String processing. In fact they have suggested using Java for Android if the application is to involve many String processes.
Having performed research involving comparing the performance of an application running on Android, using the Dalvik Virtual Machine, Angstorm Virtual Machine with JIT(Just In Time Compiler) enabled and Angstorm Virtual Machine with JIT disabled, Kundu and Paul (2011) have suggested that in cases of Heap sorting and quick sorting, Android performs better using Angstorm Virtual Machine with JIT disabled. However, their research also shows that Angstorm Virtual Machine with JIT enabled provides better results than Android’s Dalvik Virtual Machine. Kundu and Paul (2011) have shown that the Dalvik Virtual Machine gives 1.484 times better performance than the standard Angstorm Virtual Machine without JIT set-up, but in all of their tests, Dalvik Virtual Machine was shown to have a slower performance than Angstorm Virtual Ma-chine with JIT enabled. Despite the slower performance Kundu and Paul (2011) state that Android’s Dalvik Virtual Machine is more power efficient due being set up to op-timise an applications energy consumption. Based on these findings, it would make an
interesting extension to this thesis to run the Android version of the PerformanceApp software through different virtual machines and their configurations.
Kundu and Paul (2011) also discuss the potential for using parallel processors to further improve Android performance. They mention that having multiple processors can cut down the time required to run an application, and suggest having processors turned off when not in use can increase performance and an application’s energy con-sumption. This is very fascinating and would be a great basis for further research for both Android and Windows Phone 7 performance, however for the scope of this thesis it was not included.
As previously mentioned in Section 2.2.1, SQLite was chosen as the relational database that was used for the load task in the Android version of the PerformanceApp software. Song et al. (2010) carried out research on the optimising the performance of SQLite on flash memory. Their research consisted of adding files to a SQLite database on an Android device. They used SQLite transactions and commits to ensure the data being used would not be lost in the event of a sudden loss of power. To optimise the performance of SQLite they suggested reducing the number or commits called when updating a database. They also showed that changing synchronous to off can also aid in SQLite optimisation. However, these methods can pose a security risk to the database. In the event of the device losing power, the database can become corrupt and unusable. The research Song et al. (2010) have put forward could make improve-ments to the response time of the load task for Android, but due to the security issues with these methods, they were not be used for this thesis.
2.3.4 Benchmarking
Performance Benchmarking is the measuring process used to compare systems. It can be used to compare the performance of hardware and/or software. Benchmark tests are written to test something specific and may not work well for testing other aspects of a system, even if they are related. Benchmarking is useful to see how an application runs on different systems Kotsis (2006). Benchmarking is a useful technique and provides an excellent bases for comparing software on various devices. As this thesis is concerned with comparing the performance of two operating systems on two different device emulators, benchmarking is not necessary or useful and therefore was not included.
2.3.5 Conclusion
For this thesis, the CPU usage, memory usage, and response times were measured for each task. Equation 2.1 was used to calculate the response times. This was the time taken to complete each individual task, such as, run threads or query a database. The response times, along with the CPU and memory usage allowed a direct comparison of the PerformanceApp software on both Android and Windows Phone 7 operating systems, and showed which operating system performed best at specific tasks. While it would have been preferable to have run the PerformanceApp software on an actual Android and Windows Phone 7 device, due to devices being unavailable, emulators were used in their place. These emulators were set up to have matching specifications to ensure results gained were accurate.
The Memory Usage application and Windows Phone Performance Analysis Tool
were used in conjunction with code in order to retrieve memory and CPU usage infor-mation, and the response times for the various tasks. Lee and Lee (2011) used the same method in order to get the response time for tasks. Benchmarking can be a
use-ful process for comparing systems, however the two versions of the PerformanceApp software were only run on their respective emulators and so was not used for this thesis.
2.4 Conclusion
The popularity of Smartphones and devices is continuing to grow every day. With this rise in popularity the performance of applications on these devices is becoming vital. Lee and Lee (2011), Kundu and Paul (2011) and Song et al. (2010) have put forward ideas which can benefit the performance of applications on Android, some of these ideas can also be applied to Windows Phone 7 performance. At present, there has been substantially more research carried out on Android performance. Windows Phone 7 is a new operating system and therefore is lacking research. Smartphones have been around for years but it is still a relatively new area and requires much further research.
The performance of the PerformanceApp software could not be measured until the metrics were decided. The metrics that were used for this project were CPU usage load, memory usage, and response time. These metrics were measured on both versions of the application using a combination of coding and software tools.
3 System Design
3.1 Introduction
This chapter includes the system, functional and non-functional requirements for the PerformanceApp software artefact that was developed for this thesis.
3.1.1 Project Scope
This thesis aimed at comparing performance aspects of limited operating systems. With a wide array of limited operating systems available today, and for the scope of this project, it was decided that two of the most popular operating systems would be chosen. Matching versions of the PerformanceApp software were designed and developed for each operating system. The operating systems selected were Android and Windows Phone 7.
Both versions of the PerformanceApp software were designed to have the same functionality with a similar GUI. As the Android version was written in Java and the Windows Phone 7 version was written in Silverlight’s C#/XAML, there were slight differences in the implementation, but the overall look and feel was the same. Both versions of the PerformanceApp software ran tests on various aspects that can affect the performance of an application on a device. These included: threads, I/O rate, database loads, buffering a file, and caching a web page.
3.2 Functional Requirements
The following are the functional requirements for the PerformanceApp software arte-fact.
• The PerformanceApp software artefact will be developed to run on limited
op-erating systems.
• Both the Android and Windows Phone 7 versions of the PerformanceApp
soft-ware must have the same functionality.
• The PerformanceApp software will test various performance areas of limited
operating systems.
– Test areas(i.e. threads, file, load, buffer, cache) can be tested individually and in any order.
– The response time for each task must be calculated using Equation 2.1.
– The CPU usage and memory usage must be recorded.
– The number the thread task counts to must be set by the user.
– The user can set the number of threads to be run. – The text to be written to file must be set by the user. – The file cannot be read until content has been saved to it.
– The number of records to be added to the database must be set by the
user.
– The database cannot be queried until the records have been added.
– The MP3 must begin buffering before it can be played.
– The server containing the web page must be running.
3.3 Non Functional Requirements
The following are the the non functional requirements for the PerformanceApp software artefact.
• The PerformanceApp GUI should be consistent in both limited operating
sys-tems.
• The software should be robust.
• The software should be reliable.
3.4 UML Diagrams
This section contains the UML diagrams for this thesis. This includes the Use Case Diagram, Use Case Descriptions, Sequence Diagrams, System Flow Diagram, and the Class Diagrams.
3.4.1 Use Case/Sequence Diagrams and Descriptions
The Use Case diagram shows how the user interacts with the PerformanceApp software as a whole, and shows how each task can be performed independently of each other. The sequence diagrams provide a view of the user’s interaction with the application for each of the separate functions, i.e. threads, file I/O, load, buffer, cache. The sequence diagrams have been split up as these functions do not have to be performed in any particular order.
Figure 3.1: Use Case Diagram for the PerformanceApp software.
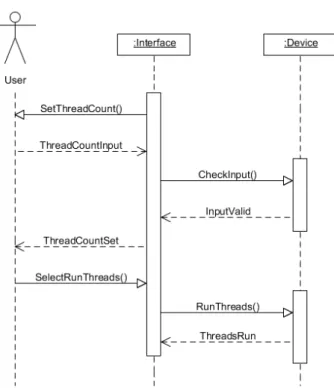
Run Threads Use Case
The purpose of the thread task was to retrieve the number of threads the user re-quested. The time taken for the application to count to the desired number of threads was recorded in order to determine the response time. Figure 3.2 gives a graphical rep-resentation of how the user interacted with the application to set and run the threads. Table 3.1 describes in detail what steps must be done in order to carry out the thread
Use Case Run Threads
Objective User sets the count number for the threads and runs them.
Precondition The count number must be greater than zero.
Main Flow 1. The user enters the number desired in the text area.
2. Set count button used to set the thread count number. 3. Run threads button used to run the threads.
Alternative Flow 1. The user enters invalid data into the text area.
Post Condition The thread runs until the count number is reached.
Table 3.1: Run Threads Use Case Description.
Figure 3.2 shows how the count number is requested from the user and set once it is input. The user then selects to run the threads. Allowing the user to set the count number made the application more dynamic as it allowed the work load to be varied. It should be noted that the Interface refers to the UI the user interacts with, which is written in XML for Android and XAML for Windows Phone 7. The term Device refers to the back end code which provides the functionality for the application, this is Java for Android and C# for Windows Phone 7. The Interface is connected to the Device providing a front end to the user.
Figure 3.2: Thread Sequence Diagram
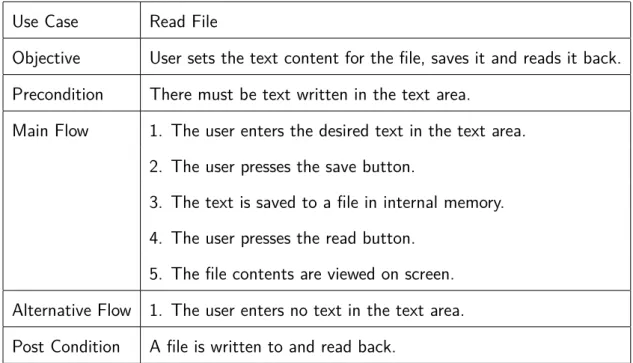
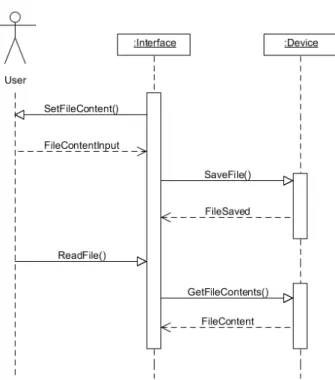
Read File Use Case
The purpose of the file task was to retrieve text from the user, and save that text to a file stored in the devices internal memory. The content of the file was then read back from internal memory and displayed on the screen. The time taken for the application to read and write to the file was recorded in order to determine the response time. The purpose of this task was to determine the performance of each operating system’s disk I/O rate. Figure 3.3 gives a graphical representation of how the user interacted with the application to set the text, save it to the file, and read that file’s content back from internal memory. Table 3.2 describes in detail what steps must be done in order to carry out the file task.
Use Case Read File
Objective User sets the text content for the file, saves it and reads it back.
Precondition There must be text written in the text area.
Main Flow 1. The user enters the desired text in the text area.
2. The user presses the save button.
3. The text is saved to a file in internal memory. 4. The user presses the read button.
5. The file contents are viewed on screen. Alternative Flow 1. The user enters no text in the text area.
Post Condition A file is written to and read back.
Table 3.2: Read File Use Case Description.
Figure 3.3 shows how text for the file content is requested from the user and set once it is input. It then shows how the user can select to read the file content from internal memory and display it on the screen.
Figure 3.3: File Sequence Diagram
Run Load Use Case
The purpose of the load task was to retrieve the number of records to be added to the database from the user. After the number of records are added, the user runs a query against the database to retrieve all the records and displays them on screen. The time taken for the application to add and query the records was recorded in order to determine the response time. Figure 3.4 gives a graphical representation of how the user interacted with the application to set the number of records, add them to the database, and query the database to retrieve all the records. Table 3.3 describes in detail what steps must be done in order to carry out the load task.
Use Case Run Load
Objective The user runs a load on the database.
Precondition There must be records in the database.
Main Flow 1. The user sets the number of records to add to the DB.
2. The set number of records are added to the DB. 3. The user requests the run load.
4. All records are called from database.
Alternative Flow 1. The records are not added to the database.
Post Condition The database has been written to and queried.
Table 3.3: Run Load Use Case Description.
Figure 3.4 shows the users interaction with the application in order for the database to be created. The number of records to add to the database was then requested from the user. That number of records were then added to the database before the user can query the database to retrieve all the records.
Figure 3.4: Load Sequence Diagram
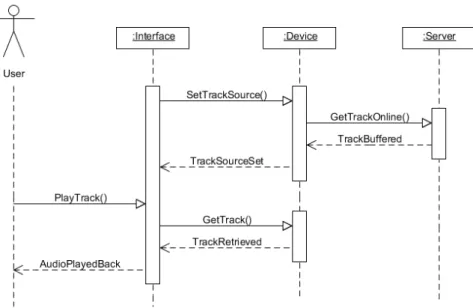
Buffer Track Use Case
The purpose of the buffer task was to buffer a MP3 file from an on-line source and have it played back. The response time was record for the MP3 file to completely buffer, and for the MP3 file to play from when the user selected play, to when the file finished. Figure 3.5 gives a graphical representation of how the user interacted with the application to buffer the MP3 from an on-line source and play it back. Table 3.3 describes in detail what steps must be carried out in order for the buffer task. The user selects the buffer tab which sets the source of a MP3 from on-line. The track immediately begins buffering. The user plays the buffered track by selecting the play button.
Use Case Buffer Track
Objective The user plays a track from an on-line source.
Precondition The device must be connected to the internet.
Main Flow 1. The user selects the buffer tab.
2. Track source is assigned from on-line, begins buffering. 3. The user presses the play button.
4. Track is played from on-line source to the end. Alternative Flow 1. The device is not connected to the internet.
Post Condition The track is buffered and played from an on-line source.
Table 3.4: Play Track Use Case Description.
Figure 3.5 shows how the data source for the MP3 file was set, which then began buffering The track began to play once the user requests it. The Interface and Device refer to the same as the tread (Fig 3.2), file (Fig 3.3) and load (Fig 3.4) sequence diagrams. However in this diagram there is also Server, which refers to the on-line source for the MP3 being used.
Figure 3.5: Buffer Sequence Diagram
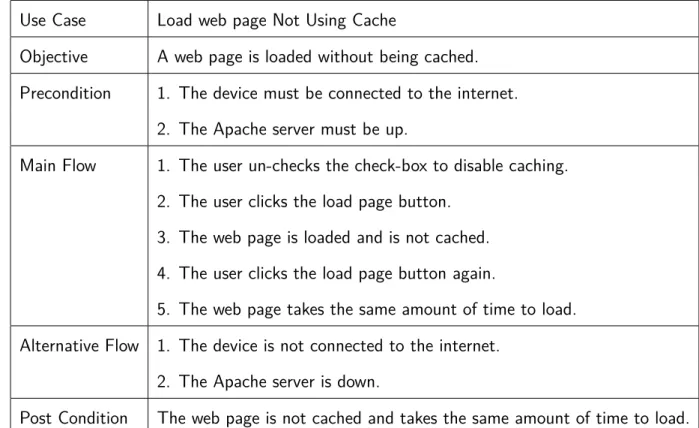
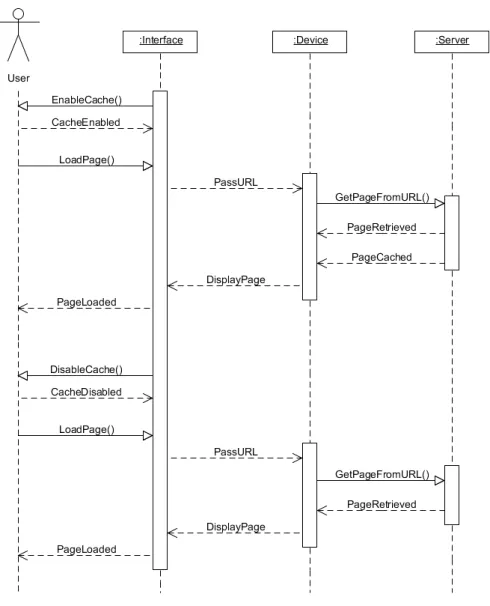
Load web page Using/Not Using Cache Use Case
The purpose of the cache task was to load a web page containing images from an Apache server. The user had the option of loading the page with or without the cache. Loading the page without the cache meant the page was loaded fresh from the server each time. Loading the page using the cache meant the page would be loaded from the device’s cache memory, and so would load in a fraction of the time it would have from the server. Figure 3.6 gives a graphical representation of how the user interacted with the application to load the page both with and without the cache. Table 3.5 describes in detail what steps must be done in order to carry out the task while using the cache to load the page.
Use Case Load web page Using Cache
Objective A web page is loaded having been cached.
Precondition 1. The device must be connected to the internet.
2. The Apache server must be running.
Main Flow 1. The user checks the check-box to enable caching.
2. The user clicks the load page button. 3. The web page is loaded and is cached. 4. The user clicks the load page button again. 5. The web page reloads faster.
Alternative Flow 1. The device is not connected to the internet. 2. The Apache server is down.
Post Condition The web page is cached and loads faster.
Table 3.5: Load web page Using Cache Use Case Description.
Table 3.6 describes in detail what steps must be done in order to carry out the cache task without using the cache to load the page.
Use Case Load web page Not Using Cache
Objective A web page is loaded without being cached.
Precondition 1. The device must be connected to the internet.
2. The Apache server must be up.
Main Flow 1. The user un-checks the check-box to disable caching.
2. The user clicks the load page button. 3. The web page is loaded and is not cached. 4. The user clicks the load page button again.
5. The web page takes the same amount of time to load. Alternative Flow 1. The device is not connected to the internet.
2. The Apache server is down.
Post Condition The web page is not cached and takes the same amount of time to load.
Table 3.6: Load web page Not Using Cache Use Case Description.
Figure 3.6 shows how the user interacted with the application in order to load the page using the cache and without using the cache. The Interface and Device are the same as the other tasks, however in this case the Server refers to an Apache server that is hosting the website to be loaded.
Figure 3.6: Cache Sequence Diagram
3.4.2 Class Diagrams
The class diagrams show the layout of the classes for the Android and Windows Phone 7 versions of the PerformanceApp software. The class layout is slightly different be-tween the two operating systems as the Android application requires an additional class named PerformanceApp. This class solely exists to contain the navigation tabs for the application.
Android Class Diagram
Windows Phone 7 Class Diagram
3.4.3 System Flow Diagram
The system flow diagram gives an overview of what the application does with various interactions.
3.5 Software Implementation
The following code snippets are from the Android and Windows Phone 7 versions of the PerformanceApp software. The purpose of which is to provide a brief explanation of how the various tasks were completed on both operating systems. Issues encoun-tered during the development of this software are highlighted here. As mentioned in Chapter refch:literatureReview, the Android version of the PerformanceApp software was developed using the Eclipse IDE, and the Windows Phone 7 version was developed using Microsoft’s Visual Studio 2010 Express for Windows Phone.
3.5.1 Threads
The purpose of the thread task was to retrieve a count number from the user. This number was then used to spawn off a count from zero to the number desired. The response time for the task to complete was recorded. This was the first task that was developed for this thesis.
Android
Listing 3.1 shows the Android code for the thread task. This code demonstrates how the run() method was used to put the main thread to sleep in order for a background thread to count to the desired number. The biggest issue with the thread task was deciding on the logic to use in order to run the task. In the original design, the user could not set the thread count. The thread count was pre-set to 100. However, this was changed to the current state in order to make the system more dynamic and to retrieve more meaningful results from testing.
1 // r u n T h r e a d ( ) f r o m T h r e a d s A c t i v i t y . j a v a 2 p u b l i c v o i d r u n T h r e a d ( ) { 3 . . . 4 s t r R u n . s t a r t ( ) ; 5 do{ 6 t r y{ 7 Th re ad . s l e e p ( 1 ) ;
8 } 9 . . . 10 }w h i l e( s t r R u n . c o u n t != i n t S e t T h r e a d s ) ; 11 . . . 12 } 13 14 // r u n ( ) f r o m S t r i n g R u n . j a v a 15 p u b l i c v o i d r u n ( ) { 16 . . . 17 do{ 18 c o u n t ++; 19 } w h i l e( c o u n t < T h r e a d s A c t i v i t y . i n t S e t T h r e a d s ) ; 20 . . . 21 }
Listing 3.1: Android Thread Code
Windows Phone 7
Listing 3.2 shows the Windows Phone 7 code for the thread task. Listing 3.1 and 3.2 evidently show that despite the difference in programming languages, both versions of the PerformanceApp software use the exact same logic. The code for both is almost identical. 1 // r u n T h r e a d ( ) f r o m T h r e a d A c t i v i t y . xaml . c s 2 p u b l i c v o i d r u n T h r e a d ( ) { 3 . . . 4 s t r R u n T h r e a d . S t a r t ( ) ; 5 do{ 6 Th re ad . S l e e p ( 1 ) ; 7 } w h i l e ( S t r i n g R u n . gvCo unt != t h r e a d C o u n t ) ; 8 . . . 9 } 10 11 // r u n ( ) f r o m S t r i n g R u n . c s 12 p u b l i c v o i d r u n ( ) { 13 . . . 14 do{ 15 c o u n t ++; 16 } w h i l e ( c o u n t < T h r e a d A c t i v i t y . t h r e a d C o u n t ) ; 17 . . . 18 }
3.5.2 File
The purpose of the file task was to have text that was input by the user saved to a file stored in internal memory. The file was then read back from internal memory and its content displayed on the screen. This was the second task developed for the PerformanceApp software.
Android
Listing 3.3 shows how the file task was carried out on the Android version of the PerformanceApp software. The code demonstrates how the file task was performed. Overall the file task was the easiest of all the tasks on both operating systems. Time permitting, a larger file such as an image would have been used. However, for the scale of this project, the text file was sufficient.
1 // s a v e F i l e ( ) f r o m F i l e A c t i v i t y . j a v a 2 p u b l i c v o i d s a v e F i l e ( ) { 3 . . . 4 F i l e O u t p u t S t r e a m f o s = o p e n F i l e O u t p u t ( " t e x t F i l e . t x t " , C o n t e x t . MODE_PRIVATE) ; 5 O u t p u t S t r e a m W r i t e r osw = new O u t p u t S t r e a m W r i t e r ( f o s ) ; 6 B u f f e r e d W r i t e r bw = new B u f f e r e d W r i t e r ( osw ) ; 7 bw . w r i t e ( t x t F i l e T e x t . g e t T e x t ( ) . t o S t r i n g ( ) ) ; 8 . . . 9 . . . 10 } 11 12 // r e a d F i l e ( ) f r o m F i l e A c t i v i t y . j a v a 13 p u b l i c v o i d r e a d F i l e ( ) { 14 . . . 15 F i l e I n p u t S t r e a m f i s = o p e n F i l e I n p u t ( " t e x t F i l e . t x t " ) ; 16 I n p u t S t r e a m R e a d e r i s r = new I n p u t S t r e a m R e a d e r ( f i s ) ; 17 B u f f e r e d R e a d e r b r = new B u f f e r e d R e a d e r ( i s r ) ; 18 l b F i l e C o n t e n t . s e t T e x t ( b r . r e a d L i n e ( ) ) ; 19 . . . 20 . . . 21 }
Windows Phone 7
Listing 3.4 and Listing 3.3 show that the logic for the file task on both operating systems are identical. The difference in how the Android version and the Windows Phone 7 version was implemented was the method names. Although named differently, the method functionality was the same.
1 // s a v e F i l e ( ) f r o m F i l e A c t i v i t y . xaml . c s 2 v o i d s a v e F i l e ( ) { 3 I s o l a t e d S t o r a g e F i l e f i l e = I s o l a t e d S t o r a g e F i l e . G e t U s e r S t o r e F o r A p p l i c a t i o n ( ) ; 4 I s o l a t e d S t o r a g e F i l e S t r e a m s t r e a m = f i l e . C r e a t e F i l e (@" p e r f o r m A p p T e x t F i l e s / t e x t F i l e . t x t " ) ; 5 S t r e a m W r i t e r s t r e a m W r i t e r = new S t r e a m W r i t e r ( s t r e a m ) ; 6 s t r e a m W r i t e r . W r i t e ( t x t F i l e T e x t . T e x t ) ; 7 . . . 8 } 9 10 // r e a d F i l e ( ) 11 v o i d r e a d F i l e ( ) { 12 I s o l a t e d S t o r a g e F i l e f i l e = I s o l a t e d S t o r a g e F i l e . G e t U s e r S t o r e F o r A p p l i c a t i o n ( ) ; 13 . . . 14 I s o l a t e d S t o r a g e F i l e S t r e a m s t r e a m = f i l e . O p e n F i l e (@" p e r f o r m A p p T e x t F i l e s / t e x t F i l e . t x t " , F i l e M o d e . Open ) ; 15 S t r e a m R e a d e r s t r e a m R e a d e r = new S t r e a m R e a d e r ( s t r e a m ) ; 16 l b F i l e C o n t e n t . T e x t = s t r e a m R e a d e r . ReadToEnd ( ) ; 17 . . . 18 }
Listing 3.4: Windows Phone 7 File Code
3.5.3 Load
The purpose of the load task was to have the user input a number to determine how many records would be added to the database. Upon the records being added to the database, a query could then be run to retrieve all the records and have them displayed on the screen. The load task was the third and most challenging task as the imple-mentation between the two operating systems was unavoidably different. Originally the load task automatically added 1000 records to the database when opened. This was changed to allow more interaction between the user and the system.
Android
Listing 3.5 shows how the load task was performed on the Android operating system. The Android operating system used SQLite for the load task. As previously mentioned, the load task was the most difficult task to develop as both operating systems required different methods of database connectivity to complete the task. The biggest challenge was making the logic and syntax as similar as possible between both methods. As Listing 3.5 shows, methods where created in a DatabaseHandler.java class in order to carry out the functions. These methods were called in the LoadActivity.java class.
1 // a d d R e c o r d s ( ) f r o m D a t a b a s e H a n d l e r . j a v a 2 p u b l i c v o i d a d d R e c o r d s ( ) { 3 . . . 4 f o r(i n t i =1; i <=L o a d A c t i v i t y . numOfRec ; i ++){ 5 v a l u e s . p u t (KEY_COUNT, i ) ; // c o u n t 6 db . i n s e r t (TABLE_NAME, n u l l , v a l u e s ) ; 7 } 8 . . . 9 } 10 11 // g e t A l l R e c o r d s ( ) f r o m D a t a b a s e H a n d l e r . j a v a 12 p u b l i c L i s t <DBTable> g e t A l l R e c o r d s ( ) { 13 . . .
14 S t r i n g s e l e c t Q u e r y = "SELECT ∗ FROM " + TABLE_NAME ;
15 . . . 16 C u r s o r c u r s o r = db . raw Quer y ( s e l e c t Q u e r y , n u l l) ; 17 // l o o p i n g t h r o u g h a l l r o w s and a d d i n g t o l i s t 18 i f ( c u r s o r . m o v e T o F i r s t ( ) ) { 19 do { 20 . . . 21 d b t . s e t R e c o r d I D ( I n t e g e r . p a r s e I n t ( c u r s o r . g e t S t r i n g ( 0 ) ) ) ; 22 d b t . s e t C o u n t ( I n t e g e r . p a r s e I n t ( c u r s o r . g e t S t r i n g ( 1 ) ) ) ; 23 r e c o r d L i s t . add ( d b t ) ; 24 } w h i l e ( c u r s o r . moveToNext ( ) ) ; 25 } 26 . . . 27 r e t u r n r e c o r d L i s t ; 28 }
Listing 3.5: Android Load Code
Windows Phone 7
The Windows Phone 7 operating system used Linq-to-SQL for database connectivity in the load task. This differed to SQLite used for Android. Linq-to-SQL used an
instance of the DBDataContext.cs class and used predefined methods to carry out the load task. Using two different methods resulted in the load task taking the longest to develop, whereas with the majority of the other tasks, the logic for both versions was similar, if not identical, requiring only syntax changes.
1 // addRecToDB ( ) f r o m L o a d A c t i v i t y . xaml . c s 2 p u b l i c v o i d addRecToDB ( ) { 3 . . . 4 u s i n g ( v a r dc = new DBDataContext ( ) ) { 5 dc . D e l e t e D a t a b a s e ( ) ; 6 i f ( ! dc . D a t a b a s e E x i s t s ( ) ) { 7 dc . C r e a t e D a t a b a s e ( ) ; 8 } 9 . . . 10 f o r (i n t i = 1 ; i <= numOfRec ; i ++){ 11 v a r d b T a b l e = new DBTable ( ) { 12 Count = i 13 } ; 14 dc . T he Ta bl e . I n s e r t O n S u b m i t ( d b T a b l e ) ; 15 } 16 dc . S u b m i t C h a n g e s ( ) ; 17 . . . 18 } 19 } 20 21 // r u n L o a d ( ) f r o m L o a d A c t i v i t y . xaml . c s 22 p u b l i c v o i d r u n L o a d ( ) { 23 . . . 24 u s i n g ( v a r dc = new DBDataContext ( ) ) { 25 v a r d b T a b l e Q u e r y = f r o m r e c o r d i n dc . T he Ta bl e s e l e c t r e c o r d ; 26 . . . 27 L i s t <DBTable> r e c o r d L i s t = d b T a b l e Q u e r y . T o L i s t ( ) ; 28 . . . 29 } 30 }
Listing 3.6: Windows Phone 7 Load Code
3.5.4 Buffer
The purpose of the Buffer task was to have a MP3 file buffered to the device from an on-line source. The user could then request to have the MP3 played back via an instance of the Android MediaPlayer, or the Windows Phone 7 MediaElement. This was the fourth task developed for the PerformanceApp software.
Android
Listing 3.7 shows the implementation for the buffer task on the Android version of the PerformanceApp software. The Android version of the buffer task presented more challenges than the Windows Phone 7 version. With the Android version there were multiple options for media playback. Some of these were specifically for audio and some were for video. The Android MediaPlayer was selected to playback the MP3 file. Originally the buffer task was to buffer and play a video as this would have shown the effect of buffering better. Unfortunately the Android emulator does not currently support video playback, therefore it was necessary to buffer an audio track. An issue that arose while developing the buffer task on the Android operating system was determining when the MP3 file was finished buffering. This was resolved by using predefined methods for the MediaPlayer, such as the onBufferingUpdate() method.
1 // o n B u f f e r i n g U p d a t e ( ) f r o m B u f f e r A c t i v i t y . j a v a 2 p u b l i c v o i d o n B u f f e r i n g U p d a t e ( M e d i a P l a y e r a r g 0 , i n t p e r c e n t ) { 3 . . . 4 g l P e r c e n t = p e r c e n t ; 5 i f( g l P e r c e n t > 0 && g l P e r c e n t < 1 0 ) { 6 Log . d (n u l l , " b u f f e r s t a r t e d " ) ; 7 } 8 e l s e i f( g l P e r c e n t < 1 0 0 ) { 9 Log . d (n u l l , " o n B u f f e r i n g U p d a t e p e r c e n t : " + p e r c e n t ) ; 10 . . . 11 } 12 e l s e i f( g l P e r c e n t == 1 0 0 ) { 13 . . . 14 Log . d (n u l l , " b u f f e r f i n i s h e d " ) ; 15 . . . 16 } 17 } 18 19 // o n C o m p l e t i o n ( ) f r o m B u f f e r A c t i v i t y . j a v a 20 p u b l i c v o i d o n C o m p l e t i o n ( M e d i a P l a y e r a r g 0 ) { 21 . . . 22 Log . d (n u l l , " t r a c k f i n i s h e d " ) ; 23 . . . 24 } 25 26 // s e t S o u r c e ( ) f r o m B u f f e r A c t i v i t y . j a v a 27 p u b l i c v o i d s e t S o u r c e ( ) { 28 . . . 29 t r y { 30 . . . 31 mp . s e t D a t a S o u r c e ( f i l e U r l ) ; 32 . . .
33 mp . p r e p a r e ( ) ; 34 } 35 . . . 36 } 37 38 // b t n P l a y s ( ) f r o m B u f f e r A c t i v i t y . j a v a 39 b t n P l a y s . s e t O n C l i c k L i s t e n e r (new View . O n C l i c k L i s t e n e r ( ) { 40 p u b l i c v o i d o n C l i c k ( View v ) { 41 . . . 42 mp . s t a r t ( ) ; 43 . . . 44 } 45 } ) ;
Listing 3.7: Android Buffer Code
Windows Phone 7
Listing 3.8 and 3.7 reveal that the logic and methods used for carrying out the buffer task on both operating systems share striking similarities. With Windows Phone 7, the MediaElement is used to playback both audio and video, thus the code did not require modification when video playback failed on the Android version. An issue while developing the Windows Phone 7 version of the PerformanceApp software was determining when the MP3 file had completed buffering. This was solved using the predefined MediaElement method DownloadProgressChanged().
1 // myME_DownloadProgressChanged ( ) f r o m B u f f e r A c t i v i t y . xaml . c s 2 p u b l i c v o i d myME_DownloadProgressChanged (o b j e c t s e n d e r ,
R o u t e d E v e n t A r g s e ) {
3 i f (myME . D o w n l o a d P r o g r e s s == 1 . 0 0 ) {
4 . . .
5 Debug . W r i t e L i n e ( DateTime . Now + " : b u f f e r f i n i s h e d " ) ;
6 . . .
7 }
8 Debug . W r i t e L i n e ( DateTime . Now + " : b u f f e r i n g p e r c e n t : " + myME . D o w n l o a d P r o g r e s s ∗ 1 0 0 . 0 0 ) ; 9 . . . 10 } 11 12 // myME_MediaEnded ( ) f r o m B u f f e r A c t i v i t y . xaml . c s 13 p u b l i c v o i d myME_MediaEnded (o b j e c t s e n d e r , R o u t e d E v e n t A r g s e ) { 14 . . .
15 Debug . W r i t e L i n e ( DateTime . Now + " : t r a c k f i n i s h e d " ) ;
16 . . .
17 }
18
19 // s e t S o u r c e ( ) f r o m B u f f e r A c t i v i t y . xaml . c s p u b l i c v o i d s e t S o u r c e ( ) {
21 . . . 22 myME . S o u r c e = new U r i ( p l a y l i s t , U r i K i n d . R e l a t i v e O r A b s o l u t e ) ; 23 } 24 25 // b t n P l a y _ C l i c k ( ) f r o m B u f f e r A c t i v i t y . xaml . c s 26 p r i v a t e v o i d b t n P l a y _ C l i c k (o b j e c t s e n d e r , R o u t e d E v e n t A r g s e ) { 27 . . . 28 myME . P l a y ( ) ; 29 . . . 30 }
Listing 3.8: Windows Phone 7 Buffer Code
3.5.5 Cache
The purpose of the Cache task was to load a web page containing images from an Apache server. The page could be loaded with the cache enabled or disabled. This was the fifth and final task developed for the PerformanceApp software. For the scale of this thesis, loading a web page was sufficient, however if more time was available this task could be expanded. An area which would provide further research would be to use the cache memory for loading maps. The concept of using maps for the cache task was considered for this thesis. Regrettably for the time that was available this was not possible as the use of Google Maps on Android requires a special key from Google. This key must be requested from Google as it is required in to use the Google Maps API.
Android
Listing 3.9 details how the cache task was performed on the Android version of the PerformanceApp software. The Android version of the cache task was easier to develop than the Windows Phone 7 version. Android allows a developer to make changes to aspects of a devices cache, such as clear the cache. This made it possible to clear the cache in order for the web page to be loaded fresh from the Apache server when required.
2 p u b l i c v o i d c a c h e E n a b l e d ( ) { 3 . . . 4 myWebView . l o a d U r l ( s i t e ) ; 5 } 6 7 // c a c h e D i s a b l e d ( ) f r o m C a c h e A c t i v i t y . j a v a 8 p u b l i c v o i d c a c h e D i s a b l e d ( ) { 9 . . . 10 myWebView . c l e a r C a c h e (f a l s e) ; 11 . . . 12 myWebView . l o a d U r l ( s i t e ) ; 13 } 14 15 // o n P a g e F i n i s h e d ( ) f r o m C a c h e A c t i v i t y . j a v a 16 p u b l i c v o i d o n P a g e F i n i s h e d ( WebView v i e w , S t r i n g u r l ) { 17 . . . 18 Log . d (n u l l , " p a g e l o a d t i m e : " + t i m e M i l l i ) ; 19 }
Listing 3.9: Android Cache Code
Windows Phone 7
Listing 3.10 and Listing 3.9 demonstrate the similarities between both versions of the cache task. The biggest difference, and biggest challenge with the cache task was stopping the web page being saved to the cache memory of the Windows Phone 7 device. Unfortunately Windows Phone 7 does not allow developers any access to the devices cache memory, unlike Android, which allows the cache to be cleared. In order to over come this issue a way of avoiding saving to the cache memory was developed. By loading the intended page from a dummy page that redirected to the intended page allowed the it to be loaded without using the cache memory.
1 // c a c h e E n a b l e d ( ) f r o m C a c h e A c t i v i t y . xaml . c s 2 v o i d c a c h e E n a b l e d ( ) { 3 . . . 4 myWebBrowser . N a v i g a t e (new U r i ( s i t e , U r i K i n d . A b s o l u t e ) ) ; 5 } 6 7 // c a c h e D i s a b l e d ( ) f r o m C a c h e A c t i v i t y . xaml . c s 8 v o i d c a c h e D i s a b l e d ( ) { 9 . . . 10 myWebBrowser . N a v i g a t e (new U r i ( s i t e , U r i K i n d . A b s o l u t e ) ) ; 11 } 12 13 // muWebBrowser_LoadCompleted ( ) f r o m C a c h e A c t i v i t y . xaml . c s 14 p r i v a t e v o i d myWebBrowser_LoadCompleted (o b j e c t s e n d e r ,