ISSN (print): 1978-1520, ISSN (online): 2460-7258
DOI: https://doi.org/10.22146/ijccs.37415 1
Oversampling Method To Handling Imbalanced Datasets
Problem In Binary Logistic Regression Algorithm
Windyaning Ustyannie*1, Suprapto2
1
Prodi S2 Ilmu Komputer; FMIPA UGM, Yogyakarta, Indonesia
2
Departemen Ilmu Komputer and Elektronika, FMIPA UGM, Yogyakarta, Indonesia e-mail: *1 [email protected], 2 [email protected]
Abstrak
Ketidakseimbangan kelas adalah kondisi ketika salah satu kelas memiliki presentase distribusi lebihtinggi dibandingkan dengan kelas lainnya sehingga dapat mempengaruhi tingkat akurasi. Salah satu metode dalam data mining yang dapat digunakan untuk kalsifikasi yaitu metode regresi logistik. Metode yang digunakan dalam penelitian adalah metode RWO-sampling menggunakan pendekatan random replicate untuk pembangkitan data sintetik pada attribute descrete. Hasil dari penelitian dapat menangani masalah ketidakseimbangan kelas, metode RWO-sampling dengan pendekatan random replicate menunjukkan akurasi yang lebih baik dibandingkan dengan metode RWO-sampling dengan pendekatan roulette and ROS. Value akurasi untuk metode RWO-Sampling dengan pendekatan roulette and RWO-Sampling dengan pendekatan random replicate mengalami peningkatan mencapai rata-rata 15,55% dari setiap dataset. Seandgkan untuk perbandingan dengan metode ROS mengalami peningkatan mencapai rata-rata 3,7% dari setiap dataset. Selanjutnya untuk pengujian masalah underfitting dalam regresi logistik menunjukkan metode oversampling lebih baik daripada non-oversamplingdengan kenaikan value akurasi mencapai rata-rata 2,3% dari setiap dataset. Kata kunci—imbalanced datasets, RWO-sampling, Regresi Logistik
Abstract
The class imbalance is a condition when one class has a higher percentage than the other then it can affect the accuracy. One method in data mining that can be used to classification is logistic regression method. The method used in this research is RWO-sampling method using random replicate approach for synthetic data generation on descrete attribute. The result of the research can handle the problem of class imbalance, RWO-sampling method with random replicate approach shows better accuracy than RWO-sampling method with roulette and ROS approach. The accuracy value for RWO-Sampling method with roulette and RWO-Sampling approach with random replicate approach has increased to an average of 15.55% of each dataset. As for comparithem with the ROS method has increased an average of 3.7% of each dataset. Furthermore, for testing the underfitting problem in logistic regression, the oversampling method is better than non-oversampling with an increase in accuracy value reaching an average of 2.3% of each dataset..
1. INTRODUCTION
The imbalance of the data known as the imbalance class is a condition that describes an unbalanced portion of training data between a class with another class [1]. A class distribution that has a smaller percentage than any other class is called a minority class whereas a class that has a large percentage of all data is the majority class.
In the case of a class imbalance, the minority class is harder to predict that the majority class but thenmetimes the minority class has more important information. To overcome this required algorithms that can predict the right class label in order to obtain a high accuracy value [2]. One method in data mining that can handle the problem of class imbalance that is a classification method. There are several methods used in the classification process, one of the methods in the classification is Logistic Regression [3]. Logistic Regression is already proven to be a linear classification that produces a powerful classification and is very easy to apply (Lin et al., 2008). The disadvantages of Logistic Regression are vulnerable to underfitting when used on data with an unbalanced class then that it can affect accuracy.
There are three approaches for dealing with data problems with unbalanced classes, ie approaches at the data level, algorithm level and method [4]. The data-level approach consists of various resampling and data manipulation techniques to improve the inclination of class data distribution training. While at the algorithm level, the method is used to adjust the operation of existing algorithms then as to make the classifier more conductive to minority class classification. The algorithm level approach and the ensemble method have the same goal, which is to improve the classifier algorithm without altering the data.
In this research will use an oversampling method, that is RWO-Sampling with a random replicate method to generate synthetic data in discrete attribute and use Logistic Regression as the classification method. This approach is expected to overcome the problem of synthetic data generation in less optimum discrete attribute and overcome the problem of class imbalance and improve the ability of Logistic Regression as the classifier.
2. METHODS
This research was made to deal with the problems contained in the RWO-Sampling method and binary logistic regression classification algorithm. RWO-Sampling method has a problem that is less optimum in synthetic data generation on discrete attribute by using roulette approach. In contrast to previous research, this study used a random replicate approach for synthetic data generation in discrete attribute.
2.1 System description
Random Walk Oversampling (RWO-Sampling) is one of the oversampling methods used in research about imbalanced datasets. In RWO-Sampling application, this method does not function optimally to generate synthetic data on discrete attributes. From the analysis carried out, the thenlution to the problem contained in the RWO-Sampling method is to use the random replicate approach to generate synthetic data that matches the discrete attribute. Unlike the RWO-Sampling method that uses the roulette approach in this study, the random replicate approach will be used.
2.1.1 Analysis of System Structure
In this study the original dataset will be grouped according to the existing class then that it can produce majority and minority data. Data grouping is very necessary because in this study will focus on minority data only. Then the data in the minority class is defined in the discrete attribute or attribute continous. After defining the generation of synthetic data in accorandce with the stages in each attribute and repetition of a number of majority data and minority data. Then after the majority of data and minority data are balanced then, classification process using
binary logistic regression classification algorithm using accuracy measurement technique, AUC, f-measure and g-mean.
2.2 RWO-Sampling Method
The RWO-Sampling method includes an oversampling method that works by forming or generating new data from minority classes. To form new data, the RWO-Sampling method is based on the average and standard deviation of the minority class data. How RWO-Sampling works, as follows first the dataset used is grouped into minority and majority classes, calculate the difference between the majority class and minority class, defines data based on continous attribute and discrete attribute.
Then generation of synthetic data on attribute continents is done by calculating μ_i (mean) and (standard deviation) for attributes to calculate the mean and standard deviation calculation can be seen in Function (1) and Function (3).
∑ ( )
* + * + (1)
information:
( ) : attribute value to-i in sample to-j n : sum of sample ∑( ( ) ) (2) √ ∑( ( ) ) * + * + (3) information: : variance to-i : mean to-i
( ) : attribute value to-i in sample to-j
n : sum of sample
then to estimate the results using σ_i using equation 2.4.
( ) ( )
√ * + * + (4)
information:
( ) : attribute value to-i in sample to-j
: normal distribution value N(0,1) from sample j : standard deviasi sampel to-i
n : total sample
equation 3.4 is called a random walk model and used for the next step is the formation of new data in the continous attribute.
In the discrete attribute the initial step is to calculate the probability of occurrence for each value then generate synthetic data using the roulette approach.
2.3 Binary Logistic Regression
According to [5], logistic regression method is a statistical analysis method that describes the relationship between categorized response variables that have two categories (binary) or more with one or more predictor variables. The binary response variable is the response variable which is only 1 for the presence of a characteristic and 0 for the absence of these characteristics.
Logistic regression models are used to see the probability of an event and compare the risk of the occurrence of an event by calculating the factors that influence it.
Bernoulli distribution probability function as follows.
( ) ( ) (5)
where is the probability of occurrence to-i and random variables to-i. If else ( )
( ) and if else ( ) .
The logit model function lies between the range 0 and 1 obtained by using the logit function as follows:
( )
( ) (6)
( ) is a non-linear function then it needs to be transformed into logit form to obtain a linear function then that it can be seen the relationship between independent variables and non-independent variables.
Logit transform from the model in equation 2.5 as follows:
( ) [ ( ( ) )]
( ) ( ( )) ( ( ))
( ) (7)
information: : constanta
: koefisien parameter with j = 1, 2, ..., p 2.4 References
Conducting research on data with unbalanced classes [6]. The method they proposed was the oversampling method by creating class boundaries first and then generating new data from minority classes by calculating the mean and standard deviation between data. The classification algorithm used is C4.5, Naive Bayes and Neural Network. The dataset used is the Diabetes dataset. The accuracy, F-measure and G-mean methods were used to measure the performance of the proposed method and the validation method using 10-fold cross-validation.
[7] Research on data with classes is not balanced by introducing methods that create boundaries between classes and then performing random undersampling (RUS) on majority data as well as SMOTE on minority data. The dataset used comes from UCI datasets. The classification algorithm used is KNN, BP, and Naive Bayes. In this research use precision, recall, f-measure and G-mean method to measure the performance of the introduced method.
[8] conducting research on data with unbalanced classes and applying one example oversampling method ie Adaboost model. Then to delete the data in the majority class using the random undersampling (RUS) method and to generate new data in minority classes using the SMOTE method. The dataset used is the HDDT collection and KEEL collection. Classification algorithm used in this research is Neural Network and Support Vector Machine (SVM). To measure the performance of the proposed method using AUC, f-measure and G-mean and 5-fold cross validation method is used for the validation method.
[9] raised the topic of research on data with unbalanced classes. The researcher proposed a fuzzy ensemble method. Then created boundaries between classes and to generate new data from minority classes using random oversampling (ROS) method. The dataset used in this study are real-world datasets. The classification algorithm used is Support Vector Mechine (SVM). The validation method used is the 5-fold cross validation method and to measure the performance of the proposed method using G-Mean and F-Measure methods.
[10] conducting research on unbalanced classes by proposing a method of creating boundaries between classes and data that are far from the established boundaries will be eliminated. The
dataset used is real-world datasets. The classification algorithm used is Neural Network. The method for measuring the performance of the proposed method using G-mean and AUC and the validation method used is 5-fold cross-validation.
The research proposed for this is to handle data with unbalanced classes by creating boundary boundaries and using oversampling methods to generate new data from minority classes by calculating means and standard deviations between classes. The dataset used in this study is the NASA MDP and UCI Repository dataset. For the validation method using accuracy method, AUC and f-measure are used to measure the performance of the method that the researcher proposes.
3. RESULTS AND DISCUSSION
There is a dataset consisting of 4 attributes, the dataset shown in Table 1. Table 1. Example dataset
Y X1 X2 X3 X4
1 22.08 2 4 0
0 22.67 2 8 0
0 29.58 1 4 0
0 21.67 1 5 1
To know the type of attribute in the dataset, as follows: In attribute X1 to know:
value = 22.08 and | | 22 then 22.08 22 value = 22.67 and | | 22 then 22.67 22 value = 29.58and | | 22 then 29.58 29 value = 21.67and | | 22 then 22.67 21
So, the X1 attribute is defined as a continuous attribute because of all values ( ) | ( )|. For attribute X2 to know:
value = 2 and | | 2 then 2 = 2 value = 2 and | | 2 then 2 = 2 value = 1and | | 1 then 1 = 1 value = 1and | | 1 then 1 = 1
Thus, the attribute X1 is defined as a discrete attribute because of all values ( ) | ( )|. Illustration of synthetic data generation in continuous attribute
Using the dataset in Table 1 where X1 is defined as the continous attribute.
Calculate mean from attribute X1
∑ ( )
calculate variansi attribute X1
∑( ( ) )
(( ) ( ) ( )) (( ) ( ) ( )) (( ) ( ) ( )) ( )
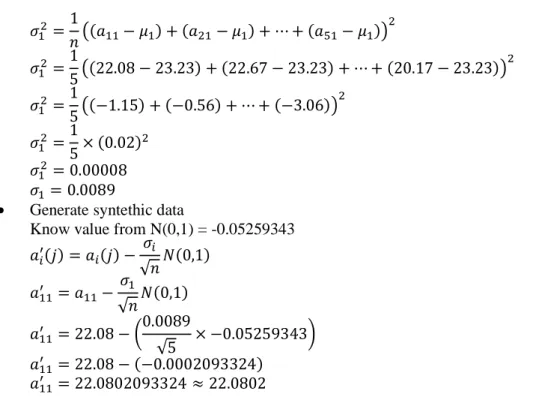
Generate syntethic data
Know value from N(0,1) = -0.05259343
( ) ( ) √ ( ) √ ( ) ( √ * ( )
Illustration of generating synthetic data in discrete attributes Using dateset in which X2 is defined as a discrete attribute.
Taking one data randomly from discrete attribute data X1 = {2,2,1,1,3}
Taken at random one piece of data from attribute X1, eg a_random = 2.
Data from the first point is then duplicated and used as synthetic data from discrete attributes.
Illustration of calculation with Logistic Regression
The dataset of the Table and uses only one iteration. Looking for value β, the steps are as follows:
Determine the initial estimated value =0
Initial esmited value =0 determined randomly, estimated value ̂ as follows: Table 1. Tabel Taksiran
0,43 0,81 0,12 0,46 0,24
Calculate value g(x), 1-g(x) and y-g(x)
Table 2. Calculate Table g(x), 1-g(x) and y-g(x)
Y X1 X2 X3 X4 g(x) y-g(x) 1-g(x)
1 22.08 2 4 0 20.39 -19.39 -19.39
0 22.67 2 8 0 22.28 -22.28 -21.28
0 29.58 1 4 0 25.92 -25.92 -24.92
1 21.67 1 5 1 20.21 -19.21 -19.21
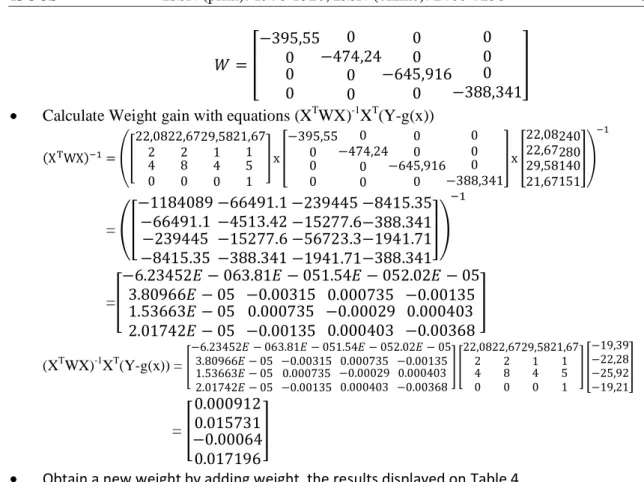
Calculate matriks W, is a diagonal matrix containing intermediate product multiplication g(x) * (1-g(x))
[ ] Calculate Weight gain with equations (XTWX)-1XT(Y-g(x))
( ) (* + [ ] [ ]) = (* +) =* + (XTWX)-1XT(Y-g(x)) =* + * + [ ] = * +
Obtain a new weight by adding weight, the results displayed on Table 4. Table 3. Value 0,43 0,43 0,81 0,000912 0,810912 0,12 0,015731 0,135731 0,46 -0,00064 0,45936 0,24 0,017196 0,257196 Then calculated using the formula as in equation 2.6, the result as follows:
The value of β is known (the results of the iteration calculation using the program until the conditions are met) and x as follows:
= 0,810912; = 0,135731; = 0,45936; = 0,257196; = 20.17; =2; =6; =1. Then do the calculation using as follows:
( )
= ( ( ( ) ( )
( ) ( ))
= 0,99
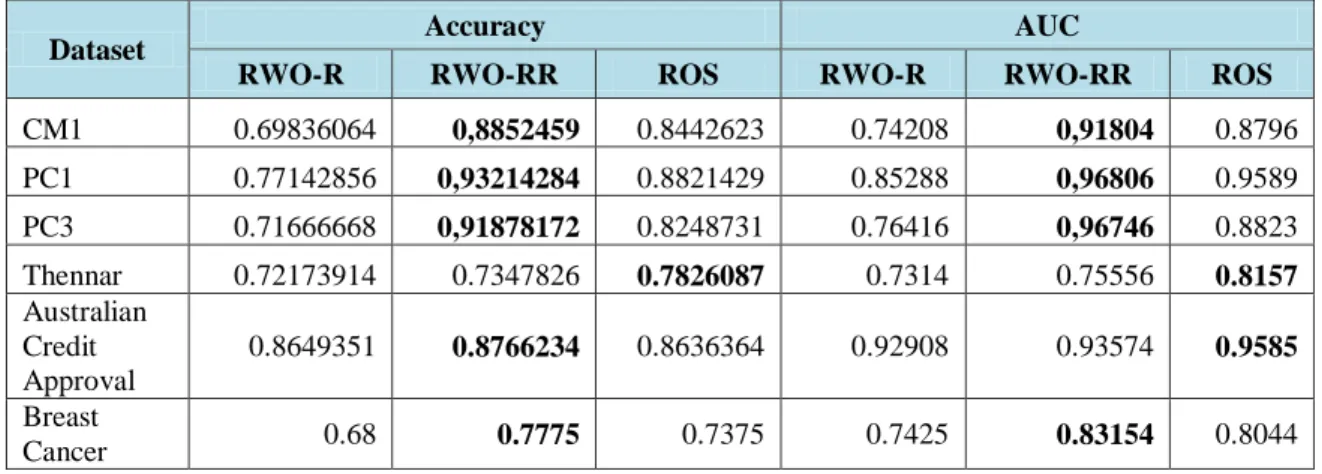
Table 4. Comparison of Test Results (Accuracy and AUC) Three Methods using the Logistic Regression Classification Algorithm
Dataset Accuracy AUC
RWO-R RWO-RR ROS RWO-R RWO-RR ROS
CM1 0.69836064 0,8852459 0.8442623 0.74208 0,91804 0.8796 PC1 0.77142856 0,93214284 0.8821429 0.85288 0,96806 0.9589 PC3 0.71666668 0,91878172 0.8248731 0.76416 0,96746 0.8823 Thennar 0.72173914 0.7347826 0.7826087 0.7314 0.75556 0.8157 Australian Credit Approval 0.8649351 0.8766234 0.8636364 0.92908 0.93574 0.9585 Breast Cancer 0.68 0.7775 0.7375 0.7425 0.83154 0.8044
Table 5. Comparison of Test Results (F-measure and G-mean) Three Methods using Logistik Regression Classification Algorithm
Dataset F-measure G-mean
RWO-R RWO-RR ROS RWO-R RWO-RR ROS
CM1 0.70195268 0,891238 0.8288288 0.70332514 0,88960622 0.8534245 PC1 0.764734 0,9342422 0.8808664 0.7659075 0,9336262 0.8822804 PC3 0.7278616 0,92266314 0.8188976 0.72861746 0,92216082 0.8260134 Thennar 0.7322862 0.74054084 0.7916667 0.7336352 0.74158712 0.7843711 Australian Credit Approval 0.86838602 0.87341716 0.8627451 0.8693592 0.87393052 0.8636848 Breast Cancer 0.67101438 0.78711938 0.7407407 0.67157474 0.78152748 0.7376246
Table 7. Accuracy and AUC Results from Non-Oversampling and Oversampling Methods using Logistic Regression Classification Algorithm
Dataset Accuracy AUC non-oversampling oversampling non-oversampling Oversampling CM1 0,8571429 0,8852459 0,7778 0,91804 PC1 0,8954248 0,93214284 0,7852 0,96806 PC3 0,8844444 0,91878172 0,8162 0,96746 Thennar 0,744186 0,7347826 0,7467 0,75556 Australian Credit Approval 0,8705036 0,8766234 0,9552 0,93574 Breast Cancer 0,754386 0,7775 0,7162 0,83154
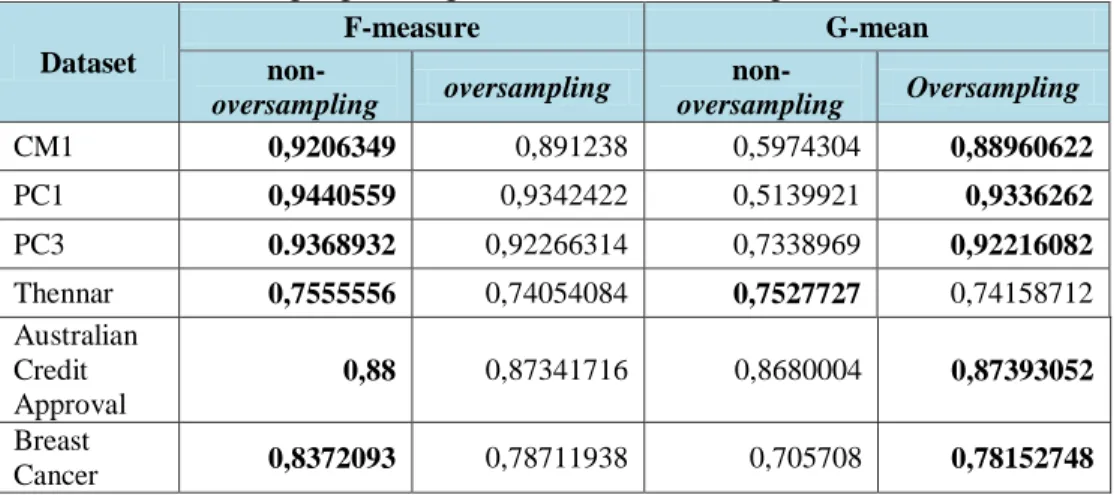
Table 8. The result of f-measure and g-mean from non-oversampling and oversampling method using logistic regression classification algorithm
Dataset F-measure G-mean non-oversampling oversampling non-oversampling Oversampling CM1 0,9206349 0,891238 0,5974304 0,88960622 PC1 0,9440559 0,9342422 0,5139921 0,9336262 PC3 0.9368932 0,92266314 0,7338969 0,92216082 Thennar 0,7555556 0,74054084 0,7527727 0,74158712 Australian Credit Approval 0,88 0,87341716 0,8680004 0,87393052 Breast Cancer 0,8372093 0,78711938 0,705708 0,78152748 4. CONCLUSIONS
Based on the results obtained, then got the following conclusion: Based on the comparison of RWO-Sampling method with roulette approach, RWO-Sampling with random replicate and Random Oversampling (ROS) approach proved that RWO-Sampling performance with random replicate approach resulted in more classification The Values accuracy for the RWO-Sampling method with the roulette and RWO-Sampling approach with the random replication approach experienced an increase of 15.55% on average of each dataset. As for the RWO-sampling method with a random replicateand approach the ROS value accuracy method has increased to an average of 3.7% of each dataset. The comparison of non-oversampling and oversampling methods shows that the oversampling method is proven to produce better classification with an increase in accuracy value reaching an average of 2.3% of each dataset. This proves that the logistic regression algorithm is susceptible to overfitting if used in unbalanced datasets.
REFERENCES
[1] H. He and Y. Ma, Imbalanced Learning: Foundations, Algorithms, and Applications, pp. 101-149, John Wiley & Thenns, New Jersey, 2014.
[2] J. A. Sáez, J. Luengo, J. Stefanowski and F. Herrera, SMOTE – IPF : Addressing the noisy and borderline examples problem in imbalanced classification by a re-sampling method with filtering, pp. 184–203, https://doi.org/10.1016/j.ins.2014.08.051, 2015. [3] I. H. Witten, F. Eibe, and M. A. Hall, Data Mining : Practical Machine Learning Tools
and Techniques,3rd Edition, Elsevier, United States, 2011.
[4] P. Harrington, Machine Learning in Action, Manning Publications Co, 2012.
[5] B. W. Yap, K. A. Rani, H. A. A. Rahman, S. Fong, Z. Khairudin, and N. N. Abdullah, An Application of Oversampling, Undersampling,Bagging and Boosting in Handling Imbalanced Datasets, (eds) Proceedings of the First International Conference on Advanced Data and Information Engineering (DaEng-2013), Lecture Notes in Electrical Engineering, vol. 285, Springer, Singapore, 2014.
[6] H. Zhang and M. Li, RWO-Sampling: A Random Walk Over-sampling Approach to Imbalanced Data Classification, Information Fusion, vol. 20(1), pp. 99–116, 2014.
[7] Y. Qian, Y. Liang, M. Li, G. Feng, and X. Shi, A Resampling Ensemble Algorithm for Classification of Imbalance Problems, Neurocomputing, vol. 143, pp. 57–67, http://doi.org/10.1016/j.neucom.2014.06.021, 2014.
[8] J. F. Díez-Pastor, J. J. Rodríguez, C. García-Othenrio, and L. I. Kuncheva, Random Balance: Ensembles of Variable Priors Classifiers for Imbalanced Data, Knowledge Based Systems, vol. 85, pp. 96–111, 2015.
[9] H. L. Dai, Class Imbalance Learning Via a Fuzzy Total Margin Based Support Vector Machine, Applied Thenft Computing, vol. 31, pp. 172–184, 2015.
[10] Q. Fan, Z. Wang, and D. Gao, One-sided Dynamic Undersampling No-Propagation Neural Networks for imbalance problem, Engineering Applications of ArtificialIntelligence, vol. 53, pp. 62–73, 2016.