Borderline Over-sampling for Imbalanced Data
Classification
Hien M. Nguyen
∗, Eric W. Cooper
†, Katsuari Kamei
† ∗Graduate School of Science and Engineering, Ritsumeikan University †College of Information Science and Engineering, Ritsumeikan University1-1-1 Noji Higashi, Kusatsu, Shiga 525-8577, Japan email:{hiennm, cooper, kamei}@spice.ci.ritsumei.ac.jp
Abstract—Traditional classification algorithms, in many times, perform poorly on imbalanced data sets in which some classes are heavily outnumbered by the remaining classes. For this kind of data, minority class instances, which are usually much more of interest, are often misclassified. The paper proposes a method to deal with them by changing class distribution through over-sampling at the borderline between the minority class and the majority class of the data set. A Support Vector Machines (SVMs) classifier then is trained to predict new unknown instances. Compared to other over-sampling methods, the proposed method focuses only on the minority class instances lying around the borderline due to the fact that this area is most crucial for establishing the decision boundary. Furthermore, new instances will be generated in such a manner that minority class area will be expanded further toward the side of the majority class at the places where there appear few majority class instances. Experimental results show that the proposed method can achieve better performance than some other over-sampling methods, especially with data sets having low degree of overlap due to its ability of expanding minority class area in such cases.
I. INTRODUCTION
Imbalanced data sets can be observed in many practical application domains such as detection of fraudulent credit card transactions [5], detection of oil spills in satellite radar images [13], diagnosing rare diseases, text categorization, and so on [2]. In data sets like that, some classes are heavily outnumbered by the remaining classes. For simplicity, this paper, however, will consider only two-class data sets with one minority class and one majority class. By convention, minority class instances will be treated as positive ones and majority class instances as negative ones. This is because we usually pay much more attention to minority class instances like can-cer patients in medical diagnosis and fraudulent transactions in the detection of credit card frauds. However, traditional classification algorithms usually fail in the detection of such rare, but important, cases.
The main reason underlying performance degradation of traditional learning methods is that they concentrate on opti-mizing overall accuracy to which minority class instances con-tribute just a little in comparison with overwhelming majority class instances. Consider the example with a data set including 98 negative instances but only two positive instances. A trivial learning algorithm may simply assign all these instances to the negative class in order to acquire 98 percent accuracy. A ”good” accuracy like that, however, could be useless when
the system already made a serious mistake, for example, in diagnosing a cancer, which poses life threatening, as a non-cancer.
Class imbalance is possibly the most noticeable factor that explains for poor performance of many standard classification methods. However, other aspects should also be considered. Data imbalance can be divided into between-class and within-class imbalance. The latter means that minority and majority class instances can be scattered in a number of imbalanced data sub-groups. Some researchers observed that class imbal-ance may not be a direct reason but usually lead to more direct reasons like small disjuncts formed within the minority class [10], [11], [19]. Therefore, dealing with small disjuncts may help improve performance on minority class instances significantly. Besides that, the effect of small classes can be reduced when the distance between classes is large [15], [21]. Many solutions for dealing with imbalanced data sets have been proposed. Some methods perform at data processing level with the aim at re-balancing the data by adding new instances into the minority class or removing a number of instances from the majority class. Other methods modify existing clas-sification algorithms to be more suitable for imbalanced data sets.
In this paper, we focus on over-sampling methods with SVMs as base classifiers to deal with the data imbalance problem. For our approach, artificial minority class instances will be generated around the borderline between the two data classes. This is because of the fact that borderline instances are most prone to be misclassified, and hence crucial for es-timating the optimal decision boundary. Focusing re-sampling on this area potentially makes more benefit than performing on the whole minority class. One noteworthy feature of the proposed method is that it can help expand the minority class to the areas where the density of majority class instances is not so high. With this approach, minority class instances can be recognized even at the regions near the boundary where there do not exist any representative of them in the training set.
The remainder of the paper is organized as follows. Section II introduces some works related to our research. The basics of Support Vector Machines and their problem with imbalanced data sets are given in Section III. Our approach and exper-imentation are described in Section IV and V, respectively.
Fifth International Workshop on Computational Intelligence & Applications
Section VI concludes the paper.
II. RELATEDWORKS
Methods dealing with imbalanced data sets can be cate-gorized into two main groups. The first group performs at the data level in order to change the class distribution of the data set. The second group modifies existing classification algorithms. Data processing methods can be divided smaller into over-sampling and under-sampling methods. The simplest form of over-sampling is to duplicate minority class instances. Although it helps reduce the degree of imbalance between the two classes, this method can lead to the overfitting problem due to so many instances lying at the same location. More intelligent over-sampling strategies have also been proposed that one of the most popular methods is SMOTE [7]. In this approach, synthetic minority class instances are randomly cre-ated on the line segments joining each minority class instance with a number of its nearest neighbors. SMOTE may be more useful than over-sampling with duplication because it makes denser the minority class instances that are inherently very sparse. Some other methods perform over-sampling on the borderline area such as Borderline-SMOTE [9]. This method evaluates a minority class instance being qualified for over-sampling with the SMOTE technique if more than a half of itsmnearest neighbors come from the majority class. Another approach applies SMOTE only for the minority class support vectors obtained after training Biased-SVMs [18].
A number of under-sampling methods have also been proposed. Under-sampling can be conducted simply just by removing some majority class instances at random until ac-quiring a desired imbalance degree. Under-sampling, however, can lead to loss of some valuable information. More advanced under-sampling techniques enable to identify less important majority class instances to be eliminated. For example, Kubat and Matwin [12] utilized some criteria to exclude redundant, boundary and noisy majority class instances.
Other techniques combine both over-sampling and under-sampling. Batista et al [3] proposed to apply SMOTE after performing a data cleaning (i.e., under-sampling) method such as Tomek links and the Wilson’s Edited Nearest Neighbor Rule. Liu at al [14] over-sampled the minority class with SMOTE to some extent, then under-sampled the majority class a number of times to create bootstrap samples having the same or similar size with the over-sampled minority class.
Some researchers have also used the approach of data decomposition. Cieslak and Chawla [8] used a supervised clustering technique to divide the training set, then apply sampling locally for each individual cluster of the data set. Jo and Japkowicz [11] partitioned the minority and majority classes separately using the k-means algorithm, then over-sampled the clusters by duplication in order to re-balance class distribution as well as inflating small disjuncts of the minority class to counter within-class imbalance. Wu et al [21] also partitioned classes using k-means to reduce concept complexity of large classes, then re-labeled the data according to newly created clusters and converted the original problem
into a new multi-class problem whose each class corresponds to a cluster.
Besides sampling, there exist methods that directly modify the standard classification algorithms themselves. Veropoulos et al [17] reformulated the standard SVMs algorithm to assign different misclassification costs to positive and negative instances. For a realistic example, in the field of cancer diagnosis, a cancer that is misclassified as a non-cancer should be assigned much higher cost than the case of a non-cancer being wrongly diagnosed as a cancer. Such approaches are called cost-sensitive learning. Raskutti and Kowalczyk [16] conducted one-class SVMs to learn only from positive class instances. Wu and Chang [20] proposed the kernel boundary alignment algorithm that changes kernel matrix in order to conduct a (quasi) conformal transformation from input space into feature space where the area around the decision boundary is magnified more than the remaining areas. Akbani et al [1] used the approach of combining SMOTE with cost-sensitive learning that may help create a more well-defined decision boundary than using just cost-sensitive learning.
III. SUPPORTVECTORMACHINES ANDIMBALANCED DATACLASSIFICATION
A. Support Vector Machines
The objective of the training of Support Vector Machines (SVMs) is to find the optimal hyperplane that separates the positive and negative classes with a maximum margin. The central idea underlying this method is to perform a mapping Φfrom the input space into a (usually) very high dimensional feature space where the data become easier to be linearly separated [4]. This mapping can be performed by a kernel trick. There exist a variety of kernels that can be selected.
Consider the training set{(xi, yi)}, i= 1, . . . , N wherexi is a training instance andyi∈ {+1,−1}is its corresponding true label. The primal SVMs problem is defined by
Minimize: 1 2kwk 2+CX i ξi (1) subject to: yi(w·Φ(xi) +b)≥1−ξi,∀i ξi≥0,∀i
where w and b are the weight vector and the bias of the separating hyperplane;ξiindicates degree of location violation of the i-th training instance; and C is the parameter chosen by the user to penalize mislocated training instances.
In Equation (1), minimization of the first and second terms corresponds to maximizing the margin and minimizing the training error, respectively. Therefore, parameterC allows to make a trade-off between these two factors. A smaller value ofC means that we would like to have a larger margin at the cost of more training errors, and vice versa. The dual form of the primal problem above is as follows:
Fig. 1. The learned decision boundary (the solid curve) is skewed toward the minority class. Symbols ”+” and ”−” denote minority and majority class instances, respectively. The dashed line indicates the ideal boundary.
Maximize: X i αi− 1 2 X i,j αiαjyiyjK(xi,xj) subject to: 0≤αi≤C,∀i X i αiyi= 0
where αi’s are the Lagrangian multipliers corresponding to training instances; and K(xi,xj) = Φ(xi)·Φ(xj)is a kernel function that enables to compute dot products in the feature space without knowing theΦmapping. The training instances with αi >0 are called support vectors. They are the critical elements of the training set, and lie closest to the decision boundary; if all other training instances were removed, the same separating hyperplane would be found [4].
B. SVMs and Imbalanced Data Classification
It was shown in [10] that SVMs are not sensitive to the class imbalance problem because they base their classification on a small number of support vectors; and a large quantity of training data can be considered redundant. Therefore, SVMs should be a good choice for dealing with imbalanced data sets. In fact, however, SVMs are still affected by the data imbalance to some extent [1]. Because of the sparseness of minority class instances, the chance to observe them near the ideal decision boundary is low compared to majority class instances. This also means that the learned decision boundary will be skewed toward the side of the minority class (Fig. 1). Furthermore, the standard SVMs algorithm does not treat in different ways to misclassifications on minority and majority class instances. When the two classes are too close to each other, SVMs can choose to sacrifice all of the minority class instances to achieve absolute accuracy on majority class instances. Consequently, the learned decision boundary again is moved further toward the minority class.
For the two problems described above, the first one can be solved by approximating the ideal boundary with an interpola-tion technique as proposed in [20], while the second one can be overcome by using different parameters C [17], say C+ and C−, for the minority and majority classes in whichC+ is selected greater than C− depending on the degree of data imbalance.
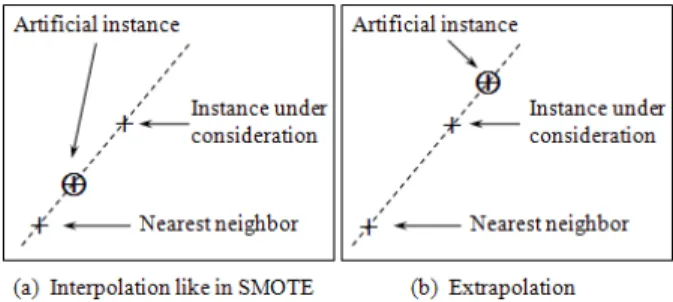
Fig. 2. Utilize interpolation (a) and extrapolation (b) techniques to create artificial instances.
Fig. 3. Using only interpolation (a) may be not as good as combining both interpolation and extrapolation (b). Symbol⊕denotes artificial positive instances.
IV. OURMETHOD
To deal with imbalanced data sets, we propose a new over-sampling method. Artificial minority class instances will be generated along the decision boundary due to the fact that instances in this area are very critical for estimating the optimal decision boundary. Sampling on the entire of the minority class may not be necessary. Focusing just on the borderline area has been shown to achieve better performance [9], [18]. In our approach, the borderline area is approximated by the support vectors obtained after training a standard SVMs classifier on the original training set. New instances will be randomly created along the lines joining each minority class support vector with a number of its nearest neighbors using the interpolation (Fig. 2a) or extrapolation (Fig. 2b) technique depending on the density of majority class instances around it. If majority class instances count for less than a half of its nearest neighbors, new instances will be created with extrapolation to expand minority class area toward the majority class. This expansion can be achieved because the direction of extrapolating may go from the inside (the neighbor instance) to the outside (the borderline instance under consideration) of the area occupied by minority class instances. In opposite case, because of the crowdedness of majority class instances, instead of expanding area, the current boundary area of the minority class will be consolidated in the way similar to SMOTE. A different point of the proposed method compared to SMOTE is that new instances will be created in the order of the first to the k-th nearest neighbor instead of randomizing the selection of a nearest neighbor. Specific steps of our algorithm are described
as below:
Algorithm:BorderlineOversampling(X,N,k,m)
Input:
• X: Training set
• N: Sampling level (100, 200, 300, ... percent) • k: Number of nearest neighbors like in SMOTE
• m: Number of nearest neighbors to decide sampling type
(interpolation or extrapolation)
Output:
• Xnew: Over-sampled training set
Variables:
• SV+: Set of positive support vectors (SVs)
• T: Total number of artificial instances to be created
• amount: Array contains the amount of artificial instances corresponding to each positive SV
• nn: Array containskpositive nearest neighbors of each positive
SV
Begin
1) T←(N/100)× |X|
2) Compute SV+by training SVMs onX
3) Compute amountby evenly distributingT amongSV+ 4) Compute nn
5) For eachsv+i ∈SV
+
, computem nearest neighbors on X. If less than a half of the m nearest neighbors come from the negative class, along the lines joining sv+i with its k
positive nearest neighbors (in the first tok-th nearest neighbor order), createamount[i]artificial positive instances using the following formula (extrapolate to expand positive class area):
x+new=sv
+
i +ρ(sv
+
i −nn[i][j])
wherenn[i][j] is the j-th positive nearest neighbor ofsv+i; ρis a random number in the range[0,1]. Otherwise, use the following formula (interpolate like in SMOTE to consolidate the current boundary area of the positive class):
x+new=sv + i +ρ(nn[i][j]−sv + i) 6) Xnew=X∪ {x+new} End
The range [0, 1] of parameter ρ in the algorithm above means that for the case of using extrapolation, new instances will go far away from the minority instance under consider-ation with a distance not exceed the distance between it and its corresponding nearest neighbor.
In summary, our method consists of some main character-istics as follows: (1) Over-sample the minority class to reduce data imbalance. (2) Sampling is concentrated on the most critical area, i.e., the boundary area. (3) Use extrapolation to expand minority class area at the places where there exist fewer majority class instances; this also means it helps increase the chance to see minority class instances near the ideal boundary (see Subsection III-B). Therefore, the learned decision boundary can be pushed closer to the ideal decision boundary compared to the usage of only interpolation like in SMOTE (Fig. 3).
V. EXPERIMENTATION
A. Data Sets
In this experimentation, we used six data sets from the UCI machine learning repository [2] including Spect(0), Glass(7),
TABLE I
SIXUCIDATA SETS THAT WERE USED FOR THE EXPERIMENTATION. Data set Attributes No. of data Imbalance
Spect 22 267 4 Glass 9 214 6 Vowel 10 528 + 462 10 Yeast 8 1484 28 Abalone 8 4177 35 Page-blocks 10 5473 61 TABLE II
SAMPLING LEVELS(NUMBERS IN PARENTHESES DENOTE IMBALANCE DEGREES)
Data set Sampling levels (%) Spect (4) 100, 200, 300 Glass (6) 100, 200, 300, 400, 500 Vowel (10) 100, 300, 500, 700, 900 Yeast (28) 100, 500, 1000, 1500, 2000, 2500, 2700 Abalone (35) 100, 500, 1000, 1500, 2000, 2500, 3000, 3400 Page-blocks (61) 100, 1000, 2000, 3000, 4000, 5000, 6000
Vowel(0), Yeast(5), Abalone(5) and Page-blocks(4). Numbers in parentheses indicate which class was chosen as positive class; and all of the remaining classes were combined to create a negative class. These data sets are described in Table I. Note that data sets Spect and Vowel were already divided into training and test sets on the UCI repository. For Vowel, the training set consists of English vowels data gathered from speakers numbered 0-47, and the test set from speakers 48-89. For Spect, the training and test sets have different level of data imbalance; in fact the training data is balanced. Therefore, we decided to combine them so that the resulted data set can be split again later with the same imbalance in the both training and test sets.
B. Experimental Results
We compared the proposed method Borderline Over-sampling(BOS) with the standard SVMs method (SVM) and some other over-sampling methods including over-sampling by duplication (OSD) and SMOTE. A version of SMOTE (B-SMOTE) that works only on borderline minority class instances was also implemented. These borderline instances are approximated by the support vectors obtained after training a standard SVMs classifier on the original data set. Numbers of nearest neighbors that are used in SMOTE, B-SMOTE and BOS were all set to five. We used the package LIBSVM [6] for training SVMs classifiers with the Gaussian RBF kernel.
We know that overall accuracy is not appropriate for
TABLE III
AVERAGEg-meanOVER ALL THE SAMPLING LEVELS.
Data set SVM OSD SMOTE B-SMOTE BOS
Spect 56.6% 57.0% 61.2% 61.6% 65.4% Glass 93.2% 87.2% 90.3% 91.3% 91.3% Vowel 79.9% 39.6% 57.9% 56.5% 84.3% Yeast 31.4% 49.1% 55.1% 58.3% 58.2% Abalone 4.2% 65.2% 68.2% 68.1% 70.9% Page-blocks 90.2% 91.0% 92.1% 92.3% 92.0% Average 59.3% 64.8% 70.8% 71.3% 77.0%
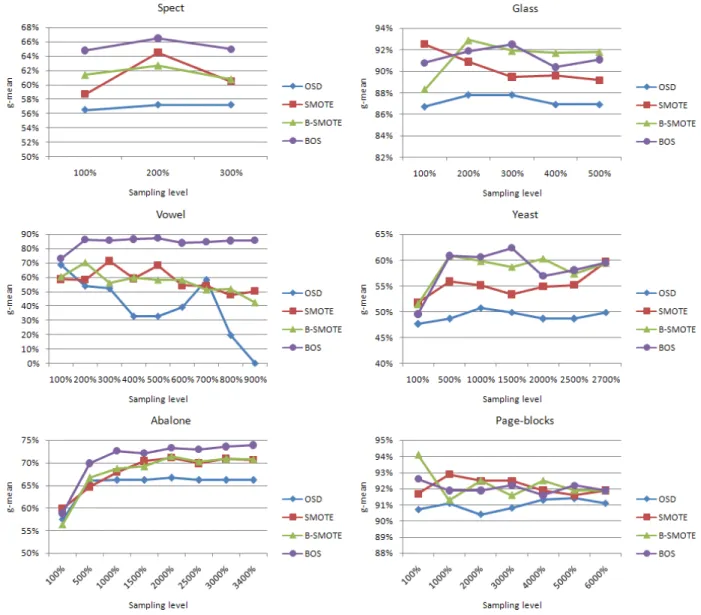
Fig. 4. Theg-meanperformance on the six UCI data sets at different sampling levels.
Fig. 5. Averageg-meanperformance over all the sampling levels.
evaluating classification performance on imbalanced data sets (see Section I). In this paper, we used g-mean metric that
is proposed in [12] as √Acc+×Acc−, where Acc+ and Acc− are the accuracy on the positive and negative classes, respectively. We select this metric because it does not depend on the class distribution of the training set.
In order to reduce the effect of randomness in the division of data and sampling, each method was run ten times, and then average g-meanperformance was calculated. Each run con-sists of: (1) randomly splitting the data set (except Vowel) into training and test sets with the ratio 4:1 so as to have the same negative to positive ratio in the both sets; (2) over-sampling the training data; (3) performing 5-fold cross-validation on the over-sampled training data to estimate optimal parameters C and γ of the kernel function; (4) training SVMs classifier; and finally (5) predicting on the test set. Sampling levels were selected according to the imbalance ratio of each data set. The minority class is over-sampled from 100% to the highest level for which the two classes will become to have the same or similar size after over-sampling. Thus, the highest sampling
TABLE IV
AVERAGE MAJORITY CLASS NEAREST NEIGHBOR PROPORTION OF MINORITY CLASS INSTANCES.
Data set Proportion Data set Proportion
Spect 45% Yeast 73%
Glass 21% Abalone 74%
Vowel 0% Page-blocks 31%
levels for the six data sets in turn are 300%, 500%, 900%, 2700%, 3400% and 6000% (Table II).
Experimental results are given in Fig. 4. For three data sets Spect, Vowel and Abalone, our method BOS outperforms the other over-sampling methods at almost all the sampling levels. For the remaining data sets Glass, Yeast and Page-blocks, BOS is rather competitive with other methods. We also calculated averageg-meanfor each method over all the sampling levels and report them in Table III. For convenience, a bar graph is also given in Fig. 5. We can see that overall, BOS achieves the best g-mean performance among the experimented methods. One remarkable point in this experimentation is that the performance of all the methods on Page-blocks data set is very good (above 90%) although the imbalance ratio of this data set is highest (61:1). This is because class imbalance is not the only factor affecting classification performance. As mentioned in Section I, there may exist other factors that also make impact to the classification of imbalanced data sets such as the distance between classes and small disjuncts within the minority class. To understand this problem more clearly, we conducted a more experiment to evaluate the degree of sepa-ration between the minority and majority classes. Specifically, we computed average proportion of majority class nearest neighbors in the total number of five nearest neighbors of each minority class instance. The calculated results are given in Table IV. We can realize that the nearness of different labeled instances in Page-blocks (31%) is relatively low compared to other data sets. In other words, the data in Page-blocks are quite separable, and this can explain for the good performance on it even without over-sampling. The values for Yeast and Abalone are highest with 73% and 74%, respectively, so that the performance of standard SVMs on them is very poor (Fig. 5). For Vowel data set, the value of 0% means that its classes are almost separable. Note that the BOS method achieved best on Vowel in comparison to other methods. This result is possibly due to the ability of BOS to expand minority class area more strongly on the data sets with low degree of overlap.
VI. CONCLUSIONS
We have proposed a borderline over-sampling method for dealing with imbalanced data sets. It has been shown that this method can solve rather effectively the data imbalance problem compared to several other over-sampling methods. Instead of sampling on the entire of the minority class, our method focuses only on the borderline area where is most critical for establishing the decision boundary. Furthermore, sampling is performed in such a way that the areas of the minority class with the presence of fewer majority class instances will be
ex-panded by using extrapolation technique, otherwise boundary areas will be consolidated with interpolation technique. Due to the ability of expanding area, the proposed method has proved more effective with data sets having low degree of overlap.
REFERENCES
[1] R. Akbani, S. Kwek and N. Japkowicz. Applying Support Vector Ma-chines to Imbalanced Datasets. InProceedings of the Fifteenth European Conference on Machine Learning, pp. 39-50, 2004.
[2] A. Asuncion and D. J. Newman. UCI Machine Learning Repository. University of California at Irvine, School of Information and Computer Science, 2007.
[3] G. E. A. P. A. Batista, R. C. Prati and M. C. Monard. A Study of the Behavior of Several Methods for Balancing Machine Learning Training Data.ACM SIGKDD Explorations Newsletter, Vol. 6(1), 2004. [4] C. J. C. Burges. A Tutorial on Support Vector Machines for Pattern
Recognition. Data Mining and Knowledge Discovery, Vol. 2, pp. 121-167, 1998.
[5] P. K. Chan and S. J. Stolfo. Toward Scalable Learning with Non-uniform Class and Cost Distributions: A Case Study in Credit Card Fraud Detection. InProceedings of the Fourth International Conference on Knowledge Discovery and Data Mining, pp.164-168, 1998. [6] C. C. Chang and C. J. Lin. LIBSVM: A Library for Support Vector
Machines. 2001. Software available at http://www.csie.ntu.edu.tw/∼cjlin/ libsvm.
[7] N. V. Chawla, K. W. Bowyer, L. O. Hall and W. P. Kegelmeyer. SMOTE: Synthetic Minority Over-sampling Technique.Journal of Artificial Intel-ligence Research, Vol. 16, pp. 321-357, 2002.
[8] D. A. Cieslak and N. V. Chawla. Start Globally, Optimize Locally, Predict Globally: Improving Performance on Imbalanced Data. InProceedings of the Eighth IEEE International Conference on Data Mining, pp. 143-152, 2008.
[9] H. Han, W. Y. Wang and B. H. Mao. Borderline-SMOTE: A New Over-Sampling Method in Imbalanced Data Sets Learning. In Proceedings of the International Conference on Intelligent Computing, pp. 878-887, 2005.
[10] N. Japkowicz and S. Stephen. The Class Imbalance Problem: A Sys-tematic Study.Intelligent Data Analysis, Vol. 6(5) pp. 429-449, 2002. [11] T. Jo and N. Japkowicz. Class Imbalances versus Small Disjuncts.ACM
SIGKDD Explorations Newsletter, Vol. 6(1) pp. 40-49, 2004.
[12] M. Kubat and S. Matwin. Addressing the Curse of Imbalanced Training Sets: One-Sided Selection. InProceedings of the Fourteenth International Conference on Machine Learning, pp. 179-186, 1997.
[13] M. Kubat, R. C. Holte and S. Matwin. Machine Learning for the Detection of Oil Spills in Satellite Radar Images. Machine Learning, Vol. 30(2-3), pp. 195-215, 1998.
[14] Y. Liu, A. An and X. Huang. Boosting Prediction Accuracy on Im-balanced Datasets with SVM Ensembles. In Proceedings of the Tenth Pacific-Asia Conference on Knowledge Discovery and Data Mining, pp. 107-118, 2006.
[15] R. C. Prati, G. E. A. P. A. Batista and M. C. Monard. Class Imbalances versus Class Overlapping: An Analysis of a Learning System Behavior. In Proceedings of the Mexican International Conference on Artificial Intelligence, pp. 312-321, 2004.
[16] B. Raskutti and A. Kowalczyk. Extreme Rebalancing for SVMs: A Case Study.ACM SIGKDD Explorations Newsletter, Vol. 6(1), pp. 60-69, 2004. [17] K. Veropoulos, C. Campbell and N. Cristianini. Controlling the Sensi-tivity of Support Vector Machines. InProceedings of the International Joint Conference on Artificial Intelligence, pp. 55-60, 1999.
[18] H. Y. Wang. Combination Approach of SMOTE and Biased-SVM for Imbalanced Datasets. InProceedings of the International Joint Confer-ence on Neural Networks, pp. 228-231, 2008.
[19] G. M. Weiss. Mining with Rarity: A Unifying Framework. ACM SIGKDD Explorations Newsletter, Vol. 6(1), pp. 7-19, 2004.
[20] G. Wu and E. Y. Chang. KBA: Kernel Boundary Alignment Considering Imbalanced Data Distribution. IEEE Transactions on Knowledge and Data Engineering, Vol. 17(6), pp. 786-795, 2005.
[21] J. Wu, H. Xiong, P. Wu and J. Chen. Local Decomposition for Rare Class Analysis. InProceedings of the Thirteenth International Conference on Knowledge Discovery and Data Mining, pp. 814-823, 2007.