TVE 14 014 maj
Examensarbete 15 hp
Juni 2014
AC vs DC in Data centers
A case study in a Data Center in Eskilstuna
operated by DC
Björn Andreassen
Samer David
Teknisk- naturvetenskaplig fakultet UTH-enheten Besöksadress: Ångströmlaboratoriet Lägerhyddsvägen 1 Hus 4, Plan 0 Postadress: Box 536 751 21 Uppsala Telefon: 018 – 471 30 03 Telefax: 018 – 471 30 00 Hemsida: http://www.teknat.uu.se/student
Abstract
AC vs DC in Data Centres
Björn Andreassen, Samer David, Niklas Hansen
The Swedish Energy Agency in Eskilstuna has installed solar cell parks on the roof of their office complex. They used a DC system to transfer the power from the solar cells to the data center. This report examines how much energy the solar cell system delivers while running on DC and AC. Previous studies show that it is more efficient to run a data center connected to solar cells with DC and therefore a greater amount of surplus energy are delivered compared to an AC system. This report study implementation and installment cost of a DC system with an existing AC system to determine which of the two options is most profitable in the long run. When adding the cost for the reconstruction of an existing AC system to a DC system the investment will not be earned during a lifespan of the solar cells (25 years).
The results shows that a DC system in Eskilstuna delivers 8.5 MWh more power to the data center compared to an AC system.
The DC system has a higher efficiency and has a lower failure rate and it should be considered when no system has been invested in. In Eskilstuna a battery could be used to store the surplus energy but right now the cost for the batteries is too high for an investment to be profitable.
ISSN: 1650-8319, UPTEC STS TVE 14 014 maj Examinator: Joakim Widén
Ämnesgranskare: David Lingfors Handledare: Katarina Högdal
1
Sammanfattning
Energimyndigheten i Eskilstuna har installerat solparker på taken där de använder ett DC system för att överföra energi från solparkerna till en serverhall. Hur mycket energi solcellerna levererar när ett DC system använts jämfört när ett AC system använts har studerats.
Simuleringar visar att ett större elöverskott levereras av solcellerna när serverhallen drivs med ett DC system.
I rapporten jämförs installering av ett DC system med ett existerande AC system för att undersöka vilket som är mest lönsamt under sin livstid. När en kostnad adderas för rekonstruktion av ett AC system till DC så visas det att det ej är lönsamt att göra denna investering.
Resultaten visar att DC systemet levererar 8.5 MWh mer energi till serverhallen än AC systemet.
DC har dock högre effektivitet och har en högre driftssäkerhet vilket bör tas i beaktning när inget system har blivit installerat. I Eskilstuna kan ett batteri vara bra för att lagra överskottsel dock är priset för högt i nuläget för att en investering ska vara lönsam.
Preface
This project has been performed within the course Independent Project in
Sociotechnical Systems Engineering - Energy systems at the department of Engineering Sciences at Uppsala University. The project was done on behalf of WSP - Sweden with contact person Katarina Högdal, energy consultant at WSP Sweden. Grateful
acknowledgement is wished to be made to Katarina Högdal. We wish to thank Björn Lundkvist at the Energy Agency of Eskilstuna who provided us with all the necessary data about the solar systems installed at the building of the energy Agency. We wish to thank David Lingfors Ph.D student at department of engineering science at Uppsala University, who has supervised us through the project.
2
Table of Contents
Sammanfattning ... 1
Preface ... 1
List of terms used in the report ... 4
1. Introduction ... 5
1.1 Aim ... 6
1.2 Research Questions ... 6
1.3 Delimitations ... 6
1.4 Outline of the report ... 7
2. Background ... 8
2.1 Difference between AC and DC system ... 8
2.2 Reliability difference between AC and DC systems ... 8
2.3 UPS -‐ Uninterruptible Power Supply ... 8
2.4 PSU -‐ Power Supply Unit ... 9
2.5 Swedish Energy Agencies Solar Parks ... 9
2.6 Can AC-‐equipment be powered with DC? ... 10
2.7 AC in Data Centers ... 10
2.8 DC in Data Centers ... 11
3. Surplus Energy ... 12
3.1 CellCube -‐ Vanadium Redox Flow Battery ... 12
3.2 Lithium ion battery ... 12
3.3 Surplus Energy ... 13
4. The System ... 14
5. Methodology ... 16
5.1 Estimation of the power produced from the solar cells ... 16
5.2 Assumptions made in the simulations and calculations ... 16
5.3 Data ... 17
5.3.1 Solrad Parameters ... 17
5.3.2 System efficiency ... 19
3 5.4.1 Produced power ... 19 5.4.2 Delivered power ... 19 5.4.3 Cost estimation ... 20 5.5 Surplus power ... 21 5.5.1 Storage optimization ... 21 6. Results ... 23 6.1 Matlab simulation ... 23 6.2 Cost estimation ... 26 6.3 Storage optimization ... 27 6.4 Sensitivity analysis ... 28 7. Discussion ... 29
7.1 AC versus DC in Data centers ... 29
7.2 Cost and saved money ... 29
7.3 Solar cell park production and surplus ... 29
7.4 Surplus alternatives ... 30 7.5 Future ... 31 8. Conclusions ... 32 References ... 33 Appendix A ... 35 Appendix B ... 36
4
List of terms used in the report
UPS (Uninterruptible Power Supply) - is used as a protection measurement to keep a system running when the power source is disrupted.
PSU (Power Supply Unit) - Converts high voltage to low voltage often from AC to DC. Transformer - A transformer is used to convert electrical voltage to lower or higher electrical voltage.
Solar cell - A solar cell absorbs light and convert it into electricity. Data center - A data center is used to store data.
HOMER Energy - Microgrid modelling software
Cell cube - Storage component that uses vanadium redox battery. Rectifier -The rectifier converts AC to DC.
Inverter - The inverter converts DC to AC.
Power spike - Rapidly increase in voltage over a short amount of time. The increase is often up to 6000 volts and last a couple of milliseconds.
Surge - Increase in voltage over a longer time. The increase is often between 10-40 % and last a few milliseconds up to several minutes.
5
1. Introduction
We live in a world of growing energy demand and energy consumption; therefore we need to consider the efficiency of any component that relies on using energy. The inefficiencies of data centers, particularly in power delivery, are significant and expensive.
According to a leading journal Tech The Future the total electrical consumption of data centers in 2000 was 70.8 TWh and in 2010 the consumption was 235.5 TWh, this means an total increase of 333 % [1]. The statistics shows the data center as a growing energy consumer. But to arrest the growth of data centers would not be the right thing to do, because the need to store data are growing and is a necessity in today's society. Therefore it is critical to consider the inefficiency of data centers and try to find new solutions, to produce and save energy, that are more efficient and at the same time climate friendly.
In a typical data center, a lot of energy is lost in the conversions and transformations from AC to DC. A proposed solution to this problem is to use an electrical system built for DC instead of AC. It has already been proven that a DC system is more power efficient compared to an AC system [2]. In order for DC to be more appealing to consumers, cost has to be lower compared to the other competing systems.
The Swedish energy agency powers their data center in Eskilstuna with solar cells and the grid. They currently have three different solar parks on top of their building, the parks were built to be more efficient with a DC system.
This bachelor thesis will focus on solar cells with an AC system or a DC system
powering a data center and the adjoining building. The thesis will examine which of the systems is the most cost effective and what can be done with the surplus energy,
6
1.1 Aim
The aim of this report is to investigate the installation and operation cost for a DC grid system from solar cells to a data center. The cost will be compared with the cost of using an AC system from the solar cell system to the data center. The investigation will use information from the data center of the Swedish Energy Agency in Eskilstuna. A sensitivity analysis is performed on the parameters that affect the solar absorption. Furthermore, the effect of solar cell-supplied energy is investigated from the perspective of the data center’s power system — namely, both how the use of solar cells could reduce energy consumption from the grid, and how any generated surplus power could be used.
1.2 Research Questions
In order to fulfill the aim of the report, the following questions will be answered. What does it cost to install and implement a separate DC system compared to an existing AC system over 25 years? Is it profitable?
How much energy can be saved using a DC system compared to an AC system? How much electric power do the solar cells produce? If a surplus is generated, is it profitable to invest in storage components?
1.3 Delimitations
This report will only study the solar parks at the Swedish Energy Agency in Eskilstuna and therefore only valid for that specific building. The report will study installation and material costs of the solar parks. No environmental aspects has been examined. The cooling of the system has been deducted from the study and energy consumed is only taken from the data center as well as the adjoining building. Solar radiation data has been gathered from a meteonorm data base and the data is a normalized year based on historical data. Further delimitations and assumptions are made in the Methodology section
Traditional data centers are usually built with an AC system instead of a DC system [2]. That is why this study focus on replacing an already existing AC system to a DC
7
1.4 Outline of the report
First in chapter 2 the background of the study will be presented. The background contains the difference between an AC and a DC system and the reliability of the systems. Chapter 2 will also explain two important system components, a
uninterruptedly power system (UPS) and the power supply unit (PSU). The rest of chapter 2 will give the reader an explanation to the system.
In chapter 3 surplus energy is explained as well as different options for the use of the surplus energy is explained.
Chapter 4 gives an understanding of the AC and the DC system and how they are constructed.
Chapter 5 contains the methodology. In the methodology an explanation of assumptions and how the different calculations are made can be found. In the methodology cost estimations, storage optimization and surplus energy are simulated and calculated. In the result section (chapter 6) the results from the cost estimations, surplus energy calculations and the storage optimization simulations are presented.
A discussions and conclusion are made in the last two chapters (7 and 8) and the research questions are answered
8
2. Background
This section will describe the components used to transport the electricity in the solar cells to the data center as well as the storage components used in this project.
2.1 Difference between AC and DC system
The most important difference between the AC and DC system in our case is the amount of transformations needed. For example in the AC system an inverter is used to convert DC from the solar cells to AC. When transformation is made from AC/DC or DC/AC power losses occur. Power losses leads to more use of extra power to run the data center and the adjoining building [3].
2.2 Reliability difference between AC and DC systems
Another important difference between the AC and DC system are the amount of components needed. The AC system uses more conversions and consequently need more components. When more parts are used it is more likely that something will malfunction. A study made by EYP, a consulting engineering firm, predicted a two time lower probability of failure in five years in a DC facility compared to an equal AC facility. The probability of failure in five years in a AC facility is 14 % and in an equal DC facility 7 % [3].
2.3 UPS - Uninterruptible Power Supply
UPS (Uninterruptible Power Supply) is used as a protection measurement to keep a system running when the power source is disrupted and fail to supply energy. The UPS can supply power when there is none to get as well as give power when the system is unstable and power spikes occurs. The UPS consist of three parts; rectifier charger, a set of batteries and a static inverter [4]. The rectifier charger charges the battery and
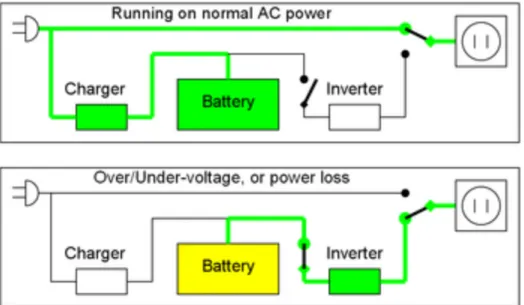
converts AC to DC. The AC to DC conversion is made so the battery can make use of the energy. The battery is used to store energy and the static inverter converts DC to AC voltage but in our case, the static inverter converts higher DC to lower DC to go directly into the data center. The UPS is a vital part of the power system and is needed due to that electrical problems can occur [5]. By having an UPS, the system not only works when power is gone, but also controls and stabilizes voltage and frequency and by that reducing risk of voltage spikes or overloads. By stabilizing the system with the UPS less harm is done to the equipment in the system if a surge takes place [6]. Two types of UPS are studied in this report. One is a DC UPS, which converts DC to a lower DC voltage, and another one is an AC UPS, which converts AC to DC voltage. Figure 1 below shows how a UPS works when power is online and offline.
9
Figure 1: The first picture describes the system when the power is online. The power from AC goes directly to the socket. The power also charges the battery. In the lower picture the system is offline. Power is now used from the charged battery. AC goes to DC in the charger and charges the battery and the inverter converts DC to AC so
energy can be transported to the socket [7][8].
2.4 PSU - Power Supply Unit
PSU stands for power supply unit and it transforms AC voltage to lower DC voltage [9]. The transformation is done so that the computer can use the power to activate all their systems. Different types of transformations are done, depending on what type of power supply that is used. The most common PSU usually transforms 230 AC voltage to 12 or 5 DC voltage. The PSU delivers power but the amount of power delivered is capped at what the component needs. If a component needs 200W and the PSU got 400 W, 200 W is what is delivered to the component [9]. Good performance of the PSU is important and there are five factors that can help establish that; long term reliability, low noise operation, good cooling, high efficiency and stable power delivery under load [9]. The PSU also reduces surges and power spikes [10]. The use of a PSU is very important due to the fact that power need to be regulated so that all the system can have a stabilized power flow. An AC PSU can also be fed with DC instead of AC [2].
2.5 Swedish Energy Agencies Solar Parks
In this project three different solar cell parks have been studied, which has been
installed 2011-2014. Every solar park implemented on the roof has been more efficient than the one before.
Solar cell park 1: The solar cell park is 135m2 and consist of 178 Q smart 90 Wp CIGS
10
efficiency rate of 11.8 %. Solar cells are thin films cells. An DC UPS is used to transport and convert the energy [11].
Solar cell park 2: This park is 109.9m2 and have 84 Panasonic 240SE10 A-class. The solar cells are crystallized and were installed in 2012-2013. The efficiency rate of the cells is 19%. A DC UPS is used to transport and convert the energy [11].
Solar cell park 3: This park is 145m2 and have 90 Sunpower E20_327 A-class. It was installed and implemented in april 2014. The efficiency rate is 20.4 %. The solar cells are similar to these in park 2 and also use a DC UPS [11].
2.6 Can AC-equipment be powered with DC?
All AC equipment today that is classified as an electronic load has a rectifier. The rectifier converts the AC to DC. Devices classified as electronic loads are for example computers, fluorescent lamps etc. These electronic loads require lower voltages, 5 and 12V DC; therefore the incoming AC 230V from the grid has to be converted to DC 5 and 12V. Therefore, any device classified as electronic load can be powered with DC [2].
2.7 AC in Data Centers
In Sweden, the input is 3-phase 400 V AC from a transformer connected to the grid and 230 V AC to the data center and the adjoining house [2]. Figure 2 below shows the power supply through a UPS.
Figure 2: Sketch of the power supply system in a data center with uninterruptible power supply to the servers. High voltage is transformed to low voltage so it can be used in the
servers [2].
To power with single phase AC an UPS is used. After the UPS a PSU transforms the AC into DC. Since there is an energy loss in the transformation in form of heat there must be a cooling system in the data center. Diesel generators are also common in most data centers for back-up power [2].
11
2.8 DC in Data Centers
A data center uses a 3 phase line and has an isolating transformer which is connected to a low voltage of 0.4 kV or a high voltage of 10 kV. The voltage is transformed from a 230 V AC in a rectifier. After the transformation the voltage passes through the battery and into the PSU and data center [2]. See figure 3 below for a possible solution to power a data center with DC.
Figure 3: A possible solution for DC powered data centers. With DC lesser
transformations are needed, the red cross indicates the transmissions of electrical power that are not needed when using DC [12].
12
3. Surplus Energy
As the electrical power needs to be available when the sun is not shining, it would be necessary to store the surplus energy that is not used during the sun peaks. For that problem, there are several solutions; the most common one is to connect batteries to solar panels which will store the surplus energy. The energy will be available in the batteries for use when there is no sun. The reason why CellCube batteries and Lithium ion batteries are compared is because of an interest from the Swedish Energy Agency in Eskilstuna in using one of these models as a storage solution. The second solution presented is to release the surplus energy into the grid.
3.1 CellCube - Vanadium Redox Flow Battery
The vanadium-based redox flow battery is based on chemical reduction and oxidation reaction. The advantage with the redox flow battery is the long lifespan to last at least 20 years [13]. The disadvantages are the large volume needed to store power and that the facilities are large and lack mobility compared to other batteries [14].
3.2 Lithium ion battery
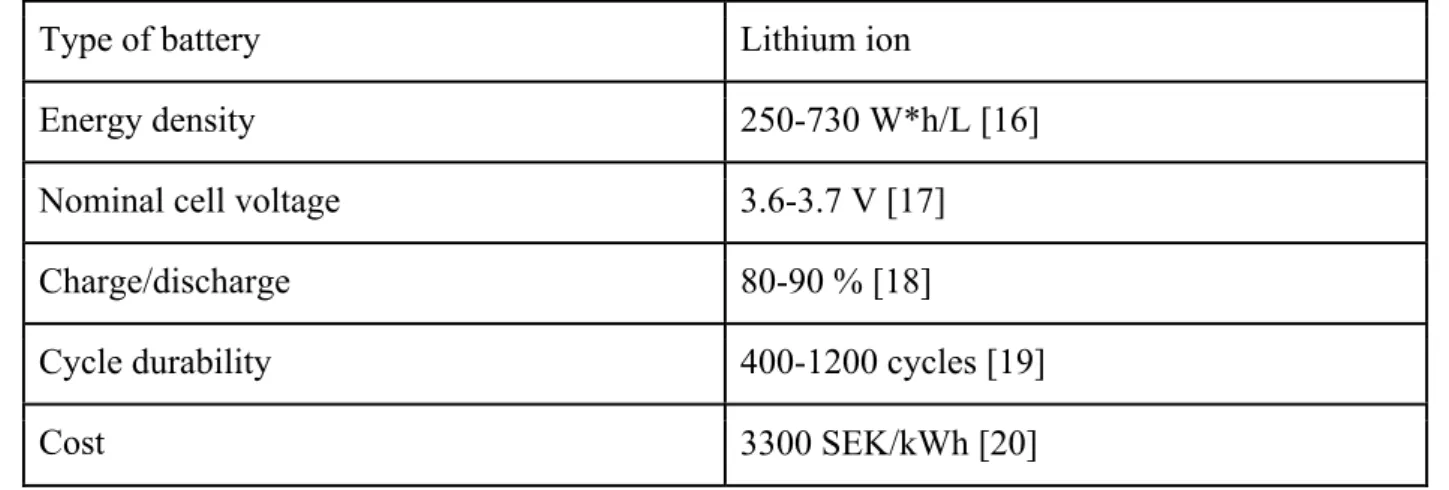
Lithium ion battery is an old technology that developed first in 1912 but in 1970 it started to become available for use [15]. The use of lithium ion batteries started to become popular due to the high energy density, low maintenance and that the discharge is low compared to other batteries. A disadvantage of this type of battery is that it is frail so it requires a protection circuit to keep the battery safe. The battery is also more expensive than other batteries but new technology is released every 6 month which can help to lessen the cost of the battery [15].
Table 1: The table displays the properties of the Lithium ion battery.
Type of battery Lithium ion
Energy density 250-730 W*h/L [16]
Nominal cell voltage 3.6-3.7 V [17]
Charge/discharge 80-90 % [18]
Cycle durability 400-1200 cycles [19]
13
3.3 Surplus Energy
The third option is to sell the surplus energy to the grid. To be able to sell surplus energy an agreement with the grid owner need to be accomplished. Depending on the agreement earnings can be made of the surplus [21]. At the moment the Swedish Energy Agency in Eskilstuna do not sell the surplus energy because of an interest to store and use the energy in their building [11].
14
4. The System
The systems studied in this report are two different electrical grid layouts commonly used to power data centers from solar cells, AC and DC system. A DC system is used at the data center of the Energy Agency in Eskilstuna. The differences between the
systems are the amount of transformations needed when transferring power from the solar cells to the data center, as shown in the figures below. The adjoining house has a DC and a traditional AC system powering the different utilities used. For a AC-system, see figure 4 and a DC-system see figure 5.
Figure 4: The figure describes an AC solar system connected to the data center and the adjoining building. The power from the solar cell is transformed from DC to AC in an
inverter. The AC voltage continues to an AC UPS where AC goes to DC voltage and charges the batteries and transforms back to AC and powers the data center. When power from the solar cell is not sufficient the electrical grid is activated and AC voltage charge the batteries in the AC UPS as well as powering the data center. The faded area
15
Figure 5: The figure describes a DC solar system. The power from the solar cells travels through the DC system to the data center as well as to a DC UPS and charges
the batteries. When power from the solar cell is not sufficient the electrical grid is activated and AC voltage transforms to DC voltage to give power to the data center.
Electrical power from the grid also transforms AC to DC voltage in a DC UPS to charge the batteries. The DC system still has an AC PSU but feed it with DC. The faded
16
5. Methodology
This section describes the procedure on how the simulations and calculations were done. Also why and what assumptions that were made are explained below. The calculation section contains cost estimation and surplus power calculations. An explanation of the storage optimization simulation with HOMER Energy is also presented.
5.1 Estimation of the power produced from the solar cells
The model used for estimating power delivered from the solar cells is a MATLAB-script called solrad. The script is based on formulas from Duffie and Beckman. [22]. This MATLAB-script is commonly used in simulation and optimization of solar energy applications; in this case the script will be used to simulate the solar energy at the Swedish Energy Agency of Eskilstuna. See Appendix B, a MATLAB code has been made that is build on the equation used in solrad.m.
In the simulation, radiation data files from Stockholm are used from the Meteonorm database, which is close to Eskilstuna. In the Meteonorm files used for Stockholm there are year-long data with an hourly resolution with 8760 values for global and diffuse radiation on the horizontal plane.
In MATLAB Solrad.m is a function that generates and plots radiation on a tilted plane defined by the user. The model uses four different input parameters to calculate the solar radiation incident on the solar cells, which are presented in the data section below. The graphs produced by the script were then used to gather information about the solar radiation on the solar cells. With the information an estimation of the produced power could be made and the delivered power was calculated with the efficiency of the system. Knowing the delivered and consumed power usage hourly the surplus power could be calculated.
5.2 Assumptions made in the simulations and calculations
When the surplus energy was calculated, all the solar parks had a DC system. When calculating the cost to implement a DC system instead of an AC system, the assumption was made that all three parks had an already existing AC system and was then rebuilt to a DC system, even though Eskilstuna did not have an AC system before building the DC system on solar park 2 and 3. This assumption was made to give a fair estimation of the price for the conversion from an AC to a DC system. The cost for the solar cells and following maintenance were deducted from the cost calculation due to the fact that they were assumed to be the same for both systems. The reason why the conversion from an AC to a DC system was studied is because the traditional data centers are usually built
17
with an AC system instead of a DC system [2]. The conversion is therefore interesting to study.
The cost of installing and implementing the DC system is only valid for Sweden and prices from Coromatic Group, the company who installed the solar cells on the Energy Agency of Eskilstuna, have been used. A complete cost for the montage materials and installation were obtained for solar park 2 and solar park 3. The price for solar park 1 had to be estimated with help from the costs of the other two solar parks since there were no data available.
5.3 Data
5.3.1 Solrad Parameters
The model solrad used four different parameters that are specific for the Energy Agency at Eskilstuna to calculate the solar radiation that is absorbed by the solar cells.
Site: The parameter site used data of solar radiation. In this model site Stockholm was used due to the closeness to Eskilstuna. With the distance of 113 kilometers between the cities, the assumption was done that the two cities have similar insolation.
Tilt: Tilt is the angle on the solar cells. Tilt can be set from 0° to a 90°. By changing the tilt the amount of solar energy that hits the solar cells changes.
Azimuth: Azimuth is measured in degrees and in this model an azimuth degree from 0 to 360 can be chosen. The direction of the solar cell can be north, south, west, east or somewhere there between. Azimuth has a starting point at south that will be at zero degrees and increases clockwise.
Albedo: Albedo also known as ground reflectance is a value between 0 to 1. The reflectance value describes how much of the incoming sunlight that is reflected. A reflectance value of 0.3 means that 30 % of the incoming light is reflected. It is important because the ground reflects solar radiation onto the solar cells. For example snow has a high albedo value around 0.8 and green grass has about 0.2. If the tilt is zero the solar cells are installed flat on the ground and the albedo will have no effect because no light from the ground will be reflected onto the solar cells [23].
18
Figure 6: The graf display different tilt and azimuth and the efficiency by having a solar cell at the tilt and azimuth. The optimal tilt and azimuth can been seen where picture
displays the two 100 marks. The values are only valid north of the equator [24].
To maintain the simulations, data from Table 2 were used, added to the table is also the year of construction of the different parks.
Table 2: Input parameters for the simulation of the solar parks and the year of construction.
Solar park 1 Solar park 2 Solar park 3
Area 135 (m2) 110 (m2) 145 (m2)
Efficiency 11.8 % 19 % 20.4 %
Effect (Watt-peak) 16.02 kWp 20.16 kWp 29.43 kWp
Tilt 30° 0° 30°
Albedo 0.2 (mar-oct) summer
0.8 (nov-feb) winter
0 % tilt -> no effect from albedo
0.2 (mar-oct) summer 0.8 (nov-feb) winter Azimuth South east (315°) 0 % tilt -> azimuth do
not affect the results
South east (315°)
19
5.3.2 System efficiency
The DC system contains of a DC UPS with 99 % efficiency and an AC PSU with 88 % efficiency, which gives an efficiency of 0.99*0.88 = 0.87 = 87 %. The AC-system contains both an AC UPS with 90 % efficiency and an AC PSU with 88 % efficiency and an inverter with 95 % efficiency, which gives us a total efficiency of
0.95*0.88*0.90 = 0.75 = 75 % [25].
5.4 Calculations
In this section the equations used in the Matlab simulation when calculating the produced and the delivered power can be found. The results from the simulation were then used in the cost estimation.
5.4.1 Produced power
To calculate the produced power from the three solar cell parks, equation 1 was used.
P! = T!"∗A!∗E! (1)
T!" = Total in-plane irradiance (kWh/m!)
A! = Solar cell area (m!)
E! = Solar cell efficiency
P! = Produced power from solar cell park i (kWh) 5.4.2 Delivered power
The delivered power from the solar cells, when losses in the system are included, can be obtained with equation 2.
D! = P!∗L! (2)
P! = Produced power from solar cell park i(kWh) D! = Delivered power from solar cell park i (kWh) L! = Losses in the system (efficiency)
20
5.4.3 Cost estimation
To do a cost estimation of the project, data from Coromatic Group were used for the installation of the solar cells as well as the DC-system. Since the surplus power received from the solar cells where simulated in MATLAB it was possible to calculate the
economic value of the surplus energy in SEK by using an price average of 25 years where the price increased by 3 % every year, which resulted in 1.2 SEK/kWh. The delivered power for a DC-system was compared to those of an AC-system. The
difference was then compared to the cost of installing a DC-system, which was used to determine if an investment in a DC-system is profitable or not.
Table 3: The construction cost for the solar parks when running on DC
Solar park 1 Solar park 2 Solar park 3 Total cost Electrical
installation
120 000 SEK 110 000 SEK 110 000 SEK 340 000 SEK
DC UPS 350V including solar cell regulators and distribution
200 000 SEK 170 000 SEK 120 000 SEK 490 000 SEK
Total cost 320 000 SEK 280 000 SEK 230 000 SEK 830 000 SEK
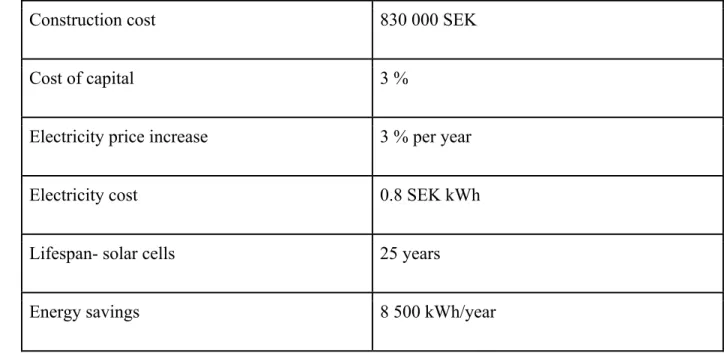
The table below describes the costs versus savings in a DC system. The calculations were done in Excel. The construction cost of 830 000 SEK was the cost for building a DC system where it once was an AC system. Cost of capital is the required return percentage and 3 % was chosen for the investment. 3 % electricity price increase is a high number which was chosen to increase the savings with a DC system. Lifespan of 25 years was set because the assurance was 25 years. 8500 kWh is the difference between AC and DC system in power savings.
21
Table 4: This table display the construction cost as well as the energy saved when using cost of capital as 3 %, electricity price increase 3 % and a price 0.8 SEK per kWh. The result is saved money, from not buying electricity, during the lifespan of 25 years minus
the cost of construction.
Construction cost 830 000 SEK
Cost of capital 3 %
Electricity price increase 3 % per year
Electricity cost 0.8 SEK kWh
Lifespan- solar cells 25 years
Energy savings 8 500 kWh/year
5.5 Surplus power
When simulating the surplus energy the model used the combined hourly delivered power from the solar cell parks and subtracted the hourly consumed power by the data center and the adjoining building.
The hourly consumed power by the data center is 12 kW and the adjoining building was estimated to consume an average 0.1 kW. The 0.1 kW is low because of the good efficiency from the electrical components in the adjoining building. In the estimation of the power consumption of the adjoining building LED-lights and charging docks for cell phones/computers are included.
5.5.1 Storage optimization
The storage optimization was made to study what could be done with the surplus power. Two different storage component was examined, CellCube and lithium ion batteries. The use and cost of the storage component lithium ion battery was compared to the option of dumping the power into the grid to determine if it is cost effective to invest in a storage component. The program HOMER Energy developed by National Renewable Energy Lab (NREL) was used to simulate the cost with and without batteries and solar cells in different combinations, with a time period of a solar cell life span. The
important outputs from HOMER Energy used in this bachelor thesis are operating cost, total cost during the time period and the initial cost.
22
HOMER Energy can only simulate one solar park in a simulation. To work around that problem a mean value of 17 % efficiency was used for the solar parks. The tilt on the solar cells was set to 20° even though the solar park 2 has no tilt. The combined size of the solar parks in the simulation was set to 65.61 kWh. The simulation displayed a similar power production with the new tilt and efficiency compared to the original values.
The battery was set to 3300 SEK/kWh when simulations of batteries of size 10, 20, 50, 100, 250, 500 and 800 kWh were done. A future price for year 2025 was also set. The price at 2025 will be 1100 SEK/kWh.
The batteries have a life span of 9 years, and therefore changed three times in a 25 yeas period. The same cost for the batteries will be used when the batteries are changed.
23
6. Results
These sections display the graphs from the Matlab simulation as well as the result from the cost estimation and the storage optimization.
6.1 Matlab simulation
The figures 7 and 8 display the delivered power from the solar parks to the data center. Figure 9 displays the hourly surplus energy during a year and figure 10 and 11 show the total delivered power when using a DC compared to an AC system for all of the solar parks. The table 5 displays the difference between the AC and DC system in delivierd power.
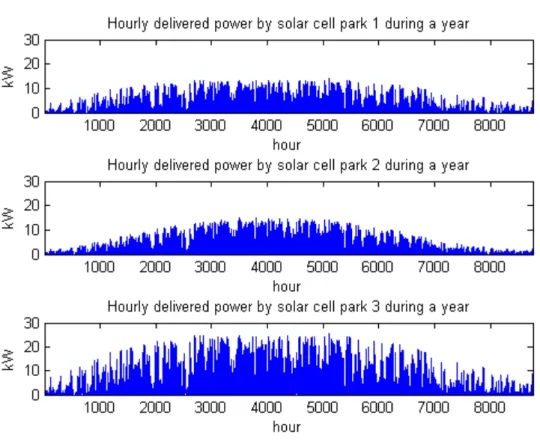
Figure 7: The graph displays the amount of delivered power per hour during a year by solar cell park 1, 2 and 3.
24
Figure 8: Hourly total power delivered by the solar cell parks during a year. The delivered power is from solar cell Park 1, 2 and 3 and summed up to a total. Production
is for every hour on the year and it displays the production amount per hour in kW.
Figure 9: The graph displays the surplus energy per hour for a whole year. Surplus energy is amount production from the solar cell minus amount consumed by the data
25
Figure 10: The diagram displays the total delivered power for solar park 1 for AC and DC. The difference between DC and AC is for solar park 1: 2000 kWh, solar park 2:
2500 kWh and solar park 3: 4000 kWh.
Figure 11: The diagram displays the total delivered power from solar park 1,2 and 3 for AC and DC. The difference between DC and AC is 8500 kWh.
26
Table 5: Table shows delivered power using DC and AC as well as the difference between delivered power from the solar cell park when using a DC- and an AC system.
Solar cell
park Delivered power DC system (kWh/year) Delivered power AC system (kWh/year) The difference (DC-AC) (kWh/year) 1 15000 13000 2000 2 18000 15500 2500 3 28500 24500 4000 Total 61500 53000 8500
6.2 Cost estimation
Table 6: Display the savings with a DC system and the result for cost versus savings. Calculations can be seen in table 4.
Total saving 170 000 SEK
27
6.3 Storage optimization
In the fallowing sections simulation results from HOMER Energy will be presented in tables below.
Table 7: The table displays the operation cost and total cost when using solar energy from the solar parks with different battery sizes. The operation cost is the cost for buying electricity from the grid. Total cost is the cost for the battery, solar cells and the operation cost (25 years). Note that the batteries have a life span of nine years and will
therefore be changed three times during the 25-year span.
Battery size (kWh)
Price
(SEK) Future price (2025)[26] (SEK) Operation cost (SEK/year) Total cost(2014) (SEK) Future Total cost(2025) (SEK) 10 99 000 33 000 97 000 5 500 000 5 460 000 50 495 000 165 000 87 000 5 700 000 5 340 000 100 999 000 330 000 79 500 6 000 000 5 320 000 500 4 950 000 1 650 000 64 000 9 500 000 6 250 000 800 7 920 000 2 640 000 63 000 12 500 000 7 210 000
Table 8: The table displays storage optimization and cost comparison between two different scenarios.
Type of
system Initial cost(SEK) Operating cost (SEK/year)
Total cost during solar cells life span (25 years)(SEK)
Grid, solar cells
3 000 000 101 278 5 532 000
Grid 0 148 000 3 710 000
The results display that only using the grid is the cheapest with a total cost of 3 710 000 SEK. When using both grid and solar cells the total cost is 5 532 000 SEK. When adding a battery to the grid-solar cell system the simulation show that the 10 kWh battery has the lowest cost of the batteries with a total cost of 5 500 000 SEK. We can alson see that the cheapest future price is when using a 100 kWh battery with a total cost of 5 320 000 SEK.
28
6.4 Sensitivity analysis
Sensitivity analysis was done to study which of the parameters has had a great impact on the end result. A sensitivity analysis was done on tilt, azimuth and albedo.
Azimuth: Analysis on the azimuth (placement of the solar cells) showed that by changing the degrees the change in efficiency was large. By changing from 0 to 180 degrees the difference was over 50 % with little more than a 500 kWh/m2/year with site: Stockholm, albedo: 0.2, tilt: 30°. The importance of good azimuth value is significant and will decide if an investment in solar cells is profitable or not.
Tilt: Tilt had a low effect on the solar radiation that had hit the solar cells. The change from 0 to 90 degrees made little impact. The change in degrees only had a maximum effect of approximately 100 kWh/m2/year. Zero degrees had the lowest effect and the maximum effect was granted at 45°.
Albedo: The albedo (ground reflectance value) used were 0.2 ground and 0.8 when snow. The higher the reflectance value the higher amount of light is reflected to the solar cells. In the summer 0.2 was used but with 0.8 in the winter more energy could be produced and the difference were 40 kWh/m2/year.
This sensitivity analysis shows that azimuth was the most important factor in creating and using solar cells. The right amount of azimuth showed the biggest increase in effect and the factor that should be prioritized the most when building solar cells.
A sensitivity analysis was also done on efficiency, solar cell park area and the data center with the adjoining building.
Efficiency: The efficiency used was 0.75 for AC and 0.87 for DC. The difference in efficiency plays a big role how much power can be used in the data center. It is more than a 10 % difference and it shows that it is more energy efficient to build DC if the study is done only on efficiency.
Data center and adjoining building: The data center has a steady power rate of 12 kW consumed every hour. The other power loads is coming from lighting of the adjoining building. The increase in loads from lighting from the building has little to almost no effect on the end consumption. The big factor is the data center with the 12 kW that is constant during the whole day. The data center cannot be changed or disrupted and will produce the 12 kW all year around. If the adjoining building would consume 3 kW instead of 0.1 kW less surplus power would be generated and a smaller battery could be used.
29
7. Discussion
7.1 AC versus DC in Data centers
Since the Swedish Energy Agency in Eskilstuna has three separate solar cell parks we chosed to compare them individually according to how much electricity they produce while running on AC versus running on DC. As presented earlier in this work, DC is a more efficient way to transport the electricity, from the solar cells on the roof of the building to the data center in the same building. In our case the efficiency of the DC system is higher because it has fewer conversions in the several components that are included in the line, such as the UPS and the battery. Through calculations it is
determined that the efficiency of a DC system from the solar cells to the data center is 87 % and 75 % for an AC system. This gives a total of 12 percentage points difference in efficiency between the systems. At the solar cell parks at the Swedish Energy Agency in Eskilstuna these 12 percentage points makes a difference in delivered power. By using DC a total of 8500 kWh per year can be saved. When it comes to reliability it is an important fact to consider while switching to a different power distribution system, especially in a data center where the power must not be interrupted. A DC system is more reliable with a risk of failure at 7 % over five years compared to an AC system with a risk of failure at 14 %. It is important to note that the percentage of the failures are from a study for a specific facility but should give a fair estimation of the risk. It is important to consider these factors and not only look at which of these systems has the greatest efficiency.
7.2 Cost and saved money
The solar parks cost has been taken from the offer from Swedish Energy Agency. Total cost was 830 000 SEK for building the DC system, which is expensive when compared to the savings done. The investment is an economic loss for the Agency and right now solar technology is not profitable when the investments cost are as big as they are. The reconstruction from AC to DC cost a lot of money and should not be done when cost is prioritized. The best is to choose either DC or AC and then use it until the lifespan of the solar cells ends. The life span was set to 25 years that is reasonable when the assurance of the solar cell is 25 years as well. The result was - 660 000 SEK which is a huge number and really shows that it is not cost effective to change from AC to DC. Even in the future when the energy saved are quadrupled the cost will still be higher than the energy saved. The savings every year was 8500 kWh but it is not enough to cover the expenses.
7.3 Solar cell park production and surplus
The production from solar park 1, 2 and 3 are similar if the flow of the graphs presented under the results is studied. The graph shows that most production is between the
30
periods from 2700 hours to 5500 hours. This shows that the solar park produces most energy in the summer and less amount of energy during the winter months.
The graphs displays that solar park 2 produces more power than solar park 1 and produce less power than solar park 3. The difference in the electricity production between the solar parks is mostly because they have different efficiency (different solar cell models) but another important factors are azimuth, tilt and the area of the solar parks. Solar park 2 has a good efficiency but with zero tilt so the azimuth has no effect which means a lower production if compared with the optimal tilt of 45° shown in figure 6. The factor that influenced solar park 2 to be constructed with no tilt is the amount of space available. With no tilt, no space between the solar cells is needed due to the fact that there is no risk of internal shading of the other solar cells. With a large park the decision how the solar cells should be installed is important. A consideration between available space and the power gained from different values of tilt is made. With a large park, tilt may not be possible if the roof has limited space. Azimuth on the solar park 1 and 3 is 315° which is southeast. Best effect is at 360° (0°) which should be the azimuth used. The Enegy Agency of Eskilstuna used southeast, which is still good, but not an optimal placement. The solar parks may have been built with a southeast orientation because of the location of the building and how the roof is situated or how other building shadow the solar cells. The factor that increased the energy production the most is the solar cell park area, which is not a surprise because the larger the area the higher amount of solar cells that could be installed and more energy can be absorbed, but a grater cost aswell.
When combining the three solar parks it could be observed that the lowest delivered power was 2 kWh and the highest delivered power was 50 kWh. The consumption was a little more than 12 kWh and the surplus had a maximum peak of almost 40 kWh. A large delivered power is good for the Swedish Energy Agency in Eskilstuna but when surplus energy is delivierd, alternatives is needed to be studied to fins a solution for a sustainable surplus energy use. The surplus energy in a year was 27400 kWh and with a cost of 1.2 SEK per kWh hour, 32880 SEK every year can be saved if some sort of storage is implemented instead of dumping it onto the grid. Important to keep in mind is that power storage solutions today cost a lot, which will be discussed in the section below.
7.4 Surplus alternatives
Two alternatives were used when studying what to do with the surplus energy. Either use a lithium ion battery or dumping it on the grid.
In this case the HOMER Energy simulation showed an operation cost of 5 532 000 SEK when using solar cells and the grid. When only using power from the grid the cost was 3 710 000 SEK. It is important to remember that the simulation were made with a time period of 25 years, which is the lifespan of the solar cells. If the simulations had made with a longer time period the results would display a smaller gap between the cost of
31
using solar cells and using electricity from the grid. The smaller gap is because the solar cells needs to be changed every 25 years but the electrical installation components do not need to be replaced except the rectifier that have a lifespan of about 15 years. This means the only cost every 25 years is the change of solar cells. When using solar cells the operating cost is 101 278 SEK/year, and when only powering with the grid the operating cost is 148 000 SEK/year. The price for the solar cells is therefore a huge contributing factor to which of the options that is the most cost effective.
According to the result received from HOMER Energy in table 7 the total cost when using a 10 kWh lithium ion battery is 5 500 000 SEK. When compared to higher capacity batteries the total cost is lower for the 10 kWh battery. The results show a lower operation cost for the higher capacity batteries but a higher total price. This means that the 3300 SEK/kWh for the lithium ion battery is too high compared to only use for the surplus energy from the solar cells. It is also important to keep in mind that the batteries have a lifespan of 9 years, therefore, they will be be changed almost three times in a 25 years lifespan.
But if we look at the future estimated prices for the lithium ion batteries it may be worth it. With a total cost of 5 320 000 SEK for a 100 kWh battery it is lower than using solar cells with the grid. This means money could be saved if a battery is implemented and the price estimations are correct for year 2025.
The cheapest alternative to this day is still to dump the surplus power on the grid due to the investment in storage components are too high. There is also a possibility to sell the surplus energy if a deal with a grid owner can be made.
7.5 Future
Newer solar cells have better efficiency and the cost for solar cells has decreased. The technology in solar cell has increased rapidly which made the cost decrease by 60 % in just 18 months [27]. The solar cells used in solar park 3 which were installed most reasently are not only more efficient, but also the durability has increased compared to the other solar cells.
Solar cell is a new technology but with increasing amount of research and funding this can be a good and a clean way to produce energy. The investment costs of solar cells are huge compared to the amount of energy that can be saved. On the positive side it is clean energy that is great and can be the right path to a more environmentally friendly world.
32
8. Conclusions
The cost to rebuild an AC-system to a DC-system is rather expensive and the result shows that the investment cannot be earned during a lifespan of 25 years. With cost in mind it is not advised to rebuild an existing AC-system.
The total energy that can be saved while using a DC-system instead of AC is 8500 kWh in a year. The cost required for rebuilding the system from AC to DC was a total of 830 000 SEK. The result shows that investing in DC instead of using the existing AC system will result in -660 000 SEK.
The electric surplus production for the three solar parks is in total 27 400 kWh per year and the surplus is 32 880 SEK if the electricity price is 1.2 SEK/kWh. The use of lithium ion battery as a storage unit for the surplus energy is not profitable. It is because the price of 3300 SEK/kWh is too high compared to the gain of storing the surplus energy for use in the data center.
In the future lithium ion could be used for storage if the prices keep decreasing and the effect is rising but at the moment it is too expensive.
33
References
[1] Renzenbrink T. (2011), Data Center Uses 1.3% of World’s Total Electricity. A Decline in growth. Available online: http://www.techthefuture.com/energy/data-centers-use-1-3-of-worlds-total-electricity-a-decline-in-growth/ ( 2014-04-17) [2] Bergqvist S.(2011), Energy Efficiency improvements using DC in Data centers [3] Aldridge, Tomm. Pratt, Annabelle. Kumar, Pavan. Dupy, Dwight. Ailee, Guy.
Evaluating 400V Direct-current for Data Centers. Study. Intel Labs. [4] GE Power Controls, UPS Uninterruptible Power Supply. Available online:
http://www.gepowercontrols.com/de/market_segments/vertical_markets/DS_Catalogue _UPS_English.pdf
[5] Tuncmatic ,Eurotech - Uninterruptible Power Supplies. Available online:
http://www.tuncmatik.com/__FILES__/dosyalar/dosya/Eurotech_Brs_Eng.pdf (2014-04-19)
[6] Tripp Lite Power Protection. (2008), UPS System Basics. Available online:
http://www.mouser.com/pdfdocs/Mouser-TL-Training-Module.pdf 2014-04-21) [7] Mahalko D, Gilman,(2008), UPS diagram. Available online:
http://commons.wikimedia.org/wiki/File:Standby_UPS_Diagram.png (2014-04-19) [8] CEMEP.(2008),Uninterruptible Power Supplies - EUROPEAN GUIDE. Available
online: http://www.cemep.org/fileadmin/downloads/CEMEP_UPS_Guide.pdf ( 2014-04-23)
[9] Mike Chin. (2007), Power supply fundamentals. Available online:
http://www.silentpcreview.com/article28-page1.html (2014-04-23) [10] XP Power, (2007), Power supply technical guide. Available online:
http://www.xppower.com/pdfs/techguide.pdf (2014-04-26)
[11] Lundkvist Björn, IT-chief of the Swedish Energy Agency in Eskilstuna.
[12] Bergqvist S.(2011), Energy Efficiency improvements using DC in Data centers [13] Gildemeister. CellCube FB 200 - the energy storage device for individual use.
Available online: http://energy.gildemeister.com/en/store/cellcube-fb-200#Technology (2014-04-11)
[14] Xing, Xie. Vanadium Redox-Flow Battery. Available online:
http://large.stanford.edu/courses/2011/ph240/xie2/ ( 2014-04-12) [15] Battery University. (2010) Learn about batteries. Available online:
http://batteryuniversity.com/learn/article/is_lithium_ion_the_ideal_battery ( 2014-04-12)
34
[16] Green Car Congress. (2009), Panasonic Develops New Higher-Capacity 18650 Li-Ion Cells; Application of Silicon-based Alloy in Anode
http://www.greencarcongress.com/2009/12/panasonic-20091225.html (2014-04-13) [17] Battery Space, Li-ion Battery Specifications (Steel). Available online:
http://www.batteryspace.com/prod-specs/icr18650nh-2200.pdf (2014-03-29) [18] Large Standford Education (2010), Car battery Efficiencies. Available online:
http://large.stanford.edu/courses/2010/ph240/sun1/ (2014-03-15) [19] Thermo Analytics (2014), HEV Vehchel Battery Types, Available online:
http://www.thermoanalytics.com/support/publications/batterytypesdoc.html
(2014-03-19).
[20] McKinsey & Company(2012), Battery technology charges ahead. Available online:
http://www.mckinsey.com/insights/energy_resources_materials/battery_technolo gy_charges_ahead (2014-03-19)
[21] EON, (2014), Bli din egen elproducent, Available online:
https://www.eon.se/privatkund/Produkter-och-priser/Bli-din-egen-elproducent (2014-05-30)
[22] J.A.Duffie, W.A. Beckman (2006), Solar engineering of thermal Processes, Hoboken, NJ: Wiley.
[23] Widén Joakim, (2013), Solar Radiation Computer lab instructions, Uppsala University
[24] The Renewable Energy hub. Available online:
http://www.renewableenergyhub.co.uk/solar-panel-installation-information.html, (2014-03-25)
[25] NetPower Labs, PP presentation about difference between AC and DC in data centers, handed by John Åkerlund, CEO of Netpower Labs.
[26] Danny King,(2013), Li-ion battery prices still headed way, way down, to $180/kWh by 2020
Available online: http://green.autoblog.com/2013/11/08/li-ion-battery-prices-headed--down-180-kwh/ (2013-11-08)
[27] Ian Clover. (2013), US solar power costs fall 60% in just 18 months
http://www.pv-magazine.com/news/details/beitrag/us-solar-power-costs-fall-60-in-just-18-months_100012797/#axzz32MJRe2jJ (2014-04-23)
35
Appendix A
A picture of the solar cells on the roof of the Swedish Energy Agency in Eskilstuna
A figure of the solar cells insalled on the roof of the Swedish Energy Agency of Eskilstuna. This figure shows us how the solar cells are distributed on the roof.
36
Appendix B
The MATLAB code that is based on the script solrad.m. [x y z gs] = solrad(STOCKHOLM, 30, 315, 0.2, true); [xx yy zz gw] = solrad(STOCKHOLM, 30, 315, 0.8, true); [a b c g2] = solrad(STOCKHOLM, 0, 0, 0.2, true); solarPark1= zeros(8760,1); solarPark1a= zeros(8760,1); solarPark2= zeros(8760,1); solarPark2a= zeros(8760,1); solarPark3= zeros(8760,1); solarPark3a= zeros(8760,1); totalProduced123= zeros(8760,1); %totalProduced23= zeros(8760,1); surplusEffect=zeros(8760,1); lightingEffectConsumed=0.036; loadingEffectConsumed= 0.1; serverConsumed= 12; totalConsumed= serverConsumed+loadingEffectConsumed+lightingEffectConsumed; %verkningsgrad och area sol 1
v1= 0.118; a1= 135;
%verkningsgrad och area sol 2 v2= 0.19;
a2= 110;
%verkningsgrad och area sol 3 v3= 0.204; a3= 145; %systemeffektivitet %AC s1 = 0.75; %DC s2 = 0.87; for i = 1:8760 %DC Production
if i < 1417 %winter Jan-feb park 1 and 3 solarPark1(i,1)= v1*s2*a1*gw(i,1)/1000; solarPark3(i,1)= v3*s2*a3*gw(i,1)/1000; %AC
solarPark3a(i,1)= v3*s1*a3*gw(i,1)/1000; solarPark1a(i,1)= v1*s1*a1*gw(i,1)/1000;
elseif i > 7296 %winter nov-dec park 1 and 3 solarPark1(i,1)= v1*s2*a1*gw(i,1)/1000; solarPark3(i,1)= v3*s2*a3*gw(i,1)/1000; %AC
solarPark3a(i,1)= v3*s1*a3*gw(i,1)/1000; solarPark1a(i,1)= v1*s1*a1*gw(i,1)/1000;
37
else %summer park 1 and 3
solarPark1(i,1)= v1*s2*a1*gs(i,1)/1000; solarPark3(i,1)= v3*s2*a3*gs(i,1)/1000; %AC solarPark3a(i,1)= v3*s1*a3*gs(i,1)/1000; solarPark1a(i,1)= v1*s1*a1*gs(i,1)/1000; end
%AC production park 2
solarPark2a(i,1)= v2*s1*a2*g2(i,1)/1000; %DC prduction park 2 solarPark2(i,1)= v2*s2*a2*g2(i,1)/1000; totalProduced123(i,1)= solarPark1a(i,1)+solarPark2(i,1)+solarPark3(i,1);
%total production park 2 and 3
%totalProduced23(i,1)= solarPark2(i,1)+solarPark3(i,1); surplus=totalProduced123(i,1)-totalConsumed; if surplus > 0 surplusEffect(i,1)= surplus; else surplusEffect(i,1)= 0; end end bar(1:2,[sum(solarPark3) sum(solarPark3a)]) str2 ={'DC','AC'}; nummer={ '0' '5000' '10000' '15000' '20000' '25000' '30000' }; set(gca, 'YTickLabel',nummer) set(gca, 'XTickLabel',str2,'XTick',1:numel(str2))
title('total production per year for solar park 3 for AC and DC.'); xlabel('Solar park')
ylabel('kWh produced per year') figure
format long str2 ={'DC','AC'};
bar(1:2,[sum(solarPark2) sum(solarPark2a)]) set(gca, 'XTickLabel',str2,'XTick',1:numel(str2))
title('total production per year for solar park 2 for AC and DC.'); xlabel('Solar park')
ylabel('kWh produced per year') figure str2 ={'DC','AC'}; bar(1:2,[sum(solarPark1) sum(solarPark1a)]) % nummer1={ '0' '5000' '10000' '15000' '20000' '25000' '30000' '35000' '40000' '45000' '50000' }; % set(gca, 'YTickLabel',nummer1) set(gca, 'XTickLabel',str2,'XTick',1:numel(str2))
title('total production per year for solar park 1 for AC and DC.'); xlabel('Solar park')
38 figure bar(1:2,[sum(solarPark1)+sum(solarPark2)+sum(solarPark3) sum(solarPark1a)+sum(solarPark2a)+sum(solarPark3a)]) str2 ={'DC','AC'}; nummer1={ '0' '10000' '20000' '30000' '40000' '50000' '60000' '70000' }; set(gca, 'YTickLabel',nummer1) set(gca, 'XTickLabel',str2,'XTick',1:numel(str2))
title('total production per year for solar park 1,2 and 3 for AC and DC'); xlabel('Solar park')
ylabel('kWh produced per year')
figure plot(1:8760,totalProduced123); xlim([1 8760]) ylim([0 60]) xlabel('hour') ylabel('kWh')
title('Hourly total power produced by the solar cell park 1,2 and 3 during a year') figure
plot(1:8760,totalConsumed); ylim([0 60])
xlabel('hour') ylabel('kWh')
title('Hourly power consumed by the data center during a year') figure plot(1:8760,surplusEffect); xlim([1 8760]) ylim([0 60]) xlabel('hour') ylabel('kWh')
title('Hourly surplus during during a year') figure plot(1:8760,solarPark3); xlim([1 8760]) ylim([0 60]) xlabel('hour') ylabel('kWh')
title('Hourly produced power by solar cell park 3 during a year') figure plot(1:8760,solarPark2); xlim([1 8760]) ylim([0 60]) xlabel('hour') ylabel('kWh')
title('Hourly produced power by solar cell park 2 during a year') figure
plot(1:8760,solarPark1a); xlim([1 8760])
39
ylim([0 60]) xlabel('hour') ylabel('kWh')
title('Hourly produced power by solar cell park 1 during a year')
%Difference between DC and AC production from the solar parks pr1= sum(solarPark1)-sum(solarPark1a) pr3= sum(solarPark3)-sum(solarPark3a) pr2= sum(solarPark2)-sum(solarPark2a) prtotal=sum(solarPark1)+ sum(solarPark2)+sum(solarPark3)- (sum(solarPark1a)+sum(solarPark2a)+sum(solarPark3a)) solar1a = sum(solarPark1a) solar1 =sum(solarPark1) solar2a= sum(solarPark2a) solar2 = sum(solarPark2) solar3a = sum(solarPark3a) solar3 = sum(solarPark3) overskott123=sum(surplusEffect) %cdfplot(surplusEffect)