Census versus morphological slums
derived from EO data
-A spatial comparison of locations and structures
for two megacities in Brazil
Faculty of Mathematics and Natural Science
Institute of Geography
Christian Albrecht University Kiel
Bachelor Thesis
for the obtaining of the academic grade Bachelor of Science
submitted by
Lisa Macheleidt
September 2017
I would like to thank the DLR for the provision of the slum dataset for Rio de Janeiro and the Global Urban Footprint (GUF).
A very special thanks goes to Hannes Taubenböck and Michael Wurm for the great support and encouragement during the process of the present thesis.
Abstract
Today more than half of the global population lives in cities and until 2050 this proportion is expected to rise to 66%. This rapid urbanisation puts pressure on the cities and policy makers to ensure the provision with basic services and infrastructure. Furthermore, a growing native population and the migration into the cities leads for example to urban sprawl or the emergence as well as expansion of slums. It is estimated that around one billion people live in slums. In order to understand the inherent dynamics of these set-tlements as well as to monitor and evaluate policies, there exists an utter necessity of up-to date data with an areawide coverage. In contrast to this need, consistent spatial or statistical data are often lacking or obsolete. The present thesis classifies slums in the metropolitan region of São Paulo (Brazil) based on morphological characteristics. The applied parameters are summarized and presented in a slum ontology which facilitates the comparability as well as transferability of the data. Furthermore, the average building density as well as building height are determined for every slum.
In general, slums can be described as heterogeneous, complex and context-specific urban phenomenons. In order to examine the influence of different definitions, parameters and methods on the classification of slums and their spatial distribution, the created dataset together with a similar dataset for Rio de Janeiro are compared to the spatial data of the demographic census of Brazil. The analyses are executed on three dimensions: area, time and location. The results show that the geography and structures of the slums differ depending on the applied criteria and classification method. Moreover, the present thesis displays differences between the two cities and concludes that they are mainly resulting from historic development and due to topographical characteristics. In essence, the slums classified by the different methods should not be seen as the complete mapping of the existing slums in São Paulo and Rio de Janeiro rather do they represent a snapshot of the cities and their settlements showing predefined criteria in the moment of classification.
Zusammenfassung
Aktuelle Schätzungen zeigen, dass die Hälfte aller Menschen in Städten lebt, wobei die Zahl bis zum Jahr 2050 bei 66% liegen soll. Die schnelle Urbanisierung löst Druck auf die Städte sowie politische EntscheidungsträgerInnen aus, um eine Versorgung der urba-nen Bevölkerung mit grundlegender Infrastruktur zu gewährleisten. Sowohl das natürliche Wachstum der Stadtbevölkerung als auch Migration haben mitunter eine Ausdehnung der urbanen Fläche sowie die Entstehung und Ausbreitung von Slums zur Folge. Die Zahl der Menschen, die in Slums leben, wird auf etwa eine Milliarde geschätzt. Trotz gebotener Notwendigkeit sind aktuelle, vollständige räumliche oder statistische Daten zur Ausbrei-tung oder Größe dieser Siedlungen oft nicht vorhanden. Diese Daten sind wichtig, um ihre Dynamik besser verstehen sowie die Wirkung von Programmen einschätzen zu können. In der vorliegenden Arbeit werden Slums in der Metropolregion São Paulo (Brasilien) anhand morphologischer Merkmale durch die Anwendung visueller Interpretation von
Sa-und präsentiert. Außerdem werden die durchschnittliche Bebauungsdichte sowie Gebäu-dehöhe für die einzelnen Slums bestimmt.
Insgesamt gelten Slums als heterogene, komplexe und kontextspezifische urbane Phäno-mene. Daraus lässt sich ableiten, dass Slum-Klassifikationen, die auf unterschiedlichen Definitionen und Parametern beruhen, unterschiedliche Ergebnisse generieren. Um dies zu prüfen, vergleicht die vorliegende Thesis die generierte Klassifikation für São Paulo so-wie einen Datensatz für Rio de Janeiro, der auf einer ähnlichen Methode beruht, mit den räumlichen Daten zu Slums des brasilianischen demographischen Zensus aus dem Jahr 2010. Die Klassifikationen werden auf den drei Ebenen Fläche, Zeit und Lage verglichen. Die Ergebnisse zeigen, dass sich die Geographie und Struktur der Slums je nach angewand-ter Definition, Methode und Parameangewand-tern unangewand-terscheiden. Außerdem werden Unangewand-terschiede zwischen den beiden Megastädten aufgezeigt, die teilweise auf die historische Entwick-lung der Stadt sowie die Topographie zurückzuführen sind. Zusammenfassend lässt sich konstatieren, dass die jeweiligen Klassifikationen keine komplette Abbildung der Slums in São Paulo und Rio de Janeiro darstellen, sondern eine Momentaufnahme der Siedlungen, die den vordefinierten Parametern zur Zeit der Klassifikation entsprechen.
Resumo
Dados atuais mostram que mais da metade da população global mora nas zonas urbanas e, até o ano de 2050, a expectativa é que essa proporção cresça para 66%. Essa urbanisação acelerada acaba por exercer pressão sobre as cidades e as gestões políticas para garantir o abastecimento da população urbana com serviços básicos, inclusive de infraestrutura. Além do crescimento natural da população nas cidades, a migração para os grandes cen-tros contribui por exemplo na expansão da área urbana, como também no surgimento e crescimento das favelas. Estima-se que cerca de um bilhão de pessoas no mundo mo-rem em favelas. De modo a compreender as dinâmicas inerentes a esses assentamentos, bem como monitorar e avaliar a efetivação de políticas na área, faz-se necessário o le-vantamento de dados espaciais ou estatísticos atualizados sobre a extensão desses locais. Porém, apesar da necessidade, esse levantamento muitas vezes é obsoleto ou inexistente. Neste trabalho, as favelas da região metropolitana de São Paulo (Brasil) são classificadas com base em características morfológicas através da metodologia de interpretação visual de imagens de satélite. Os parâmetros aplicados estão resumidos e apresentados numa on-tologia sobre favelas, que facilita a comparabilidade e a transferibilidade de dados. Além disso, a densidade média da construção e a altura média dos prédios são determinados para cada favela.
No geral, favelas são heterogêneas, complexas e cada uma se insere em um contexto especí-fico. Decorrente disso, classificações de favelas que usam variadas difinições e parâmetros podem gerar resultados diferentes. Com o intuito de examinar os efeitos de se usar di-ferentes metodologias de classificação, essa pesquisa de bacharelado compara a base de
dados desenvolvida para São Paulo juntamente com a desenvolvida de forma similar para o Rio de Janeiro com os dados espaciais do censo demográfico do Brasil. As análises são executadas a partir de três dimensões: àrea, tempo e localização. Os resultados mostram que a geografia e as estruturas das favelas diferem de acordo com os critérios aplicados e métodos de classificação. Além disso, o presente trabalho apresenta diferenças entre as duas cidades, as quais podem ser atribuídas ao processo de desenvolvimento histórico e às características topográficas específicas. Em suma, pode-se constatar que as classifi-cações respectivas não representam um mapeamento completo das favelas de São Paulo e Rio de Janeiro, mas um instantâneo dos assentamentos que correspodem aos critérios pré-definidos no momento da classificação.
1 Introduction 1
1.1 Motivation to this study . . . 1
1.2 Research questions and structure of this study . . . 2
2 Background 4 2.1 Definition of the term slum . . . 4
2.2 Morphology of slums . . . 5
2.3 Slums in Brazil . . . 6
2.3.1 Slums in Rio de Janeiro . . . 7
2.3.2 Slums in São Paulo . . . 7
2.4 Remote Sensing and in its application in slum research . . . 8
3 Data 11 3.1 Earth Observation (EO) data . . . 11
3.2 Census in Brazil . . . 12
4 Methodology 13 4.1 Selection of the study sites . . . 13
4.2 Global Urban Footprint . . . 13
4.3 Data acquisition . . . 14 4.3.1 Rio de Janeiro . . . 14 4.3.2 São Paulo . . . 15 4.4 Comparison . . . 20 4.4.1 Area . . . 20 4.4.2 Time . . . 21 4.4.3 Location . . . 21 5 Results 22 5.1 Study sites . . . 22 5.1.1 Rio de Janeiro . . . 22 5.1.2 São Paulo . . . 23 5.2 Area . . . 23 5.3 Time . . . 29 5.4 Location . . . 31 6 Discussion 34 6.1 Data and methodology . . . 34
Contents
6.2 Census versus morphological slums . . . 35
7 Conclusion and outlook 38
Bibliography 40
Appendix 45
4.1 The six general indicators categorized to form a hierarchy to represent concepts at three spatial levels (Kohli, Sliuzas, Kerle & Stein, 2012, S. 158) 15 4.2 Reference polygons for the five building density classes . . . 19 4.3 Reference polygons for the two building height classes . . . 20 5.1 GUF Rio de Janeiro (Data source: Taubenböck et al. (2012). Own
illus-tration) . . . 23 5.2 GUF São Paulo (Data source: Taubenböck et al. (2012). Own illustration) 24 5.3 Spatial distribution of slums in Rio de Janeiro (Data sources: Fricke (2015);
Instituto Brasileiro de Geografia e Estatística (2010); Taubenböck et al. (2012). Own illustration) . . . 25 5.4 Spatial distribution of slums in São Paulo (Data sources: Instituto Brasileiro
de Geografia e Estatística (2010), own dataset, Taubenböck et al. (2012). Own illustration) . . . 25 5.5 Comparison of census and morphological slum area as well as their area of
intersection (Data sources: Fricke (2015); Instituto Brasileiro de Geografia e Estatística (2010), own dataset. Own illustration) . . . 26 5.6 Comparison of distribution of slum area in % along the five density classes
(Data sources: Fricke (2015); Instituto Brasileiro de Geografia e Estatística (2010), own dataset. Own illustration) . . . 27 5.7 Comparison of built-up and not built-up area in km2 (Data sources: Fricke
(2015); Instituto Brasileiro de Geografia e Estatística (2010), own dataset. Own illustration) . . . 28 5.8 Comparison of share of one-storeyed and multi-storeyed slum area in km2
(Data sources: Fricke (2015); Instituto Brasileiro de Geografia e Estatística (2010), own dataset. Own illustration) . . . 28 5.9 Comparison of slum area in km2 along GUF time steps (Data sources:
Fricke (2015); Instituto Brasileiro de Geografia e Estatística (2010), own dataset, Taubenböck et al. (2012). Own illustration) . . . 30 5.10 Comparison of slum building density in km2 along GUF time steps (Data
sources: Fricke (2015); Instituto Brasileiro de Geografia e Estatística (2010), own dataset, Taubenböck et al. (2012). Own illustration) . . . 31 5.11 Comparison of slum area in percentage along distance to city center in
5 km zones (Data sources: Fricke (2015); Instituto Brasileiro de Geografia e Estatística (2010), own dataset. Own illustration) . . . 32
List of Figures
5.12 Comparison of slum area along distance to city center in 5 km zones and GUF time steps (Data sources: Fricke (2015); Instituto Brasileiro de Geo-grafia e Estatística (2010), own dataset, Taubenböck et al. (2012). Own illustration) . . . 33
2.1 Frequency of methods versus main focus for slum mapping using VHR imagery (Kuffer, Pfeffer & Sliuzas, 2016, S. 14) . . . 10 4.1 Slum Ontology São Paulo . . . 18
List of Tables
List of abbreviations
CBD Central Business District
DLR German Aerospace Center
EO Earth Observation
GIS Geographic Information System
GSO Generic Slum Ontology
GUF Global Urban Footprint
IBGE Instituto Brasileiro de Geografia e Estatística
NASA United States National Aeronautics and Space Administration
OBIA Object-Based Image Analysis
SDGs Sustainable Development Goals
SAR Synthetic Aperture Radar
RS Remote Sensing
USGS U.S. Geological Survey
VHR Very High Resolution
Currently, more people live in cities than 1960 lived in the entire world (Davis & Kurz-Scherf, 2011). In other words, in 2015 more than four billion people, which is over half of the global population, lived in urban agglomerations (United Nations Economic and Social Council, 2017). This proportion is expected to rise in the next decades to a global urban population level of 66% by 2050 (United Nations, Department of Economic and Social Affairs (UN DESA), Population Division, 2014).
Various factors such as more employment opportunities in cities, crop loss due to infertile soils and weather dependency, the agricultural industrialisation (Taubenböck & Kraff, 2015) as well as land grabbing (Zoomers, van Noorloos, Otsuki, Steel & van Westen, 2017) are drivers of this accelerated urban growth.
This rapid urbanisation puts pressure on the global cities and policy makers to ensure the provision with adequate shelter, basic services such as water and energy supply, infra-structure, sanitation system as well as waste management (Cohen, 2006). Furthermore, the combination of a growing native population, an increasing urban migration and a lack of sufficient housing leads to urban sprawl, the emergence as well as the expansion of slums (Cohen, 2006; United Nations Economic and Social Council, 2017). Today, around one billion people are living in slums. The absolute numbers are not expected to decline - at the contrary, annually six million people add to the number of slum dwellers which is almost 50% of the total urban growth (UN-HABITAT, 2010, 2012).
1.1 Motivation to this study
In contrast to the increasing numbers of slum dwellers, consistent data such as statistics and maps are often obsolete, fragmentary, in a low temporal resolution or even inexistent (Herold, Goldstein & Clarke, 2003; Hofmann, 2001). This data is important to under-stand the complexity as well as the dynamics of urban processes (Esch et al., 2012) and to achieve the recognition of the slum settlements as an integral part of the formal city (Kohli, Warwadekar, Kerle, Sliuzas & Stein, 2013). Furthermore, this data as well as the correct understanding are necessary for the application and monitoring of convenient policies, such as goal 11 from the 17 Sustainable Development Goals (SDGs) by the UN to ”[...] ensure access for all to adequate, safe and affordable housing and basic services and upgrade slums“ by 2030 (United Nations Economic and Social Council, 2017). Besides statistical data, consistent geographic information on the location, the expansion as well as the structure of urban areas and their slums are vital. This can be achieved with different approaches, such as a head-count method (e.g. demographic census) or by using Remote Sensing (RS) techniques.
CHAPTER 1. INTRODUCTION
The lack of good-quality, up-to-date spatial data together with the gap in research com-paring different methods of slum mapping, were the primary motivation for this study. The provision of a consistent spatial dataset created via RS techniques by the German Aerospace Center (DLR) for Rio de Janeiro (Fricke, 2015) as well as the available census data for Brazil, including spatial information, favoured this decision.
In order to extend this comparison as well as to generate a further consistent dataset, using the methodology by Fricke (2015), the city of São Paulo was chosen as a second megacity in the Global South. Further details about the decision process are given in chapter 4 and 5.
1.2 Research questions and structure of this study
There does not exist a universal definition for the term slum neither based on qualitative nor on quantitative measures. This is partly due to the complexity and heterogeneity of this urban phenomenon (e.g., Kuffer, Pfeffer, Baud & Sliuzas, 2013; Taubenböck & Kraff, 2015). Furthermore, slums are relative and context-specific (Gilbert, 2007). Con-sequently, it can be reasoned that classifications based on different definitions of the term as well as different parameters lead to different results concerning the geography and structure (Wurm & Taubenböck, 2017). The two main contexts applied in this study are on the one hand the mapping of slums based on physical characteristics solely by using Earth Observation (EO) data. On the other hand, demographic census information, that include qualitative factors such as illegality of the settlements or adequate supply with basic services, which are not measurable via RS, are analysed. In essence, the present thesis is focusing on the following two questions:
1. How do the applied definitions and parameters on slum mapping influence the results concerning the geography and structure?
2. What are the differences between the census and morphological slums of Rio de Janeiro and São Paulo and what could be possible reasons?
These two main questions will be examined on the three dimensions: area, time and location in combination with the structural parameters building density and height. The study at hand is structured into seven chapters with the aim to give a comprehensive understanding of the complex phenomenon of slums as well as the applied data and methodologies, to finally analyse and discuss the results of the comparison. In chapter 2, the term slum and its morphology will be defined and brief information about slums in Brazil, especially Rio de Janeiro and São Paulo will be given. Additionally, the state of the art of research on RS and slums will be presented. In chapter 3, the utilized EO data and details about the Brazilian demographic census are described. Moreover, the applied methodologies on the selection of the study sites, the processing of the data for further analysis, the classification of the slums via Visual Interpretation (VI) of EO imagery and the following analyses are explained. Chapter 5 will present the results of the study and
its data comparison. In chapter 6, the results of the study will be discussed. Finally, in chapter 7, a conclusion will be drawn and an outlook of questions that should be addressed by future research will be given.
Besides creating a consistent dataset of the slums in São Paulo, this study examines the spatial as well as structural differences and similarities of the slums in Rio de Janeiro and São Paulo and how these depend on historical factors and topographic characteristics as well as on the applied method and definition. This study combines the mapping of slums derived from EO data via VI for two megacities in Brazil and a systematic comparison of these datasets with the demographic census of Brazil from 2010.
2 Background
This chapter will give an overview of existing definitions of the term slum as well as its physical characteristics. Furthermore, information on slums in Brazil, especially in Rio de Janeiro and São Paulo are given. Moreover, existing research and methods of slum mapping via RS are presented.
2.1 Definition of the term slum
There does not exist a general or universal definition of the term slum. Furthermore, most of the existing definitions are of a qualitative nature and there is a lack of quantitative approaches. The UN-HABITAT (2003) states that several key factors make it difficult to establish a more universal, objective and quantitative definition. Firstly, slums are a relative concept which means that a definition and criteria for slums in one city may not be appropriate in another city (Gilbert, 2007). Besides this, a definition cannot rely on one parameter only due to the complexity of slums (UN-HABITAT, 2003). This intricate character can be observed on a spatial and temporal scale. Slums show different charac-teristics in different locations, even in one city. They change over time so that the defined parameters may not be valid any more (United Nations Human Settlements Progamme, 2003).
The first proven definition of the term slum was published 1812 in ”the Vocabulary of the Flash Language“ by James Hardy Vaux meaning ”racket“ (Davis & Kurz-Scherf, 2011). Since then different definitions emerged.
The definition of slums by the UN-HABITAT (2003) is widely used in international stud-ies, providing several clear criteria on the phenomenon. It describes on the one hand once respectable residential areas that suffered from a process of deterioration by the migration of the original dwellers to new and better housing areas. Consequently, the units were subdivided and rented to lower-income groups.
On the other hand, the definition includes informal settlements which are unplanned housing areas, characterized by a lack of one of the following conditions: access to im-proved water, access to imim-proved sanitation facilities, sufficient living area, structural quality/durability of dwellings or security of tenure. Additional characteristics are high population density, insecure residential status and inadequate housing. It is stated that these informal settlements become the visual expression of urban poverty (UN-HABITAT, 2003).
Bähr and Mertins (2000) describe slums as settlements without legal ownership or an official rental contract that are often located in the cities’ peripheries, lacking sufficient infrastructure. Gilbert (2007) condenses the term slum in the meaning of its popular usage
as ”bad shelter“, including both single buildings as well as large settlements which are of a substandard quality and inhabited by the poor. Though, he points out that the criteria ”inadequate“ or ”substandard“ are relative measures, as housing standards are different worldwide (Gilbert, 2007). In addition, the appraisal of slums depends on the respective perspective, thus the inhabitants may evaluate their situation differently in comparison to public, political or academic stakeholders (Nuissl & Heinrichs, 2013). Beside referring to physical characteristics, Nuissl and Heinrichs (2013) state that the definitions of the term slum also include a social component which is prone to the implicit or explicit articulation of prejudices and stigmatisation of the slum dwellers (Gilbert, 2007; Nuissl & Heinrichs, 2013).
The complexity of slums becomes apparent in the variety of the existing terms and synonyms. Examples for the latter are: "informal settlement" or "shanty town". De-pending on the location of the slum, different terms are used such as "gecekondus" in Turkey, "aashawa" in Egypt, "bidonvilles" in francophone countries or "favela" in Brazil (Taubenböck & Kraff, 2014). To avoid conceptual confusion, the term slum is applied consistently in this study.
There also exist "federal slums" which are housing areas constructed by the government as a reaction to housing shortage. They are mostly located at inappropriate sites (Schneider-Sliwa & Meusburger, 2002). This type of slum is neglected in the classification of this study as these areas show different physical characteristics.
The lack of a universal definition of the term slum is an indication for the complexity and heterogeneity of this urban phenomenon. Not only the physical characteristics and housing conditions vary between locations but also the inhabitants of the slums show a wide diversity of origin, religion, culture, income etc. (Gilbert, 2007; Kuffer et al., 2013; Nuissl & Heinrichs, 2013).
Finally, most of the existing definitions are qualitative and can be rather ambiguous, making it difficult to differentiate slums from surrounding urban patterns (Kohli et al., 2012; Taubenböck & Kraff, 2014).
2.2 Morphology of slums
Most of the existing definitions of slums refer to qualitative factors such as the legality of the settlements. A different approach is to identify slums by means of their physical characteristics, their morphology. RS and especially Very High Resolution (VHR) imagery are suitable for this approach as many of the physical particularities of slums can be observed (Kohli et al., 2012). For the visual delineation via EO data, a compilation of the morphology is crucial (Graesser et al., 2012). The term morphology describes the examination of the formation, structure and pattern of a built environment (Graesser et al., 2012).
For the visual classification of slums, the understanding of their morphology and the physical differences between formal and informal settlements is necessary (Kuffer, Barros & Sliuzas, 2014). Taubenböck and Kraff (2015) state that a slum represents a snap-shot of the current phase in its development. This emphazises the context-specific and relative
CHAPTER 2. BACKGROUND
character of the morphology of a slum as it is influenced by different factors such as the location, culture, history and the age or state of its development (Taubenböck & Kraff, 2015; Kuffer et al., 2013).
There exist various studies about the morphological particularities of slums. Taubenböck and Kraff (2014) show that a physical differentiation of formal and informal settlements is possible. In their study, they use both physical parameters such as building size or height as well as structural parameters such as density or structural heterogeneity within the area (Taubenböck & Kraff, 2014). They conclude that on the one hand, slums feature similar characteristics on a global scale and on the other hand, are distinguished by a heterogeneity between different locations as well as within one slum (Taubenböck & Kraff, 2015). Morphological slum characteristics were delineated by Kuffer and Barros (2011). As the main attributes of slums, they refer to high building density, organic layout structure meaning a heterogeneous, non geometric orientation of the buildings, lack of public green as well as open spaces and small building size (Kuffer & Barros, 2011). Further characteristics are narrow streets and alleyways, a variety of building materials and hazardeous constructions (Graesser et al., 2012). High building density can be stated as one of the main characteristics that slums show on a global scale. This can be explained as a result of unplanned growth and a high land use intensity (Taubenböck & Kraff, 2015). Though, the parameter building density should not be applied as the sole indicator due to its dependency on the age and state of the development of the respective settlement (Kohli et al., 2012; Pasternak & D’Ottaviano, 2016).
Finally, it can be stated that due to the diversity and heterogeneity of the physical cha-racteristics of slums on a global, regional and local scale, a morphological approach is not capable of a holistic delineation and the compilation of a universal slum morphology is impossible (Taubenböck & Kraff, 2015).
2.3 Slums in Brazil
According to the Instituto Brasileiro de Geografia e Estatística (IBGE), 11.430.000 people in Brazil live in slums (Instituto Brasileiro de Geografia e Estatística, 2011, p. 83) which is about one quarter of the total population (UN-HABITAT, 2010). The local term for slum is favela, which is originally a spiky plant common to the area. Later, the term was used as a description for the precarious hillside shacks in Rio de Janeiro. Neuwirth (2016) states that favelas develop over time through successive land invasion.
The following chapter gives information on the historical background as well as some particularities about the development of slums in Rio de Janeiro and São Paulo. As the reasons for the development of slums are complex, they will not be discussed in detail in this study. Though, some of the main causes will be mentioned for both cities (O’Hare & Barke, 2003). These facts are important to understand possible differences in locations and structures of the slums in both metropolitan regions. In the present study, the utilized names of the cities Rio de Janeiro and São Paulo always embrace the entire metropolitan regions.
2.3.1 Slums in Rio de Janeiro
The metropolitan region of Rio de Janeiro, currently consists of 21 municipalities, covering an area of 5.292 km2. However, in this study the former composition with 19
municipalit-ies is applied as the data refers to a time before the new composition of 2014 (CEPERJ, 2014). In Rio de Janeiro, the first three slums developed in 1881 on steep slopes close to the city center and in the year 1898 the largest early slum “Morro da Providência” was built by military veterans (O’Hare & Barke, 2003). Though, the first slums emerged in the early 20th century, most of the megaslums developed after 1960 (Davis & Kurz-Scherf, 2011). While some areas showed a decline in population, the slums continued to grow through the processes of densification and verticalisation (Pamuk & Cavallieri, 1998). The slums have also been undergoing diverse urban development processes such as decentralisation of the population in the 1990s, marginalisation in some extent due to increased violence in more central slums as well as gentrification (O’Hare & Barke, 2003; Oliveira, 1996). All in all, the slums of Rio de Janeiro are characterized by a diversity of inhabitants with different socio-economic backgrounds (O’Hare & Barke, 2003).
In Rio de Janeiro, urban population growth, rural-urban migration together with the scarcity of standard housing with affordable prices for the lower and middle income classes are primary factors for the occupation of vacant land (O’Hare & Barke, 2003). In general, it can be stated that the location of the slums is strongly connected to employment op-portunities (O’Hare & Barke, 2003). Further favourite locations in Rio de Janeiro are the steep hillsides as they are located close to the city center and thereby close to employment opportunities and are not considered for commercial or industrial development (O’Hare & Barke, 2003). The location of Rio de Janeiro‘s slums cannot be described as particularly marginal. O’Hare and Barke (2003) state that they are a relatively permanent feature in the urban landscape.
2.3.2 Slums in São Paulo
As for Rio de Janeiro, the metropolitan region of São Paulo was chosen to be examined consisting of 39 municipalities (Governo do Estado São Paulo, 2017), spreading over 7.946,96 km2 (Fundação Sistema Estadual de Análise de Dados, 2017).
The development of slums in São Paulo started later than in Rio de Janeiro (De Sam-paio, 1994; United Nations Human Settlements Progamme, 2003). Lloyd-Sherlock (1997) collected data on the history of São Paulo’s slums. According to him, the first registra-tion was made in 1964 which does not automatically mean that prior to that date slums were inexistent (Lloyd-Sherlock, 1997). Hence, it can be assumed that the first slums de-veloped less than 65 years ago (United Nations Human Settlements Progamme, 2003). In this time “about 60% of population growth was absorbed by São Paulo’s favelas”(United Nations Human Settlements Progamme, 2003, p. 4).
As mentioned for the case of Rio de Janeiro, the reasons for the emergence of slums are diverse and complex. The end of the uninterrupted economic growth in 1950 can be seen as one of the inicial factors (United Nations Human Settlements Progamme, 2003). Furthermore, the migration of economic activities inland lead to an increased
impover-CHAPTER 2. BACKGROUND
ishment of the urban population. Moreover, several federal policies, which lead to a rise in prices of rental properties, a lack of affordable accomodation for low income groups as well as restrictions for the access of savings were hitting the low and middle income classes, forcing them to occupy or buy land in the city’s peripheries in order to avoid inflated prices in the center (Pasternak & D’Ottaviano, 2016; Taschner & Bógus, 1999). This indicates a process that is particular for the development of São Paulo and its slums - the process of marginalisation. In the 1990s, the growth of the city mainly happened through the expansion of the periphery and its slums (Taschner & Bógus, 2001, 1999). The growth of the slums occured as in Rio de Janeiro through densification and vertic-alisation (Pasternak & D’Ottaviano, 2016). A further similarity with Rio de Janeiro is the deslocation of the city center through the shift of modern activities to other areas combined with gentrification (Taschner & Bógus, 2001).
Concerning the size and the location of the slums, the local physical characteristics as well as the type of available land play important roles. In São Paulo, the main occupation can be observed on areas of common use, allotments, small plots or even areas of en-vironmental protection, wich are lacking governmental legislations (Gutberlet & Hunter, 2008; Taschner, 2001). Taschner (2001) states that due to this particularity, the size and number of slums in São Paulo are more likely to be subestimated.
As a result of the peri-urban development of a polycentrical conglomerate, there are no clearly identifiable borders between urban and rural areas (Davis & Kurz-Scherf, 2011; Hernández, Allen & Kellett, 2010). Finally, the city “São Paulo became more complex and more socially complicated and so did its physical form” (Hernández et al., 2010, p. 40).
2.4 Remote Sensing and in its application in slum
research
As slum population and areas are continuously increasing, there is a growing need of information about their geography, spatial dynamics, scales and population (Kuffer et al., 2016; Sliuzas & Kuffer, 2008). These information are important for policy makers, urban planners and aid-organisation in order to e.g. ensure an efficient post-disaster man-agement (Graesser et al., 2012). Furthermore, spatial information are essential for the assessment of policies as well as the monitoring of poverty targeting programs such as the UN SDGs (Kohli et al., 2013; Sliuzas & Kuffer, 2008). In contrast to this need, there is a lack of consistent, accurate and complete data such as maps, statistics and spatial data on the distribution of slums (Hofmann, Blaschke, Kux & Strobl, 2008; Herold et al., 2003). Owen and Wong (2013) state that ”in many parts of the developing world, census and socio-economic data is severely lacking, outdated, or not collected at neighbourhood scales“ (Owen & Wong, 2013, p.116). This deficit can be compensated by slum mapping with RS techniques.
In the last 15 year, there was an increase of scientific literature and research on slum mapping with RS which was promoted by the growing availability of VHR satellite im-ages (Kuffer et al., 2016). RS is capable of analysing space and time dynamics of slums
worldwide and monitor their expansion as well as densification (Kuffer et al., 2016). Ad-ditionally, RS is able to link these information with socio-economic factors (Kuffer et al., 2016). RS techniques show various advantages compared to surveying which is mostly time- and cost-intensive. Furthermore, census data are characterized by a low temporal resolution, with time gaps from five to ten years which impede the analysis of spatial dynamics in slums (Ebert, Kerle & Stein, 2009). On the contrary, satellite images are taken in constant time intervals which are available in almost real-time, providing inde-pendent, area-wide and up-to-date images (Hofmann et al., 2008; Taubenböck & Kraff, 2014). Therefore, RS techniques can be applied as an alternative cost-effective tool for slum mapping (Owen & Wong, 2013). Moreover, RS is capable of mapping slums even in hazardous areas where conventional surveying is difficult (Kuffer et al., 2016).
One obstacle for the availability of RS images is the cloud cover, especially in tropical areas. This problem is tackled by the ongoing development of VHR sensors that are able to penetrate clouds such as the TerraSAR-X (Kuffer et al., 2016) and studies utilizing these imageries for the mapping of slums (Wurm, Taubenböck, Weigand & Schmitt, 2017). Further disadvantages of RS are the complexity of methods which are necessary for the extraction of the desired spatial information and the required experts. The aim should be to develop methods that can be applied independently without experts (Hofmann et al., 2008).
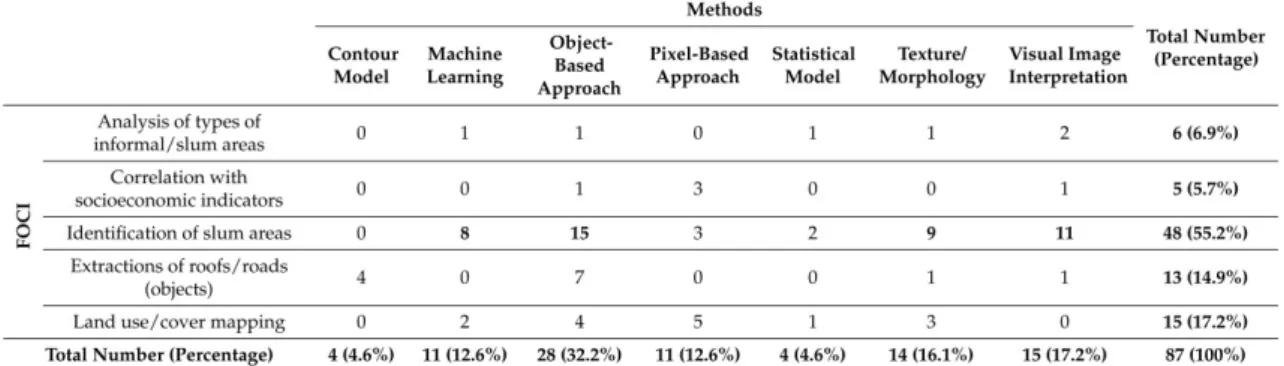
In the range of RS techniques, three main approaches for the extraction of spatial data from imagery can be distinguished: the VI, Object-Based Image Analysis (OBIA) and texture-based methods (TBM) as well as auxiliary methods such as machine learning, statistical methods and image texture (Baud, Kuffer, Pfeffer, Sliuzas & Karuppannan, 2010; Kuffer et al., 2016). Kuffer et al. (2016) executed a literature review in order to compare the frequency of methods applied for slum mapping (see figure 2.1). The most frequently applied method is the OBIA with 32.2% followed by the VI with 17.2%. Most of the studies (55.2%) aim at the mapping of the entire slum areas and fewer at the iden-tification of objects such as roads and houses. Moreover, only a small number of studies aim at examining the link between image-based and socio-economic factors (Kuffer et al., 2016).
Despite the increase of research in the field of slum mapping with the help of RS, a gener-ally applicable automatic classification method does not exist. This is mainly hampered by the inner-structural heterogeneity of slums as well as their structural and spatial ho-mogeneity (Hofmann et al., 2008; Kuffer & Barros, 2011; Taubenböck & Kraff, 2014). Additionally, the direct application to local conditions and the microstructure of slums impede to develop general indicators and algorithms (Taubenböck & Kraff, 2014). An inherent problem for all these methods is the lack of ground truth data for the accuracy assessment. Again, the deficiency of a general definition hampers the comparability of different data sources (Kuffer et al., 2016).
The aforementioned OBIA approach is able to extract information on both, the area and the objects. One critical issue of this method is its low robustness and transferability (Kuffer et al., 2016). It should be considered that low accuracies can be caused by a high heterogeneity, which means that accuracy results do not only depend on the applied
CHAPTER 2. BACKGROUND
Table 2.1: Frequency of methods versus main focus for slum mapping using VHR imagery (Kuffer et al., 2016, S. 14)
method but also on the existing morphology (Kuffer et al., 2016).
Hofmann et al. (2008) applied an OBIA using QuickBird data in order to detect slums in Rio de Janeiro. First, an ontology was created to describe the reality of the slums, followed by a multi resolution segmentation with eCognition. Further, a classification of the generated objects, an iterative process of knowledge-based object enhancement and (re-) classification were executed (Hofmann et al., 2008). At the end, results derived in a manual classification were used to assess the accuracy of the applied OBIA method, achieving an overall accuracy of 50% (Hofmann et al., 2008).
In this study, the applied method is a VI with the primary aim to identify the entire slum areas. It is executed by trained interpreters combining spectral and contextual inform-ation. For instance, Gruebner et al. (2014) delineated slums in Dhaka, Bangladesh via VI using primarily QuickBird images from the years 2006 and 2010 in order to obtain a temporal comparison. In addition to the QuickBird imagery, ancillary data such as the 2005 census and slum mapping data as well as Google Earth and geolocated photographs were included (Gruebner et al., 2014).
This process can be very time consuming and requires effective quality control to ensure consistent results (Sliuzas, 2004). Despite this, VI is often preferred to mostly less reliable semi-automatic approaches (Barnsley & Barr, 1996). For repetitive surveys and to cover large areas, the VI method shows some disadvantages, particularly in terms of quality control over time and between interpreters (Sliuzas & Kuffer, 2008).
The basic hypothesis for VI is that slums show significant physical differences to formal settlements so that a visual differentiation is possible. But it has to be considered that not only physical parameters characterize a slum and by applying VI important other indicators are missed out (Taubenböck & Kraff, 2014). Moreover, the physical character-istics may indicate a slum area but the living conditions may have changed due to e.g. upgrading of housing conditions.
The following chapter gives information on the utilized data. On the one hand, the applied raw EO data is listed. On the other hand, the Brazilian demographic census, specifically its data acquisition and the included information are described.
3.1 Earth Observation (EO) data
For the slum mapping via VI the Esri World Imagery Basemap was used as the primary data source. This map includes 15 m TerraColor imagery at small and mid-scales, 2.5 m SPOT imagery and data from DigitalGlobe as well as from the Geographic Information System (GIS) user community with a spatial resolution of up to 0.5 m. If the resolution of the Esri World Imagery Basemap was not sufficient, GoogleTM Street View and Goog-leTM Earth were utilized as ancillary sources.
In order to examine the temporal dimension of the slums as well as to compare the slum development with the total urban settlement sprawl, the Global Urban Footprint (GUF) (Esch et al., 2012; Taubenböck et al., 2012) was utilized which is based on Landsat and TerraSAR-X imagery. A detailed description of the GUF is given in chapter 4.
The Landsat mission is a joint initiative of the U.S. Geological Survey (USGS) and United States National Aeronautics and Space Administration (NASA) (U.S. Department of the Interior & U.S. Geological Survey, 2017). The mission started with the Multi Spectral Scanner (MSS), with a spatial resolution of 59 m and four spectral bands (green, red, two NIR). Since 1982 the satellites are equipped with a Thematic Mapper (TM) with an advanced spatial resolution of 30 m and six spectral bands and one thermal band (U.S. De-partment of the Interior & U.S. Geological Survey, 2017). Landsat 7 which was launched in 1999 has an Enhanced Thematic Mapper (ETM) with an additional panchromatic band with a spatial resolution of 15 m. In the GUF, Landsat imageries from around the time steps 1975, 1990 and 2000 were used, depending on the availability of cloud-free images (Taubenböck et al., 2012).
Furthermore, TerraSAR-X data is utilized. The TerraSAR-X satellite is one of the two spacecrafts of the German TanDEM-X satellite mission which started in June 2010 (Esch et al., 2012; Zink et al., 2006). The goal was to acquire two VHR Synthetic Aperture Radar (SAR) datasets with a global coverage for 2011 and 2012, thus a homogenuous, consistent dataset (Esch et al., 2012; Zink et al., 2006). The TerraSAR-X satellite has a spatial resolution of about 3 m and a swath width of 30 km with the length of one strip of several hundreds of km (Esch et al., 2012; Taubenböck et al., 2012). This data has the advantages of being weather independent and consistently available for the global landmasses (Esch et al., 2012; Taubenböck et al., 2012).
CHAPTER 3. DATA
3.2 Census in Brazil
With an interval of ten years, the Brazilian governmental IBGE conducts a comprehens-ive census, covering the whole country. The most recent census has been executed in 2010, including a special feature, the "Levantamento de Informações Territoriais -LIT" (engl. Enquiry of territorial information). This comprehends the collecting of data and information on identification and characterisation of slums, including morphological par-ticularities. Beside the demographic information as well as the structural characteristics, the Census 2010 provides georeferenced data of the location of the slums (Pasternak & D’Ottaviano, 2016). The latter should be pointed out specifically as in most of the countries in the Global South, census are mostly restricted to the head-counted method without providing any detailed spatial information (Kohli et al., 2012).
The term for slums used in the census is "aglomerados subnormais" which corresponds in English to "abnormal agglomerations" and includes favelas, invasions, stilt settlements as well as illegal allotments that have been regularized recently, etc. (Instituto Brasileiro de Geografia e Estatística, 2011). During data acquisition, the focus has been on the identification of characteristics and location of the area, existing urban patterns such as access network and the settlement’s degree of density as well as verticalisation (Instituto Brasileiro de Geografia e Estatística, 2011).
For the execution of the census, the country was divided into sectors, which is the smallest territorial unit. In total, 317.000 census sectors were defined from which 15.686 thus 5% were classified as slums (Instituto Brasileiro de Geografia e Estatística, 2011). In the pro-cess of identification and localisation, the number of dwellings was counted. A dwelling is defined as structurally seperated and independent, fulfilling the function of habitation for one or more people (Instituto Brasileiro de Geografia e Estatística, 2011).
The sectors are classified by their prevalent characteristics which does not mean that every single dwelling shows these characteristics. Therefore, the exact number of slum dwellings cannot be determined (Instituto Brasileiro de Geografia e Estatística, 2011). Moreover, it is important to note that one slum can consist of more than one sector. The applied criteria for the delineation of slums in the census are: a minimum of 51 dwellings and the illegal occupation of public or private property. Moreover, at least one of the following characteristics must be true: a) urbanisation against the prevailing patterns such as irregular orientation of the buildings, different sizes and forms of building lots, b) constructions not regularized by public authorities and/or c) precarious supply with public services such as energy, water, waste and sewage management (Instituto Brasileiro de Geografia e Estatística, 2011).
The density of the slums is not only determined by the lack of spaces between the build-ings but also through verticalisation which is mentioned as typical for the metropolitan regions of Rio de Janeiro and São Paulo.
Furthermore, the census provides further demographic information of the single sectors such as number of inhabitants, number of male and female inhabitants, the age and number of children of the dwellers as well as economic variables such as income.
Firstly, this chapter gives details about the selection of the study sites as well as informa-tion on the two selected cities Rio de Janeiro and São Paulo. Further, it briefly describes the methodology applied for the mapping of the slums in Rio de Janeiro by Fricke (2015). This method was partly used as the conceptual framework for the VI of the slums from EO data in São Paulo.
4.1 Selection of the study sites
The two main requirements for the selection of the two cities were comparability and availability of data. Concerning the former, the cities should show similar size and number of inhabitants. With the provision of the spatial and structural data derived from EO data for Rio de Janeiro (Fricke, 2015) as well as the availability of census data for the entire country of Brazil including spatial data, the first city was certain.
The second city should also be a megacity with more than ten million inhabitants, (United Nations, Department of Economic and Social Affairs (UN DESA), Population Division, 2014) which is located in the Global South and has available census data including spatial information on slums. In order to request information about existing spatial information on slums, several non-governmental organisations and institutions were contacted with no or negative responses.
Consequently, as there exist census data including geo-spatial data for the entire Brazil and a comparison of the slums of two cities in one country is particularly interesting, the city of São Paulo was chosen. Further criteria on the selection of the study site will be mentioned in chapter 5.
4.2 Global Urban Footprint
As mentioned before, with the rapid urban growth emerges the necessity of monitoring and observing urban development in order to handle potential problems, risks as well as to apply suitable policies. Addressing this demand, Esch et al. (2012) introduced an approach to automatically differentiate built-up area - meaning settlement area - from non-built-up area using VHR TerraSAR-X imagery from the TanDEM-X mission from 2011 and 2012. Furthermore, using the resulting GUF (Esch et al., 2012), Taubenböck et al. (2012) created a multi-temporal and multi-sensoral dataset, mapping the urban sprawl of 27 mega cities over a time period of 40 years by applying a change detection, utilizing Landsat imageries (see chapter 3).
CHAPTER 4. METHODOLOGY
The time steps were chosen in an interval of around ten years: 1975, 1990, 2000 and 2010. For the first three time steps, different Landsat imageries were used and for 2010 radar datasets from the TerraSAR-X were utilized.
The study by Taubenböck et al. (2012) includes several accuracy tests which all resulted in an overall accuracy of 80%, giving an ”objective basis [...] for monitoring, assessing and evaluating the process of urbanization“ (Taubenböck et al., 2012, p.174). The resulting dataset enables the assessment of horizontal urban sprawl on a spatial and temporal dimension. In this study, the GUF is applied for the evaluation of the urban growth of Rio de Janeiro and São Paulo and the comparison of the slum areas in relation to the total settlement area. Moreover, the four time steps of the GUF are used to analyse the temporal dimension of the slums.
4.3 Data acquisition
In the following, the applied methodologies for the slum mapping for Rio de Janeiro (Fricke, 2015) and São Paulo will be presented.
4.3.1 Rio de Janeiro
The spatial and structural data for the slums in Rio de Janeiro were derived from the bachelor thesis “Slums in Rio de Janeiro: spatial and morphological analyses of slums derived from remote sensing data based on visual interpretation” by Fricke (2015). The VI of EO data and hence the classification of the slums in Rio de Janeiro are based on the definition by Kuffer et al. (2013) (see chapter 2.2). The mapping of the slums was executed on block level, except if the size of the blocks was too small, they were summarized. An individual slum was identified when the slum blocks were divided by a road or open space exceeding ten meters (Fricke, 2015). Fricke (2015) distinguishes between two categories of slums, based on the categorization by UN-HABITAT (2003). The first category is a combination of the UN-classes favelas and invasions which show similar characteristics such as a heterogeneous morphology and being located on steep slopes. A clear differentiation between these two classes is impossible via VI of EO data, therefore they were summarized. The second category are slums of the type loteamentons that are characterized by a more regular arrangement as well as a visible access network (Fricke, 2015). In summary, 2.022 slum polygons were drawn.
In addition to the slum mapping, the average building density and building height of the slums blocks were determined. The building density is defined as the ratio of the built-up area to the associated block area (Fricke, 2015). In total, five density classes with a range of 20% were defined. In order to simplify the VI, five slum blocks with probably different densities were chosen of which all the included buildings were digitized. With this data, the actual built-up area was calculated. These sample slum blocks were used as a visual support for the assignment of the density classes for all slum blocks (Fricke, 2015). The second quantitative variable is the average building height of the slum blocks. Fricke (2015) divided five building height classes depending on the number of storeys.
Figure 4.1: The six general indicators categorized to form a hierarchy to represent concepts at three spatial levels (Kohli et al., 2012, S. 158)
4.3.2 São Paulo
As the basis for the VI and classification of the slums in São Paulo, the applied method-ology by Fricke (2015) was used. Additionally, an ontmethod-ology was created, according to the Generic Slum Ontology (GSO) by Kohli et al. (2012). The following section defines the term ontology in general and describes the created slum ontology for the metropolitan region of São Paulo in detail, explaining the chosen indicators. Furthermore, the entire process of VI and categorisation is explained and differences compared to the methodology of Fricke (2015) to Rio de Janeiro are indicated.
Ontology
There is a growing interest in applying ontologies as a tool for representing knowledge in research, in which one of the shared ideas is the facilitation of information exchange (Kohli et al., 2012, S. 155). There exist different interpretations of the term ontology depending on the respective discipline. Swartout et al. (1997) define the term as the following: “An ontology is a hierarchically structured set of terms for describing a domain that can be used as a skeletal foundation for a knowledge base”(Swartout et al., 1997, S. 138). Fur-thermore, an ontology can be described as a systematic approach for the creation of a concept representing reality (Agarwal, 2005). Although, a growing interest in applying ontologies in GIScience can be observed, a comprehensive method for the generation of ontologies in the geo-spatial field does not exist (Timpf, 2002).
Ontologies facilitate and increase interoperability as well as data exchange between differ-ent users and systems by creating a structured conceptualisation and a common termino-logy (Agarwal, 2005). This is essential as different users can have different interpretations of one issue, leading to misunderstandings or inconsistency (Timpf, 2002).
CHAPTER 4. METHODOLOGY
Ontology São Paulo
The lack of a generic definition of slums and their heterogeneity hinder the creation of a universal method for detecting slums, using RS techniques. This results in the need of a definite and clear conceptualisation and definition of the object of interest (Kohli et al., 2012). For this reason, Kohli et al. (2012) developed a GSO, defining relevant indicators for the identification and classification of slums (Kohli et al., 2012). With the help of these indicators, the actual characteristics of slums can be related to the image. As slums show different characteristics in different locations, the GSO depends on the spatial context and should be adjusted according to the local slum morphology (Kohli et al., 2013). In this study, the GSO by Kohli et al. (2012) is used as a conceptual framework for the visual slum classification. The different indicators and attributes were adapted for the metropolitan region of São Paulo. The categorisation into favelas/invasions and lotea-mentons was not applied for São Paulo because a clear determination via VI was not possible. Therefore, the categories are not considered in the analyses (see chapter 5). Kohli et al. (2012) compiled slum characteristics on three spatial levels: the object level, the settlement level and the environment (see figure 4.1)(Kohli et al., 2012, S. 156) similar to the division by Taubenböck and Kraff (2014) into building level, block level and district level (Taubenböck & Kraff, 2014).
Kohli et al. (2012) suggest three phases for the creation of the slum ontology: specific-ation, conceptualisation and implementation (Kohli et al., 2012). The first phase, the specification, includes a literature review in order to collect information on concepts and characteristics of slums. In this study a literature review was done collecting information on slum characteristics in general (see chapter 2.2) as well as for São Paulo specifically (see section 2.3.2).
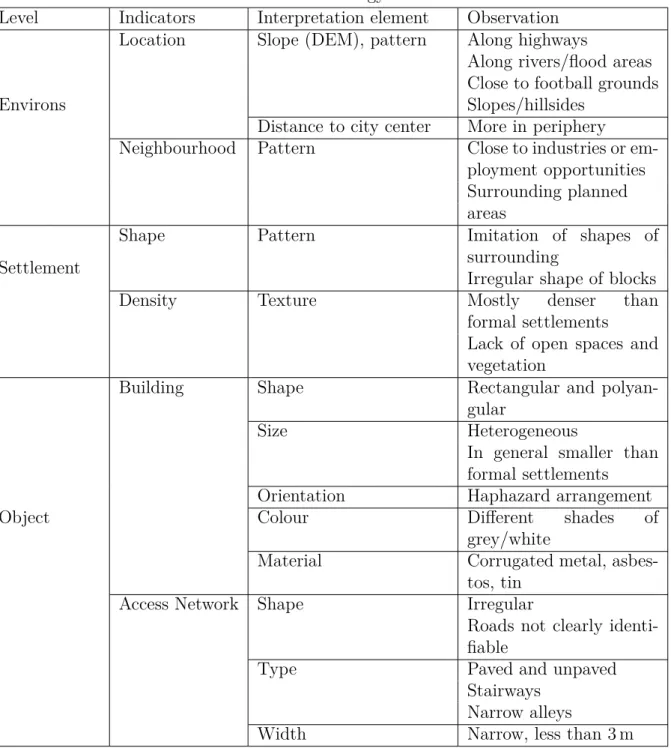
The second step is the conceptualisation, which is the process of structuring and organ-izing the previously collected information, representing the first results in a semi-formal way (Kohli et al., 2012). As the structural framework of the slum ontology for São Paulo, the six general indicators at the three spatial levels (see figure 4.1) proposed by Kohli et al. (2012) were adapted and visible interpretation elements as well as spatially specific observations were acquired (see table 4.1).
At the environs level, the location and the neighbourhood are indicators for slums. For the location, it can be stated that slums often develop on hazardous sites as they are unsuitable for formal settlements. Examples for such locations are hillsides, along rivers and flood areas or along highways (Kohli et al., 2012; Hernández et al., 2010). Another factor of the location of slums is the distance to the city center. In the case of São Paulo it can be observed that the concentration of slums is higher in the periphery of the city (see section 2.3.2).
The location of slums is also interrelated with neighbourhood characteristics. An im-portant factor is the availability of job opportunities mostly for unskilled or low-skilled workers (Davis & Kurz-Scherf, 2011).
On the settlement level, shape and density of the settlements are important indicators. The shape is characterized by an irregularity of the settlement blocks. Moreover, slums tend to imitate shapes of features of their surrounding such as highways, railways or rivers
(Davis & Kurz-Scherf, 2011; Neuwirth, 2016). Slums often show a higher building density compared to formal settlements. However, this factor is not suitable as a sole indicator for slums as the process of densification is typical over time resulting in a dependency of the density on the age of the settlement (Kohli et al., 2012; Pasternak & D’Ottaviano, 2016). Moreover, building density or roofcoverage can be a misleading indicator as there also exist both dense formal settlements and low density slums (Kohli et al., 2012). Fur-thermore, a lack of open spaces and vegetation is characteristic on the settlement level (Kohli et al., 2012).
The last level is the object level, giving information on the two indicators building and access network. A building is defined as a construction which consists of a roof and walls (Kohli et al., 2012). Buildings in slums show differences to buildings in formal settle-ments in the following attributes: shape, size, orientation, colour and material. Slums mostly show a rectangular or polyangular shape of the buildings. Concerning the size of the buildings in slums, it can be stated that the average size is smaller than in formal settlements (Kuffer & Barros, 2011). Their orientation is characterized by a haphazard arrangement and an organic layout pattern (Kohli et al., 2012; Kuffer & Barros, 2011). The last two attributes are interrelated as the colour of the roof depends on its material. The most common roof materials for buildings in slums are corrugated metal, tin or as-betos, resulting in a roof colour of different shades of grey or white (Kohli et al., 2012). Furthermore, the access network plays an important role for the visual classification of slums. It is in general a heterogeneous indicator for slums as the roads differ in width, type and surfaces (Kohli et al., 2012). The shape of the street network is irregular and single roads are mostly not clearly identifiable. Both paved and unpaved roads are typical as well as stairways and narrow alleyways. The average width of the roads within the slum is less than three meters (Sliuzas & Kuffer, 2008). In general, it can be stated that access roads and streets within slums are smaller than ten meters, which is defined as the average width of a major road by Gruebner et al. (2014). Finally, it can be resumed that slums are a heterogeneous phenomenon concerning all of the mentioned characteristics. The last phase is the implementation thus the application of the indicators on the slum classification in the image (Kohli et al., 2012).
Visual interpretation (VI)
At the beginning of the process of VI - the implementation phase of the ontology - a grid was created with cells of a size of 25-30 ha to facilitate the orientation. Areas with characteristics according with the slum ontology of São Paulo were digitized with polygons on block level. In order to minimize subjectivity, ambiguous settlements were primarily marked as ”unsure“ and were re-assessed. In total, 3577 polygons were digitized and classified as slums for the city of São Paulo.
Building density
The categorisation of the building density for São Paulo was executed as for Rio de Janeiro by Fricke (2015). The density classes are set in an interval of 20%. Five sample slum
CHAPTER 4. METHODOLOGY
Table 4.1: Slum Ontology São Paulo
Level Indicators Interpretation element Observation
Environs
Location Slope (DEM), pattern Along highways
Along rivers/flood areas Close to football grounds Slopes/hillsides
Distance to city center More in periphery
Neighbourhood Pattern Close to industries or em-ployment opportunities Surrounding planned areas
Settlement
Shape Pattern Imitation of shapes of surrounding
Irregular shape of blocks Density Texture Mostly denser than
formal settlements Lack of open spaces and vegetation
Object
Building Shape Rectangular and polyan-gular
Size Heterogeneous
In general smaller than formal settlements Orientation Haphazard arrangement Colour Different shades of
grey/white
Material Corrugated metal, asbes-tos, tin
Access Network Shape Irregular
Roads not clearly identi-fiable
Type Paved and unpaved Stairways
Narrow alleys
40-60% 80-100% 0-20% 0 25 50Meters
¯
0 25 50Meters¯
0 25 50Meters¯
Service Layer Credits: Source: Esri, DigitalGlobe, GeoEye, Earthstar Geographics, CNES/Airbus DS, USDA, USGS, AeroGRID, IGN, and the GIS User Community Legend Slum boundary Housing units 20-40% 60-80% 0 25 50Meters
¯
0 25 50Meters¯
Figure 4.2: Reference polygons for the five building density classes
blocks were chosen with apparently different density classes of which all the buildings were digitized (see figure 4.2). Thereupon, the ratio of built-up to not built-up area was calculated. These sample slum blocks were used as references and visual support for the categorisation of the building density for all of the slums.
The building density classes were also assigned to the census slums in Rio de Janeiro and São Paulo.
Building height
As the clear differentiation of the number of storeys is difficult, only two categories were distinguished for São Paulo, one-storeyed and multi-storeyed (see figure 4.3). As mentioned before, verticalisation is a common process in the slum development so that the two categories can give indications for the age of the respective slum (Pasternak & D’Ottaviano, 2016).
The building height was also estimated for the census slums for both cities. Further-more, the building height classes for the morphological slums in Rio de Janeiro were re-categorized as the determined classes by Fricke (2015) did not combine with the
differ-CHAPTER 4. METHODOLOGY
Service Layer Credits: Source: Esri, DigitalGlobe, GeoEye, Earthstar Geographics, CNES/Airbus DS, USDA, USGS, AeroGRID, IGN, and the GIS User Community
Legend Slum boundary One-storeyed Multi-storeyed
¯
0 50 100Meters¯
0 50 100MetersFigure 4.3: Reference polygons for the two building height classes
entiation into one- and multi-storeyed.
4.4 Comparison
In the following, the processing of the created dataset in order to compare and analyse it on the three dimensions area, time and location will be described. The spatial analyses as well as the creation of maps were executed in ArcGIS and the visual as well as statistical analyses in ’R’. The area was calculated in all cases by using the Esri tool ”Calculate Geometry“.
4.4.1 Area
Firstly, in order to compare the area of slums, the area of intersection of census and morphological slums was identified for both cities. This was achieved by the Esri tool ”Select by location“. As a result, all morphological slums that intersect with census slums were selected. In order to extract only the area that was classified by both approaches, these selected areas were clipped by the shape of the census slums.
On the basis of the assigned density classes, the built-up and not built-up area of the slums can be calculated approximately. For this calculation, the mean values of the density classes were used to estimate the built-up area, e.g. for the density class 0-20% the mean value 10% was used for calculation (di). In order to get the total built up area
of the slums, the following calculation was applied (see 4.1). Ai is the sum of the area for
every single density class di.
X
(Ai∗di/100) (4.1)
4.4.2 Time
For the dimension of time, the temporal information of the GUF was utilized. It is important to bear in mind that one slum polygon could be split into different years in the GUF, therefore, two different processing approaches were possible. On the one hand, the slum polygons could be dissected along the temporal boundaries. The result would represent the absolute area of slums in the different time steps. Though, the assigned density values would not be valid any more, as they are an average for the original slum polygon.
On the other hand, the year with the highest proportion inside the slum polygon could be assigned by applying the Esri tool ”spatial join“and choosing the ”merge rule” ”modus“ for the information ”year“. This method was applied as the density class values are preserved allowing the temporal dimension to be complemented by the factor building density.
4.4.3 Location
Based on a monocentric city model and the theory that there is a concentration of job opportunities in the central part of the city (Alonso, 1964), the Central Business District (CBD) was chosen as the city center in Rio de Janeiro and São Paulo. In Rio de Janeiro, the CBD was set in the Avenida Rio Branco (Fricke, 2015) and in São Paulo in the Avenida Boa Vista as proposed by the Prefeitura São Paulo (Prefeitura de São Paulo Desenvolvimento Urbano, n.d.). In order to evaluate the distribution of the slums in reference to the city center, a ring buffer was created with a distance of 5 km (see appendix figures A.5 and A.6). Afterwards, the slum polygons were divided along the buffer zones utilizing the Esri tool ”Identity“, so that in some cases, the slum polygons were split as they stretched over different buffer zones.
5 Results
The following chapter presents the results of the spatial comparison of the two slum classification methods for the cities Rio de Janeiro and São Paulo. First, the selection of the study sites will be explicated. Subsequently, they will be presented briefly, above all in terms of their urban area and spatial extent. These information are important in order to understand the following analyses in the three dimensions area, time and location in the respective urban context of the two cities.
5.1 Study sites
As mentioned in chapter 4, the two main requirements for the selection of the study sites are comparability in terms of size as well as number of inhabitants and availability of data. After a literature review, São Paulo was chosen as the second study site. Beside the status of a megacity, Rio de Janeiro and São Paulo are classified as a mega-region (e.g., Florida, Gulden & Mellander, 2008; UN-HABITAT, 2010). The UN-HABITAT (2010) defines mega-regions as polycentric urban clusters, surrounded by a low-density periphery which resulted from growth, convergence and spatial spread of geographically linked metropolitan areas and other agglomerations (UN-HABITAT, 2010). They are characterized by a considerably larger population as well as spatial growth (Florida et al., 2008; Taubenböck et al., 2014). Taubenböck and Kraff (2015) conclude that the two megacities are not yet connected by examining the spatial connectivity based on the density of the settlements. Considering the continuing urbanisation, it is possible that Rio de Janeiro and São Paulo will be connected in the future as settlement density will increase.
Furthermore, the comparability of the two cities as well as the relevance is strengthened by the fact that they are located in the ”economic heart“ of Brazil where about 90% of the population is urban (Gutberlet & Hunter, 2008, p. 4).
5.1.1 Rio de Janeiro
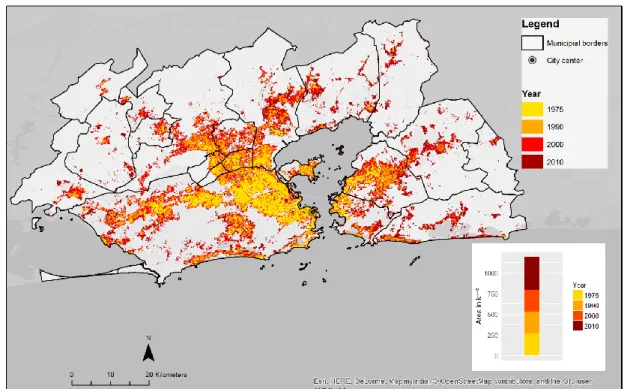
The total urbanized area of Rio de Janeiro (see figure 5.1) has an extent of around 1190 km2 according to the GUF (Taubenböck et al., 2012). The city shows an irregular
urban sprawl which results from its topography that is characterized by hillsides and the Guanabara Bay. The city center is located on the southwest side of the bay and urban patterns can be observed in an irregular arrangement around the bay.
In 1975, 22% of the total urban area detected in 2010 already existed and almost the same proportion added up until 1990. The highest ratio of urban sprawl can be seen in
Figure 5.1: GUF Rio de Janeiro (Data source: Taubenböck et al. (2012). Own illustration)
the time period between 2000 and 2010 when around 400 km2 of new settlement area were
classified, primarily in the north and southeast of the metropolitan region.
5.1.2 São Paulo
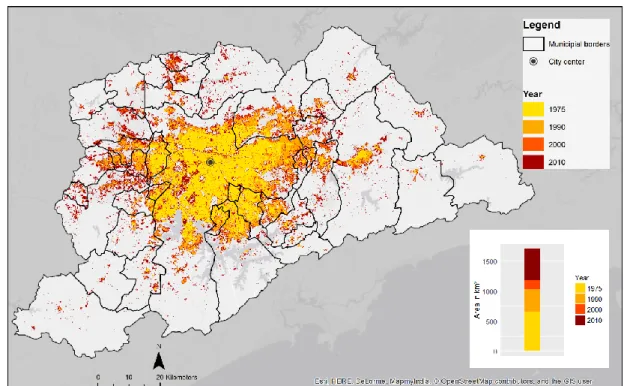
In São Paulo, around 1710 km2 are urbanized area of which over one third already existed
in 1975 (see figure 5.2). For the decade between 2000 and 2010, a growth rate of the urbanized area almost as high as the area existent in 1975 was detected. According to the GUF, the lowest urban expansion happened between 1990 and 2000 (Taubenböck et al., 2012).
In contrast to Rio de Janeiro, for São Paulo a circular expansion of the city is visible. Most of the younger settlement areas can be located in a longer distance to the city center, in the peripheries. The highest urbanisation of the metropolitan region of São Paulo can be observed in the central municipality São Paulo. In contrast to this, the peripheral municipalities show a lower density and in total less urbanized area.
5.2 Area
Figure 5.3 and 5.4 show the spatial distribution of the slums in Rio de Janeiro and São Paulo. In both maps an extent of the metropolitan regions was chosen, where most of
CHAPTER 5. RESULTS
Figure 5.2: GUF São Paulo (Data source: Taubenböck et al. (2012). Own illustration)
the slums are located. The yellow colour shows the slum areas, which were classified by both, the census and morphological classification. The red colour represents slums that were only mapped by the latter and the salmon coloured areas by the former. The spatial distribution of the slum area of the single methods is shown in appendix figures A.1-A.4. The following analysis dimension compares the slum classification results by their area, building density and building height.
Slum area
Figure 5.5 shows the areas of census and morphological slums and their area of intersec-tion for both cities. In Rio de Janeiro, 123,01 km2 of slum area were classified by the
demographic census, 30 km2 by Fricke (2015) and 26 km2 are overlapping. Expressed in
percentage, around 87% of the morphologically classified slums overlap with the census slums, which adds up to one fifth of the total census area.
For São Paulo, the census classified 88,33 km2 as slums, the morphological approach
59,83 km2 whereof 58%, thus 34,15 km2 are overlapping. In other words, one third of
the census area was also classified as slum by the morphological approach. It can be observed that in both cities, more area was classified as slum by the census.
In figure 5.3 of Rio de Janeiro, it is visible that large areas were only classified by the census. Some of these areas do not show settlement patterns neither in the GUF nor on the Ersi basemap so that in matters of physical characteristics, the classification of these
Figure 5.3: Spatial distribution of slums in Rio de Janeiro (Data sources: Fricke (2015); In-stituto Brasileiro de Geografia e Estatística (2010); Taubenböck et al. (2012). Own illustration)
Figure 5.4: Spatial distribution of slums in São Paulo (Data sources: Instituto Brasileiro de Geografia e Estatística (2010), own dataset, Taubenböck et al. (2012). Own illustration)
CHAPTER 5. RESULTS
Rio de Janeiro São Paulo
0 25 50 75 100 125 Area in km² Type Census Morphological Intersection
Figure 5.5: Comparison of census and morphological slum area as well as their area of intersection (Data sources: Fricke (2015); Instituto Brasileiro de Geografia e Estatística (2010), own dataset. Own illustration)
areas is not comprehensible.
Building density
Figure 5.6 displays the area of census and morphological slums in the five building density classes. The results show that around 61 km2 of the census slums in Rio de Janeiro were
categorized with a building density of 0-20% which is about half of the total census slum area. In contrast, only 2% of the morp