Orientation and mobility training for adults with low vision
(Review)
Virgili G, Rubin G
This is a reprint of a Cochrane review, prepared and maintained by The Cochrane Collaboration and published inThe Cochrane Library 2010, Issue 5
T A B L E O F C O N T E N T S 1 HEADER . . . . 1 ABSTRACT . . . . 2
PLAIN LANGUAGE SUMMARY . . . .
2
SUMMARY OF FINDINGS FOR THE MAIN COMPARISON . . . .
5 BACKGROUND . . . . 6 OBJECTIVES . . . . 6 METHODS . . . . 8 RESULTS . . . . Figure 1. . . 11 12 DISCUSSION . . . . 14 AUTHORS’ CONCLUSIONS . . . . 15 ACKNOWLEDGEMENTS . . . . 15 REFERENCES . . . . 17 CHARACTERISTICS OF STUDIES . . . . 23 DATA AND ANALYSES . . . .
Analysis 1.1. Comparison 1 Orientation & Mobility training versus physical exercise, Outcome 1 Total score (using
structured skills assessment). . . 23 Analysis 1.2. Comparison 1 Orientation & Mobility training versus physical exercise, Outcome 2 Orientation subscale
(using structured skills assessment). . . 24 Analysis 1.3. Comparison 1 Orientation & Mobility training versus physical exercise, Outcome 3 Sighted guide subscale
(using structured skills assessment). . . 24 Analysis 1.4. Comparison 1 Orientation & Mobility training versus physical exercise, Outcome 4 Independent subscale
(using structured skills assessment). . . 25 25 APPENDICES . . . . 28 WHAT’S NEW . . . . 28 HISTORY . . . . 28 CONTRIBUTIONS OF AUTHORS . . . . 29 DECLARATIONS OF INTEREST . . . . 29
DIFFERENCES BETWEEN PROTOCOL AND REVIEW . . . .
29
[Intervention Review]
Orientation and mobility training for adults with low vision
Gianni Virgili1, Gary Rubin2
1Department of Specialised Surgical Sciences, University of Florence, Florence, Italy.2Institute of Ophthalmology, London, UK
Contact address: Gianni Virgili, Department of Specialised Surgical Sciences, University of Florence, Via le Morgagni 85, Florence, 50134, [email protected].
Editorial group:Cochrane Eyes and Vision Group.
Publication status and date:New search for studies and content updated (no change to conclusions), published in Issue 5, 2010.
Review content assessed as up-to-date: 30 March 2010.
Citation: Virgili G, Rubin G. Orientation and mobility training for adults with low vision.Cochrane Database of Systematic Reviews 2010, Issue 5. Art. No.: CD003925. DOI: 10.1002/14651858.CD003925.pub3.
Copyright © 2010 The Cochrane Collaboration. Published by John Wiley & Sons, Ltd.
A B S T R A C T Background
Orientation and mobility (O&M) training is provided to people who are visually impaired to help them maintain travel independence. It teaches them new orientation and mobility skills to compensate for reduced visual information.
Objectives
The objective of this review was to assess the effects of O&M training, with or without associated devices, for adults with low vision.
Search methods
We searched the Cochrane Central Register of Controlled Trials (CENTRAL) (which contains the Cochrane Eyes and Vision Group Trials Register) (The Cochrane Library,2010, Issue 3), MEDLINE (January 1950 to March 2010), EMBASE (January 1980 to March 2010), Latin American and Caribbean Literature on Health Sciences (LILACS) (January 1982 to March 2010), System for Information on Grey Literature in Europe (OpenSIGLE) (March 2010), themetaRegister of Controlled Trials (mRCT) (www.controlled-trials.com) (March 2010), ClinicalTrials.gov (http://clinicaltrials.gov)(March 2010), ZETOC (March 2010) and the reference lists of retrieved articles. There were no language or date restrictions in the search for trials. The electronic databases were last searched on 31 March 2010.
Selection criteria
We planned to include randomised or quasi-randomised trials comparing O&M training with no training in adults with low vision.
Data collection and analysis
Two authors independently assessed the search results for eligibility, evaluated study quality and extracted the data.
Main results
Two small studies satisfied the inclusion criteria. They were consecutive phases of development of the same training curriculum and assessment tool. The intervention was administered by a volunteer on the basis of written and oral instruction. In both studies the randomisation technique was inadequate, being based on alternation, and masking was not achieved. Training had no effect in the first study but tended to be beneficial in the second but not to a statistically significant extent. Reasons for differences between studies may have been: the high scores obtained in the first study, suggestive of little need for training and small room for further improvement (a ceiling effect), and the refinement of the curriculum allowing better tailoring to patients’ specific needs and characteristics, in the second study.
Authors’ conclusions
The review found two small quasi-randomised trials with similar methods, comparing training to physical exercise and assessing O& M physical performance by means of a volunteer or a professional, which were unable to demonstrate a difference. Therefore, there is little evidence on which type of O&M training is better for people with low vision who have specific characteristics and needs. Orientation and mobility instructors and scientists should plan randomised controlled trials (RCTs) to compare the effectiveness of different types of O&M training. A consensus is needed on the adoption of standard measurement instruments of mobility performance which are proven to be reliable and sensitive to the diverse mobility needs of people with low vision. For this purpose, questionnaires and performance-based tests may represent different tools that explore people with low vision’s subjective experience or their objective functioning, respectively. In fact, it has to be observed that low vision rehabilitation research is increasingly shifting towards the use of quality of life questionnaires as an outcome measure, sometimes with the aim to study complex and multidisciplinary interventions including different types of education and support, of which O&M can be a component. An example of this is an ongoing cluster RCT conducted by Zijlstra et al. in The Netherlands. This trial is designed to compare standardised O&M training with usual O& M care not only for its effectiveness, but also its applicability and acceptability. This study adopts validated questionnaires for patients’ subjective assessment of performance during activities of daily living. As performance assessment does not need to be made by an O& M trainer, this allows for masking of assessors and a patient-centred outcome measure.
P L A I N L A N G U A G E S U M M A R Y
Orientation and mobility training for people with low vision
Progressive visual impairment often affects people as they age. Training is used to help people with low vision maintain travel indepen-dence, with new orientation and mobility skills to compensate for reduced visual information. Orientation is the ability to recognise one’s position in relation to the environment, whereas mobility is the ability to move around safely and efficiently. Orientation and mobility (O&M) training teaches people to use their remaining vision and other senses to get around. Canes and optical aids may also be used.
We found two small studies with a total of 63 people comparing O&M training delivered by a trained volunteer to physical exercise. These studies did not show a difference between the two interventions, but they had little power to do so because of the small sample size and poor methodological quality. There were no adverse effects of O&M training in these studies.
There is little evidence from randomised controlled trials on which type of O&M training is better for people with low vision who have specific characteristics and needs.
S U M M A R Y O F F I N D I N G S F O R T H E M A I N C O M P A R I S O N [Explanation]
Orientation & Mobility training compared to physical exercise for adults with low vision Patient or population:patients with adults with low vision
Settings:
Intervention:Orientation & Mobility training Comparison:physical exercise
Outcomes Illustrative comparative risks* (95% CI) Relative effect (95% CI)
No of Participants (studies)
Quality of the evidence (GRADE)
Comments
Assumed risk Corresponding risk physical exercise Orientation & Mobility
training Total score (using
struc-tured skills assessment) 0 to 100. Scale from: 0 to 100.
The mean total score (us-ing structured skills as-sessment) ranged across control groups from 61 to 85 percentage of behaviours performed out of the number of be-haviours appropriate for that person
The mean Total score (using structured skills assessment) in the inter-vention groups was 2.9 higher (6.9 lower to 12.6 higher) 67 (2 studies) ⊕ very low1,2,3,4,5
*The basis for theassumed risk(e.g. the median control group risk across studies) is provided in footnotes. Thecorresponding risk(and its 95% confidence interval) is based on the assumed risk in the comparison group and therelative effectof the intervention (and its 95% CI).
CI:Confidence interval;
GRADE Working Group grades of evidence
High quality:Further research is very unlikely to change our confidence in the estimate of effect.
Moderate quality:Further research is likely to have an important impact on our confidence in the estimate of effect and may change the estimate. Low quality:Further research is very likely to have an important impact on our confidence in the estimate of effect and is likely to change the estimate. Very low quality:We are very uncertain about the estimate.
O ri e n ta ti o n a n d m o b ili ty tr a in in g fo r a d u lt s w it h lo w v is io n (R e v ie w ) C o p y ri g h t © 2 0 1 0 T h e C o c h ra n e C o lla b o ra ti o n . P u b lis h e d b y Jo h n W ile y & S o n s, L td .
2Heterogeneity is difficult to asses with two studies in the review.
3Findings from two small studies conducted by the same review group cannot be assumed to be generalisable 4Each study could not exclude an effect size close to 1 based on 95%CIs.
5We believe that studies published on grey literature can be difficult to retrieve in this field.
xxxxxxxxxxxxxxxxxxxxxxxxxxxxxxxxxxxxxxxxxxxxxxxxxxxxxxxxxxxxxxxxxxxxxxxxxxxxxxxxxxxxxxxxxxxxxxxxxxxxxxxxxxxxxxxxxxxxxxxxxxxxxxxxxxxxxxxxxxxxxxxxxxxxxxxxxxxxxxxxxxxxxxxxxxxxxxxxxxxxxxxxxxxxxxxx O ri e n ta ti o n a n d m o b ili ty tr a in in g fo r a d u lt s w it h lo w v is io n (R e v ie w ) C o p y ri g h t © 2 0 1 0 T h e C o c h ra n e C o lla b o ra ti o n . P u b lis h e d b y Jo h n W ile y & S o n s, L td .
B A C K G R O U N D
Description of the condition
The World Health Organization (WHO) has established criteria for low vision which are used in the International Classification of Diseases (WHO 1992). Visual impairment is defined as a best-corrected visual acuity of less than 0.5 logMAR (Snellen 6/18 or 20/60) but equal to or better than 1.3 logMAR (3/60 or 20/400) in the better eye. Blindness is defined as a best-corrected visual acuity of less than 1.3 logMAR or a remaining central field of 20 degrees diameter. In the United States, legal blindness is defined as a visual acuity of 1.0 logMAR (6/60 or 20/200) or less in the better eye.
Blindness is one of the most common disabilities (Congdon 2003). An estimated 40 million people were blind a decade ago, the time of the last accurate assessment. Among persons older than 40 years in 2002 in the USA, 937,000 were blind. Figures for both the developing world, where 90% of world blindness exists, and the developed world are expected to increase significantly during the next decades as the world’s population ages.
Causes of blindness in the USA depend on race and ethnicity (EDPRG 2004). Age-related macular degeneration is the most common cause in white people whereas cataract, glaucoma and diabetic retinopathy are the leading causes in Hispanic and black people. Treatable or preventable conditions are the most frequent causes of blindness in developing countries: infectious disease, nu-tritional deficiency, cataract and refractive error (Congdon 2003). One of the most significant handicaps produced by visual im-pairment is the limit it imposes on the ability to travel indepen-dently (Golledge 1991). During travel we receive the majority of the information about our environment through our visual system (Soong 2001b). Many aspects of routine life may be affected by difficulty or inability to travel, such as opportunities to participate in social activities and to find or retain employment (Long 1996). Loss of vision may, therefore, have a major effect on the individual’s overall quality of life, either directly or indirectly (Soong 2001b). The SEE Project (West 2002b) showed that disability, defined as deficit in performance relative to a population, cannot be charac-terised on the basis of a single cut-off value of visual acuity. In fact, for most daily living tasks performance gradually declines with progressive visual loss. Moreover, given tasks require specific lev-els of visual function. In the SEE Project reading and face recog-nition were very demanding in terms of visual function as they were found to be impaired in most people with even mild visual loss (0.5 or less, Snellen 6/12 or 20/40). On the other hand, the mobility tasks considered in the study were affected in almost half of people when visual acuity approached 0.1 (Snellen 6/60 or 20/ 200) (West 2002b).
Vision functions other than standard visual acuity may affect day-to-day functioning of older adults. In most eye diseases loss of contrast sensitivity and the extent of visual field damage are cor-related with mobility impairment at least as much as is visual
acu-ity (West 2002a;West 2002b). Loss of peripheral visual field is particularly prominent in people with retinitis pigmentosa, 80% of whom experienced mobility difficulty based on a questionnaire in one study (Geruschat 1998). Finally, environmental factors are critical to mobility tasks (Kuyk 1996). The ability of visually im-paired persons to avoid obstacles is significantly impeded under mesopic (reduced) illumination. Object contrast and location are also factors determining success in avoiding obstacles on the travel path (Kuyk 1996).
Description of the intervention
Travel in the environment involves skills of orientation and mo-bility (O&M). Orientation is the amo-bility to recognise and establish position in relation to environment. Mobility is the physical abil-ity to move in an orderly, efficient and safe manner through the environment (Novi 1998). To maintain travel independence it is essential for a visually impaired adult to learn new (O&M) skills to be able to compensate for reduced visual information (Jacobson 1993;Seybold 1990).
Orientation and mobility training aims to teach visually impaired people to ambulate and negotiate the environment safely and inde-pendently (Blasch 1997;Peterson 1998). Instructors must prepare clients to manage various risks associated with everyday life (Banja 1994), especially if they undertake independent travel in uncon-trolled environments (Marsh 2000). Through O&M training, vi-sually impaired individuals are taught to enhance their mobility performance by using their remaining vision and other senses, such as hearing and touch (Guth 1997;LaGrow 1994). The senses are supplemented by the use of devices such as long canes and support canes (LaGrow 1994).
The use of a cane by people with visual impairment, as a device that can help them move about independently, was reported as long ago as in the Bible and in Greek mythology (Blasch 1995). In 1872, Levy proposed a technique for moving a cane, known as ’the touch technique,’ in an article that was reprinted in 1949 (Levy 1949). In 1946, Hoover proposed a modified technique in which the cane touches the ground in front of the trailing foot rather than the forward foot (Hoover 1946). The aim is to touch where the next foot is to be placed, facilitating detection of holes, drop offs and other changes in levels of terrain. After World War II, increasing awareness of the potential of these techniques, to-gether with the need to offer rehabilitation to young blind veter-ans, prompted most agencies to establish ’travel training’ programs to incorporate this technique, even for people with usable residual vision. Optical aids including bioptic telescopes have been used in conjunction with O&M training with the aim of improving central visual function (Corn 1990;Feinbloom 1997;Korb 1970;
How the intervention might work
Enhancing the ability of low vision people to safely navigate their home and the external environment is the aim of O&M services. People are taught how to cope with vision loss to maximise the ability to live independently. Given the fact that O&M training is an established practice, the most interesting question to people with low vision and O&M therapists is which techniques are more effective.
Orientation and mobility training may be a component of mul-tidisciplinary rehabilitation delivered by some low vision services. An ongoing Cochrane review focusses on such complex interven-tions (Langelaan 2007), and therefore these interventions will not be the purpose of our review. Another Cochrane review under-way is currently investigating the effect of environmental and be-havioural interventions for reducing activity limitation and im-proving quality of life in community dwelling visually impaired older people. Our review focusses on objective performance whilst the other two Cochrane reviews adopt quality of life as the primary outcome measure.
Why it is important to do this review
The Academy for Certification of Vision Rehabilitation and Ed-ucation Professionals performed a survey among O&M training specialists in order to evaluate the knowledge, skill and ability re-quired in their profession (Wiener 2000). This survey established a ranking of importance of professional competencies according to the opinion of 200 O&M experts that responded to the question-naire. However, current assessment and rehabilitation techniques are not standardised and to date there has not been a systematic review of the evidence for the effectiveness of the various interven-tions used by O&M training specialists.
O B J E C T I V E S
The objective of this review was to assess the effects of orientation and mobility training for adults with low vision, with or without associated devices.
M E T H O D S
Criteria for considering studies for this review
Types of studies
We planned to include all relevant randomised or quasi-ran-domised trials.
Types of participants
Participants in the trials were people aged 16 or over with low vision. We excluded trials of people with multiple disabilities, such as hearing loss, neurological or musculoskeletal disorders.
Types of interventions
Interventions included in this review were any type of orientation and mobility (O&M) training compared to no training or control, including different types of O&M training.
Types of outcome measures
The following outcome measures were considered.
Primary outcomes
1. Performance in travel activities of daily life, such as ability to reach predetermined destinations walking independently through known and unknown, indoor or outdoor environments; ability to use public transportation such as buses and trains.
Secondary outcomes
1. Performance obtained in predetermined laboratory or real-world routes. This was considered as either the crude walking speed or as the percentage preferred walking speed (PPWS), defined as speed on the mobility course divided by preferred walking speed (Soong 2000;Soong 2001b).
2. Ability to use guide dogs during outdoor travel.
3. Social interaction, such as ability to meet relatives or friends at their homes or in public places; ability to live alone at home; the need for help from relatives or friends for travel-related daily tasks such as shopping.
4. Score obtained in quality of life questionnaires that measure psychological well-being and score in psychiatric questionnaires that evaluate depression.
5. Participants’ perceptions of the effect of O&M training on their lives relative to expectance, acceptance, satisfaction and impact in the short and in the long term.
Finally, O&M training is not free of risk as increased mobility causes people to be exposed to potentially serious harm (Banja 1994;Marsh 2000). We aimed to collect information on adverse effects including accidental falls, undesired contact with people and objects, or any trauma related to indoor or outdoor indepen-dent travel.
Search methods for identification of studies
We searched the Cochrane Central Register of Controlled Tri-als (CENTRAL) (which contains the Cochrane Eyes and Vi-sion Group Trials Register) (The Cochrane Library, 2010, Issue 3), MEDLINE (January 1950 to March 2010), EMBASE (Jan-uary 1980 to March 2010), Latin American and Caribbean Lit-erature on Health Sciences (LILACS) (January 1982 to March 2010), System for Information on Grey Literature in Europe (OpenSIGLE) (March 2010), themetaRegister of Controlled Tri-als (mRCT) (www.controlled-trials.com) (March 2010), Clinical-Trials.gov (http://clinicaltrials.gov)(March 2010) and ZETOC (March 2010). There were no language or date restrictions in the search for trials. The electronic databases were last searched on 31 March 2010.
See: Appendices for details of search strategies for CENTRAL (Appendix 1), MEDLINE (Appendix 2), EMBASE (Appendix 3), LILACS (Appendix 4), OpenSIGLE (Appendix 5),mRCT (Appendix 6), ClinicalTrials.gov (Appendix 7) and ZETOC (Appendix 8).
Searching other resources
We searched the references from retrieved articles. We did not manually search conference proceedings or journals specifically for this review.
Data collection and analysis
Selection of studies
Two authors assessed the titles and abstracts resulting from the electronic searches. We obtained the full copies of all relevant or potentially relevant trials and both authors assessed these accord-ing to the ’Criteria for considering studies for this review’. The authors were not masked to the names of the authors, the institu-tions, journal of publication or results when making their assess-ments. We resolved disagreements about whether a trial should be included by discussion and forming consensus. In cases where ad-ditional information was needed before we could decide whether to include a trial, we attempted to obtain this information from the study authors.
Data extraction and management
Two authors independently extracted data using a form developed by the Cochrane Eyes and Vision Group. We resolved discrepancies by discussion. We contacted trialists to obtain missing data and to verify data.
Assessment of risk of bias in included studies
Two review authors independently assessed the included trials for bias according to the methods described in Chapter 8 of the
Cochrane Handbook for Systematic Reviews of Interventions(Higgins 2009a). The following parameters were assessed: sequence gener-ation; allocation concealment; masking (blinding) of participants, personnel and outcome assessors; incomplete outcome data; selec-tive outcome reporting. These items were evaluated for each out-come measure or class of outout-come measure as specified in the latest version of the Cochrane Handbook. As reported in the Handbook, other sources of bias were: risk of bias related to the specific study design used; or trial stopped early due to some data-dependent process (including a formal-stopping rule); or an extreme baseline imbalance; or the study claimed to have been fraudulent. If the information available in the published trial reports was in-adequate to assess methodological quality, we contacted the trial authors for clarification. If they did not respond within a reason-able period of time, we assessed the trial based on the availreason-able information.
Each parameter was assessed as Yes (low risk of bias), No (high risk of bias) or Unclear.
Measures of treatment effect
We conducted data analysis according to Section 8 of theCochrane Handbook for Systematic Reviews of Interventions(Deeks 2009). The mean and standard deviations were obtained. We summarised results across studies using the difference in means (fixed-effect model).
Methods for future updates
For dichotomous data we will present the risk ratio. The risk differ-ence or the number needed to treat will also be given. If continuous data can be pooled, we will calculate the weighted mean difference or the difference between treated and control arms weighted by the inverse of the variance. If the outcome was measured using dif-ferent instruments but they are similar enough to be combined we will present the standardised mean difference. We will only analyse the means if the data are approximately normally distributed.
Unit of analysis issues
We do not expect there will be unit of analysis issues in the updates of this review since individuals, not eyes, are the unit of analysis and cluster randomised trials are unlikely to be conducted.
Dealing with missing data
In the updated version of this review, given further guidance avail-able in the Cochrane Handbook (Higgins 2009a), we considered that missing outcome data are not a problem if loss to follow-up is both balanced in the study arms and causes of loss to follow up are documented and judged to be unrelated to outcome in both study arms. When causes of missingness were not available, we planned to use Stata 10.2 software (StataCorp, College Station, Tx) user written functionmetamissto take into account missing data and
conduct sensitivity meta-analyses if sufficient studies were found. The underlying theory and a link to downloadmetamissare pro-vided inWhite 2008.
Assessment of heterogeneity
Although the same two studies were included in the current and in the previous version of this review, we decided to present re-sults in meta-analyses in this version of the review mainly with the purpose of presenting results in the Summary of Findings table. This also reflected a change in perspective on heterogeneity, since it is difficult to investigate with few studies in the meta-analy-ses (Higgins 2009b). The updated Cochrane Handbook (Deeks 2009) provides overlapping bands of I2values as categories of
het-erogeneity, which should be used considering the magnitude and direction of effects and heterogeneity Chi2P-value or I2
confi-dence intervals. However, I2confidence intervals are typically very wide in many systematic reviews that include a few trials (Ioannidis 2007), making it difficult to assess statistical heterogeneity. Thus we commented on differences between trials, also considering the P-value of the heterogeneity Chi2and the overlap of individual studies’ confidence intervals. We also present 99% confidence in-tervals as found in RevMan since their coverage approaches a con-servative Bonferroni approach that takes into account multiplicity of outcome measures in the two included studies (total score and three subscales) such as done in the previous version of this review. In fact 98.75% confidence intervals are obtained applying this method to four outcomes (P = 0.05 divided by four comparisons: P = 0.0125).
If more than three studies can be pooled in future updates of this review, we will follow the guidance given in the updated Handbook version (Deeks 2009) and also consider I295% confidence interval
calculated from the Q value given by RevMan and the appropriate degrees of freedom by means of theheterogiStata software routine.
Assessment of reporting biases
If more than 10 studies are found in future updates, we will ex-amine funnel plot asymmetry as a potential index of publication bias.
We investigated selective outcome reporting by doing an “out-come matrix” and classifying missing out“out-comes according to the following classification (adapted from a list provided by Paula Williamson at a Cochrane training workshop on selective outcome reporting bias, Edinburgh, March 2009).
A: States outcome analysed but only reported the P-value > 0.05 i.e. NS.
B: States outcome analysed but only reported that P-value < 0.05. C: Clear that outcome was analysed but insufficient data presented to be included in meta-analysis or full tabulation.
D: Clear that outcome was analysed but no results reported. E: Clear that outcome was measured (for example, includes struc-turally related outcomes) but not necessarily analysed.
F: States that outcome was not measured.
G: Not mentioned but clinical judgement says likely to have been measured.
H: Not mentioned but clinical judgement says unlikely to have been measured.
I: Other (give details).
Data synthesis
Data analysis was conducted according to Section 8 of theCochrane Handbook for Systematic Reviews of Interventions(Deeks 2009). The mean and standard deviations were obtained. Results were summarised across studies using the difference in means (fixed-effect model). We did not use the standardised mean difference (SMD) in this review because the measurement tools were similar and differences in standard deviation probably reflect true differ-ences between samples rather than between measurement tools.
Subgroup analysis and investigation of heterogeneity
We will undertake the following subgroup analyses:
1. Severity of low vision, people with no residual vision or light perception only versus people with some residual vision useful to help them orientate (at least hand-motion);
2. Level of independent mobility at baseline, which may limit the effect of the intervention if the level of independent mobility in the home is already good;
3. Type of visual field defect: central loss versus peripheral loss; 4. Use versus no use of non-optical mobility devices in conjunction with O&M training, such as long canes;
5. Use versus no use of optical devices as long-distance low vision aids (such as telescopes) to enhance central residual vision or op-tical devices useful to widen peripheral visual field (such as amor-phic lenses).
Sensitivity analysis
We will undertake the following sensitivity analyses:
1. Excluding studies of lower methodological quality (scoring No on any parameter of methodological quality);
2. Excluding unpublished studies.
R E S U L T S
Description of studies
See:Characteristics of included studies;Characteristics of excluded studies;Characteristics of ongoing studies.
Results of the search
The original search identified 200 titles and abstracts. We obtained the full text of twenty-four articles. Two of these were controlled studies. One further study in which a control group was present was identified from the references of one of the controlled studies. Because no random assignment was mentioned in the text we contacted the authors of the three controlled studies (Soong 2001;
Szlyk 1998;Szlyk 2000) to obtain more information about the assignment procedure. All trial authors confirmed that participants were matched for age and for relevant visual variables but were not randomised. InSoong 2001treated and control participants were recruited at two different clinics. The characteristics of the three controlled studies are summarised in the ’Discussion’ section.
Search updates
Updates to the searches in 2005 retrieved a further 348 titles and abstracts. Two articles were obtained as full text (Straw 1991a;
Straw 1991b). These studies used alternate allocation of partic-ipants to groups as the method of allocation and were therefore considered quasi-randomised controlled studies and were included in the review.
Searches undertaken in 2006 and in 2009 retrieved a further 225 and 156 reports of studies, respectively, but no new studies about O&M training were identified.
The most recent search in March 2010 retrieved a further 75 re-ports of studies. We identified one ongoing studyZijlstra 2009
which will be included in the review when outcome data are avail-able.
Included studies
See ’Characteristics of included studies’ table for further details. Both studies were conducted in the USA. They adopted similar inclusion and exclusion criteria, type of intervention and outcome measures sinceStraw 1991bwas developed on the basis ofStraw 1991a.
Participants
Straw 1991aincluded 48 people aged 60 or over. They were legally blind participants who still maintained some degree of indepen-dent mobility but with indoor O&M needs. Because this was a US-based study, legal blindness should have corresponded to a vi-sual acuity of 20/200 or less bilaterally. To be included the partic-ipants must have had sufficient cognitive functioning to compre-hend verbal communication. Thirteen persons were lost to follow up, mainly due to illness. There were 13 females and 22 males among the 35 people who completed the study (mean age was 76 years). Loss to follow up was balanced in the treatment and control groups since 18 versus 17 people completed the follow up respectively. Vision had been impaired for nine years on average
and was mainly due to glaucoma. Of 35 people, 37% were to-tally blind and 40% had light perception only; only nine partic-ipants had some cognitive impairment. Nineteen people did not have balance problems and did not use devices such as canes; four had some balance problems; eight used a cane and four needed a wheelchair. People mostly resided in apartments in retirement complexes, single-dwelling family or nursing homes.
Straw 1991bincluded 40 people with a minimum age of 58 years. People had to be functionally blind (not using vision for mobility), have indoor O&M needs yet have some degree of independent mobility. Eight of them could not complete the study; illness being the main reason for this. Out of 32 participants who completed the program, 20 were male and 12 were female (mean age was 77 years); 50% were totally blind and 34% had light perception only; with visual impairment lasting from 12 years on average and mainly due to glaucoma. Fourteen people had some cognitive impairment. Eleven did not have balance problems and did not use devices such as canes; eight had some balance problems (frail), eight used a cane; one a walker and four needed a wheelchair. The most common housing was in a nursing home, followed by private home.
In both studies, the Pfeiffer Short Portable Mental Status Ques-tionnaire was used to evaluate simple cognitive abilities (10 ques-tions) of the participants. There is no mention in these studies about the level of independence at baseline when moving in the home. This could influence the effect of the intervention if suffi-cient skills have been acquired by most participants.
Interventions
InStraw 1991athe intervention consisted of a series of scripted lessons administered by a volunteer. The O&M instruction pro-gramme was personalised according to the level of physical func-tioning of the participant, and specifically according to the type of device used. The volunteer received both written and oral in-structions that enabled her or him to perform simple indoor O& M techniques with the participant during one hour of orientation to the project. The volunteer-participant pairs worked on the pro-gram for 90 minutes a week for 10 to 12 weeks.
Items included in a subscale were used both as a training framework and as an assessment tool and were:
1. Orientation skills subscale: sound localisation, concepts, land-marks, turns, tactual discrimination (hands and feet), systematic search patterns and dropped objects.
2. Mobility skills, independent subscale: motor balance, seating, stairs, trailing, diagonal cane, elevator, squaring off and straight line, self-protection positions.
3. Mobility skills, sighted guide subscale: basic position, narrow spaces, changing sides, doors, stairs.
Not all participants completed all items as this depended on their own characteristics and needs. The control group received pro-grammed fitness exercises according toRoss 1984.
The intervention delivered inStraw 1991bwas an evolution of that presented inStraw 1991a, which was modified to improve the applicability to the individual circumstances. To achieve this many sections of the programs were rearranged. In particular, an item corresponding to route travel within the living environment was added.
The reliability of the assessment instrument was assessed in both studies by an independent grader on a subset of participants. Crude agreement was reported to be high.
Outcomes
Straw 1991aused an assessment instrument administered by the volunteer and consisted of an Orientation scale and a Mobility scale. The Orientation and Mobility scales provided the outcome measures, recorded as the percentage of correct behaviours per-formed out of those possible for that participant. Therefore, the score ranged between 0 and 100, the latter being the higher score or the better performance. Not all activities could be performed by all participants and some scales were not delivered as they were inappropriate for certain participants. The scores were added to obtain a total score. There were two versions of the instrument: for people using, or not using, a device such as cane, walker or wheelchair.
The assessment instrument adopted inStraw 1991bwas devel-oped on the basis of that used forStraw 1991a. The main changes were the introduction of subjective assessment of the ability to complete four routes in order to rate the visually impaired person on safe and effective travel within the living environment. Fur-thermore, assessment was performed by a trained professional to try to improve its sensitivity.
In both studies, the skills on which the total score and the subscales were calculated could be classified as corresponding to the
defini-tion of the primary outcome measure considered for this review. In fact, the assessment instrument measured skills that were related to travel activities of daily life. The three subscales that were cre-ated by the authors represent different aspects of O&M training. The Orientation scale includes skills related predominantly to the person’s understanding of the information to interpret the envi-ronment, spatial relationships, and movement. The two Mobil-ity scales depended primarily on the person’s physical movements within the indoor living environment. The Independent subscale included skills that were necessary for autonomous travel, while skills in the Sighted Guide scale referred to the interaction with a seeing guiding person during travel.
The score was expressed as the percentage of behaviours performed out of the number of behaviours appropriate for that person (Straw 1991b).
Excluded studies
Excluded studies are presented in the ’Characteristics of excluded studies’ table, along with the reason for exclusion, which was lack of use of randomisation to form treatment and control group in three studies.
When updating this review we discussed the inclusion of an ad-ditional study (Campbell 2005) which compared a home safety program to an exercise program to prevent falls and injuries. This study is already included in a Cochrane review dedicated to fall prevention in the elderly (Gillespie 2009).
Risk of bias in included studies
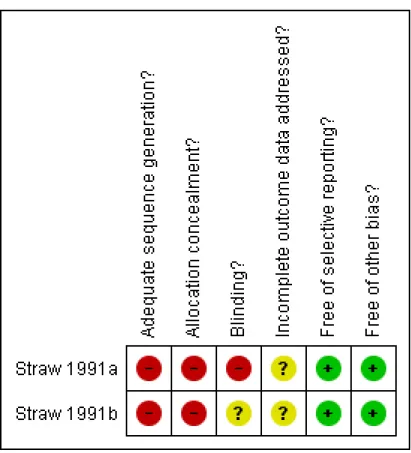
The results of the assessment of methodological quality are shown in the ’Characteristics of included studies’ table and summarised inFigure 1.
Figure 1. Methodological quality summary: review authors’ judgements about each methodological quality item for each included study.
Allocation
BothStraw 1991aandStraw 1991bused alternate allocation of participants to groups rather than randomisation and were thus considered as having inadequate quality with respect to potential selection bias.
Blinding
Straw 1991adid not mask outcome assessors. In particular, the same volunteers providing care collected the outcomes. InStraw 1991b persons assessing outcome were independent profession-als but it was unclear if masking occurred. It has to be said that masking individuals can be difficult for these types of physical interventions, and outcome assessors are also difficult to mask if they are aware of the intervention components, e.g. because the use of a cane is part of the experimental intervention, but not of the control intervention.
Incomplete outcome data
The exact number of people missing in each arm was not available in the reports. Therefore, we scored the quality of this parameter as unclear. We attempted to contact the authors to clarify unclear issues but we could not get additional data.
Selective reporting
We believe there were no selective reporting issues since one mea-surement tool was used and both total score and three subscales’ scores are reported.
Other potential sources of bias
We could not identify other sources of bias.
Effects of interventions
See:Summary of findings for the main comparisonOrientation & Mobility training compared to physical exercise for adults with low vision
The authors of the two included studies reported analyses of the total score (Analysis 1.1) as well as analyses of three subscales
(Analysis 1.2,Analysis 1.3,Analysis 1.4). Since this was a training and assessment instrument, grouping of similar skills in the sub-scales should have been pre-planned which would avoid the risk of “post hoc” analyses but as yet we have not had this confirmed by the authors. Since discussing statistical heterogeneity of two small studies is questionable, we provide a meta-analysis for descriptive purposes and discuss clinical heterogeneity issues.
An issue inStraw 1991awas the good functioning of most individ-uals, either because they already had some independent mobility in their living environments, or because of the characteristics of the measurement tool (too easy for the people included). In fact, baseline scores were in general high, from 73 up to 95 in all scales, which may have limited the ability to detect an improvement (ceil-ing effect). The score was a percentage of tasks done correctly; high scores were markedly skewed when plotted as a continuous outcome variable. Taking into account these limitations, there was no statistically significant difference between groups in any score at the final examination (Analysis 1.1;Analysis 1.2;Analysis 1.3;
Analysis 1.4).
All baseline scores were much lower inStraw 1991b(range: 47 to 70), suggestive of less O&M skills in these people who had more room for improvement. At the final assessment, all the scores in the treated group increased, but the difference between compari-son groups was close to statistical significance only for the Inde-pendent subscale (Analysis 1.4). The authors observed anecdotally that blind persons with no O&M experience benefit more, while those living in their homes for years already had skills. Participants with less severe visual impairment did not have O&M needs. Apart from the inclusion of people with more severe disability in
Straw 1991bcompared toStraw 1991a, a further difference was the use of trained professional outcome assessors in the former, which the authors believed may have improved measurement sensitivity.
D I S C U S S I O N
Summary of main results
The two small quasi-randomised controlled studies included in this review (Straw 1991a;Straw 1991b) could not find a signifi-cant difference between O&M training, delivered by a volunteer and physical exercise.Straw 1991a and Straw 1991bevaluated the effects of orientation and mobility (O&M) training in adults with low vision, comparing it to physical exercise. The studies were consecutive phases of development and implementation of the same training curriculum and assessment instrument. No dif-ference between O&M training and physical exercise was found in
Straw 1991a. InStraw 1991bO&M training tended to be better than physical exercise, but only the difference for the independent subscale of the training/ assessment instrument was close to
statis-tical significance. This scale assessed the ability to travel indoors independently.
The differences between the two studies may have been due to the improvement of the intervention and assessment instrument, which was developed to be tailored to a patient’s needs and char-acteristics in the second study. An important limitation ofStraw 1991awas the high baseline scores obtained by the participants, close to the maximum achievable with that instrument (ceiling effect). Another difference between these studies could be greater O&M abilities of participants before training. Very low vision was slightly less common among participants inStraw 1991aas compared toStraw 1991b(77% versus 84%), and the authors observed that there is little need for O&M training among those using vision for travel. Even differences among blind people may exist, since those who are very familiar with their home environ-ment already have such skills, but no details are available in the articles.
Overall completeness and applicability of evidence
Given the complexity of O&M interventions and the small size of the two studies in this review, as well as the fact that they were conducted by the same study group, we cannot assume that our findings are applicable to other settings. The precision obtained in each study is low since analysing data as standardised mean difference (i.e. the effect size) could not exclude a large effect size, i.e. approaching 1, based on 95% confidence interval limits. From the researchers’ point of view, these two studies suggest that it is possible to develop an O&M training curriculum coupled with an assessment tool that is able to capture change with time for at least some O&M skills. Nonetheless, this message can be less useful today, given the shift towards the use of quality of life questionnaires as an outcome measure and towards complex rehabilitation or support models as an intervention.
Quality of the evidence
The size of the studies (which are small) and the inadequate method of randomisation place these studies at risk of selection bias and confounding. Masking of recipients of care and care providers could not be achieved and indeed this may be difficult or impos-sible when delivering an O&M intervention. In at least one study the outcome assessors were not masked. On the other hand, the choice of outcome measures that allow masking of at least outcome assessors is important when scoring O&M performance. The shift from objective to subjective outcomes, i.e. from scoring physical performance to self-perceived performance or quality of life mea-sured with validated questionnaires, would change the perspec-tive from that of the trainer to that of the patient, thus allowing masking of both assessors and a patient-centred outcome measure.
Such a choice has been made in the ongoing studyZijlstra 2009. This study is validating a standardised O&M training model in The Netherlands while assessing its acceptability and efficacy com-pared to standard care.
Agreements and disagreements with other studies or reviews
In this update of the review we have pooled the results of the two studies for descriptive purposes. However, the limitations in the analyses remain, particularly the fact that data were markedly skewed inStraw 1991a, making the use of parametric tests im-proper. The I2value was more than 60% for two subscales, but, as
reported above, we decided not to make formal analyses of statisti-cal heterogeneity in the update of this review because it cannot be reliably calculated with few studies in the meta-analyses (Higgins 2009b;Ioannidis 2007).
Since we found little literature that met the more stringent criteria for this review, we provided a description of three non-randomised controlled studies found by the electronic searches that have evalu-ated the effects of this intervention, to delineate the most recently used investigation methods.
Szlyk 1998compared the performance of eight people who re-ceived both bioptic amorphic lenses and O&M training with that of seven people who received neither, during an observation period of three months. All participants were affected by peripheral visual field loss and the aim of the lenses was to expand their visual field. No randomisation procedure was reported but the authors state that the participants were matched as much as possible for ocular disease, level of visual impairment and age. The group that served as a control in the first three months received the same intervention during the second trimester. All participants were evaluated with clinical, psychophysical, laboratory and O&M assessment, which included driving skills, at baseline and at three and six months. A merit of this study is that the authors explored the feasibility of using a number of laboratory and real-world tests grouped in six fundamental visual skills that are relevant to O&M (recogni-tion, peripheral detec(recogni-tion, scanning, tracking, visual memory and mobility). The authors provided examples of such tasks. Exam-ples of recognition tasks were counting the number of people in a passing car; locating building addresses; reading posted prices of items within a cafeteria. As an index of mobility, participants were graded on their ability to cross intersections, walk stairs, and negotiate crowded public places. Scanning tasks included find-ing particular items on a store shelf, findfind-ing a particular entrance in the student union building, and locating the “deli station” in a cafeteria. Tracking tasks included watching moving vehicles as they pass down the street and following particular individuals in public places. The certified O&M specialist coded performance on the mobility tests using a scale from 1 (not able to perform) to 5 (no difficulty). On each task, either performance or speed or both were coded. To define a trained person as improved in a
particular task they had to obtain an increase in score of at least the average change recorded in the observation group after three months. With this definition, there was a reported 25% to al-most 50% improvement of performance, depending on the type of task, after both immediate and delayed training. The investi-gators found that the amount of improvement was larger in those with narrower visual field. Data on reliability of the measures are not provided.
Szlyk 2000used a similar battery of assessment methods and study design to evaluate the effectiveness of bioptic lenses with or with-out O&M training in people with central vision loss. Participants were assigned to receive bioptic telescopes with training (n = 9), telescopes alone (n = 8) or no intervention (n = 8). This last group was offered delayed use of lenses and training from three to six months. No method of randomisation was used but the authors state that groups were matched and statistically equivalent in age, sex, central scotoma size, visual acuity and letter contrast sensitiv-ity. As in the former study, the authors defined an improvement in a task as an increase in score by more than the average of the test-retest difference (baseline versus three months) for the untreated group. Since they found no difference between the improvement obtained with immediate versus delayed training, they combined data of those given lenses and training initially with those who received the intervention in the second trimester only; these indi-viduals had served as controls in the first trimester. They found a statistically significant effect of training plus lenses compared to lenses alone for some visual tasks, such as recognition (P = 0.05, t-test), peripheral identification (P = 0.02), scanning (P = 0.03), but not for mobility (P = 0.06), tracking (P = 0.15) or visual mem-ory (P = 0.07), although all comparisons favoured the interven-tion. When driving related tasks were evaluated separately from other O&M tasks a statistically significant effect of training was observed for this task (P = 0.02). This work shows that differences between treatment groups can be elicited based on numerous and complex psychophysical, laboratory and real-world tests but sta-tistical methods used to analyse them are not reported in detail in the paper. One statistical issue is the failure to take into account multiple testing, which increases the likelihood of finding a statis-tical significance by chance. As an example, performing 20 com-parisons adopting the conventional level of statistical significance (P=0.05), leads to a probability of (1 to 0.9520) or 64% to obtain
one or more significant findings only by chance.
Soong 2001binvestigated the effect of O&M training on mobility performance of 19 visually impaired individuals compared to 18 people who were matched as closely as possible for ocular disease, level of visual impairment and age. No randomisation procedure was adopted. All the participants were physically active and went out of their homes with or without other people. Sixteen people in the treated group were prescribed long canes or support canes or identity canes. All participants were tested at two visits four weeks apart. At each visit, the person’s mobility performance was assessed twice as walking efficiency (Percentage Preferred Walking Speed
(PPWS)) and error score on an indoor obstacle course. The error score improved at the second visit only in the treated group but not to a statistically significant extent, while PPWS improved only in the untrained group. The authors comment that the mental ef-fort spent by trained participants trying to use the new techniques may have compromised their walking efficiency. Also the design of the walking path may be critical and future studies should con-sider other outcome measures such as self reported mobility per-formance and mental effort needed.
The studies presented above as well as the literature obtained in our search point out that trials considering O&M training may use very different tests to measure participants’ performance. The ob-jective of our review was not to find and discuss all the studies that have used or evaluated O&M assessment instruments. Nonethe-less, we recognise that the discussion of this issue is critical for those who plan to conduct RCTs in this field of research. There-fore, we provide some examples that are useful for this purpose.
Soong 2001bused an indoor laboratory course with obstacles set up along the course and measured time and errors made while completing the task.Szlyk 1998used 41 indoor and outdoor tests exploring six visual skills categories (recognition, peripheral detec-tion, scanning, tracking, visual memory and mobility).Geruschat 1989used total time and mobility incidents on real-world routes.
Straw 1991a andStraw 1991bdeveloped an assessment instru-ment for assessing O&M in older visually impaired adults, which has been described above and which they claimed to have accept-able inter-observer reliability.
The complexity of an O&M intervention and its evaluation is such that assessment instruments will usually focus on several aspects of the performance rather than on a single objective measure. While objective measurements of performance have theoretically better properties, being easier to standardise, their use and interpreta-tion may not be straightforward. As an example, Soong 2001b
used PPWS and error score to evaluate mobility. They could not demonstrate a benefit from training with respect to the control group, although there was a trend in favour of treated people for the error score outcome.
The authors state that it may be necessary to assess mobility perfor-mance after a longer period, such as at three and six months after training, to allow visually impaired adults to have sufficient prac-tice in adopting new travel skills. It must also be considered that O&M instructors specifically teach clients to vary walking speed and to increase the duration of preview while walking through an unfamiliar area so that faster may not always be better for some real-world tasks. In addition, many of the participants in the train-ing group used a long cane on the post-test, but not the pre-test. This may have further slowed their progress as they would have been relatively inexperienced with the cane and would have had to use it to manoeuvre round the confined and cluttered obstacle course that was being used to assess performance. This could ex-plain the opposite direction of training effect on PPWS and error score in treated and control participants in the study bySoong
2001b. Even if such effects were demonstrated, how they relate to a person’s quality of life is not clear. Indeed, if laboratory mobility tests are used they should both be sensitive to meaningful changes in performance and correlate with real-world tasks. An advantage of using laboratory tests is that they can be described in detail, as inSoong 2001b, and possibly replicated by others. Finally, tests arranged in a laboratory may not be comparable across studies because of differences in their construction, such as number and positioning of obstacles along the path, their characteristics or po-sitioning of light and glare sources.
The training and assessment methods of the studies presented in this discussion indicate that, despite the apparent lack of standard measures of the effect of O&M training, several travel-related ac-tivities which are relevant to a person’s life should be considered as primary outcome measures and the training should also be per-sonalised according to patients’ needs and characteristics. It may also be expected that enhanced mobility will have an impact on a person’s wellbeing and self-esteem and on their relationship with other people. Results from laboratory-based mobility tests can be considered as surrogate outcome measures as they are expected to relate to performance in daily life. Specifically designed quality of life questionnaires may also be suitable to measure the effect of O&M intervention. The advantages of these tools are the ability to capture not only physical, but also mental and social dimen-sions of health using measures of both functionality and well-be-ing based on self-evaluation. One example of such instruments is the Independent Mobility Questionnaire (IMQ), developed by Turano et al. (Turano 1999) for people with retinitis pigmentosa. An overview on quality of life and other types of visual function assessment questionnaires is offered inMassof 2001.
A U T H O R S ’ C O N C L U S I O N S Implications for practice
The clinical practice of O&M instructors suggests that the need for mobility training of people with low vision is self evident. Nonetheless, the possibility of quantitative assessment of the effect of training is needed to study which techniques are more useful. Such results would help O&M instructors choose the most ap-propriate techniques, as well as guiding social health programmes in deciding to support this intervention in an era of cost-contain-ment.
Two small quasi-randomised controlled studies could not find a significant difference between O&M training, delivered by a vol-unteer, and physical exercise.
Implications for research
More research is needed on O&M training for low vision adults. The complexity and diversity of patients’ needs makes it necessary
to adapt any training curriculum to individual patients’ profiles, as pointed out by the authors of the studies retrieved in this re-view. The O&M community should develop standard, yet flexible methods to objectively test O&M performance which are valid and reliable. The complexity of the relationship between O&M training and a person’s experiences suggests that instruments that capture more fully subjective perceptions of health, such as ques-tionnaires on quality of life that are specific to these tasks, could also be useful tools for assessing the outcome of O&M training. Finally, we report here a few key questions for future O&M re-search which have been formulated in the discussion of the update of this review.
• How much instruction is required before treatment effects are seen (dosage issue)?
• How does the type and degree of vision loss affect the number of units of service that are required?
• Of the various philosophies of care, which one is most effective?
• What are the characteristics of subjects who benefit from the different philosophies of care?
• What are the measures of mobility performance that are needed to assess the diverse needs of people with low vision?
A C K N O W L E D G E M E N T S
The Cochrane Eyes and Vision Group editorial team prepared and executed the electronic searches for this review. Jennifer Evans and Anupa Shah provided editorial support during the development of the review. We are grateful to Duane Geruschat for peer review comments on both the protocol and review. We thank Roberta Scherer, Catey Bunce, Ruthy Acosta and Thomas Kuyk for their comments on the review.
R E F E R E N C E S
References to studies included in this review
Straw 1991a {published data only}
Straw LB, Harley RK, Zimmermann GJ. A program in orientation and mobility for visually impaired persons over age 60.Journal of Visual Impairment and Blindness1991;85
(3):108–13.
Straw 1991b {published data only}
Straw LB, Harley RK. Assessment and training in orientation and mobility for older persons: program developing and testing.Journal of Visual Impairment and Blindness1991;85(3):291–6.
References to studies excluded from this review
Soong 2001 {published data only}
Soong GP, Lovie-Kitchin JE, Brown B. Does mobility performance of visually impaired adults improve immediately after orientation and mobility training?.
Optometry and Vision Science2001;78(9):657–66.
Szlyk 1998 {published data only}
Szlyk JP, Seiple W, Laderman DJ, Kelsch R, Ho K, McMahon T. Use of bioptic amorphic lenses to expand the visual field in patients with peripheral loss.Optometry and Vision Science1998;75(7):518–24.
Szlyk 2000 {published data only}
Szlyk JP, Seiple W, Laderman DJ, Kelsch R, Stelmack J, McMahon T. Measuring the effectiveness of bioptic telescopes for persons with central vision loss.Journal of Rehabilitation Research and Development2000;37(1):101–8. References to ongoing studies
Zijlstra 2009 {published data only}
Zijlstra GA, van Rens GH, Scherder EJ, Brouwer DM, van derVelde J, Verstraten PF, et al.Effects and feasibility of a standardised orientation and mobility training in using an identification cane for older adults with low vision: design of a randomised controlled trial. BMC Health Services Research2009;9:153.
Additional references
Banja 1994
Banja JD. The determination of risks in orientation and mobility services: ethical and professional issues.Journal of Visual Impairment and Blindness1994;88(5):401–9.
Blasch 1995
Blasch BB, Stuckey KA. Accessibility and mobility of persons who are visually impaired: a historical analysis.
Journal of Visual Impairment and Blindness1995;89(5): 417–22.
Blasch 1997
Blasch BB, Wiener WR, Welsh RL.Foundations of Orientation and Mobility. 2nd Edition. New York: American Foundation for the Blind, 1997.
Campbell 2005
Campbell AJ, Robertson MC, La Grow SJ, Kerse NM, Sanderson GF, Jacobs RJ, et al.Randomised controlled trial of prevention of falls in people aged > or =75 with severe visual impairment: the VIP trial. BMJ2005;331(7520): 817.
Congdon 2003
Congdon NG, Friedman DS, Lietman T. Important causes of visual impairment in the world today. JAMA2003;290
(15):2057–60.
Corn 1990
Corn AL, Lippmann O, Lewis MC. Licensed drivers with bioptic spectacles: user profile and perception. Review
1990;22:221–30.
Deeks 2009
Deeks JJ, Higgins JPT, Altman DG (editors). Chapter 9: Analysing data and undertaking meta-analyses. In: Higgins JPT, Green S (editors). Cochrane Handbook for Systematic Reviews of Interventions Version 5.0.2 [updated September 2009]. The Cochrane Collaboration, 2009. Available from www.cochrane-handbook.org.
EDPRG 2004
Congdon N, O’Colmain B, Klaver CC, Klein R, Munoz B, Friedman DS, et al. The Eye Diseases Prevalence Research Group. Causes and prevalence of visual impairment among adults in the United States.Archives of Ophthalmology2004;
122(4):477–85.
Feinbloom 1997
Feinbloom W. Driving with bioptic telescopic spectacles.
American Journal of Optometry and Physiological Optics
1977;54(1):35–42.
Geruschat 1989
Geruschat DR, Del’Aune W. Reliability and validity of O and M instructor observations.Journal of Visual Impairment and Blindness1989;83(9):457–60.
Geruschat 1998
Geruschat DR, Turano KA, Stahl JW. Traditional measures of mobility performance and retinitis pigmentosa.
Optometry and Vision Science1998;75(7):525–37.
Gillespie 2009
Gillespie LD, Robertson MC, Gillespie WJ, Lamb SE, Gates S, Cumming RG, et al.Interventions for preventing falls in older people living in the community. Cochrane Database of Systematic Reviews2009, Issue 2. [Art. No.: CD007146. DOI: 10.1002/14651858.CD007146.pub2]
Glanville 2006
Glanville JM, Lefebvre C, Miles JN, Camosso-Stefinovic J. How to identify randomized controlled trials in MEDLINE: ten years on.Journal of the Medical Library Association2006;
94(2):130–6.
Golledge 1991
Golledge R. Tactual maps as navigational aids. Journal of Visual Impairment and Blindness1991;85(7):296–301.
Guth 1997
Guth DA, Reiser JJ. Perception and the control of locomotion by blind and visually impaired pedestrians. In: Blasch BB, Wiener WR, Welsh RL editor(s).Foundations of Orientation and Mobility. 2nd Edition. New York: The American Foundation for the Blind, 1997:9–38.
Higgins 2009a
Higgins JPT, Altman DG (editors). Chapter 8: Assessing risk of bias in included studies. In: Higgins JPT, Green S (editors). Cochrane Handbook for Systematic Reviews of Interventions Version 5.0.2 [updated September 2009]. The Cochrane Collaboration, 2009. Available from www.cochrane-handbook.org.
Higgins 2009b
Higgins JPT, Thompson SJ, Spiegelhalter DJ. A re-evaluation of random-effects meta-analysis. Journal of the Royal Statistical Society2009;172(1):137–59.
Hollis 1999
Hollis S, Campbell F. What is meant by intention to treat analysis? Survey of published randomised controlled trials.
BMJ1999;319(7211):670–4.
Hoover 1946
Hoover RE. Foot travel without sight. Outlook for the blind and teachers forum 1946; Vol. 40:244–51.
Ioannidis 2007
Ioannidis JP, Patsopoulos NA, Evangelou E. Uncertainty in heterogeneity estimates in meta-analyses. BMJ2007;335
(7626):914–6.
Jacobson 1993
Jacobson WH.The art and science of teaching orientation and mobility to persons with visual impairment. New York: AFB Press, 1993.
Korb 1970
Korb D. Preparing the visually handicapped person for motor vehicle operation. American Journal of Optometry and Archives of American Academy of Optometry1970;47(8): 619–28.
Kuyk 1996
Kuyk T, Elliott JL, Biehl J, Fuhr PS. Environmental variables and mobility performance in adults with low vision.Journal of the American Optometric Association1996;67(7):403–9.
LaGrow 1994
LaGrow SJ, Weessies MJ.Orientation and mobility: techniques for independence. Palmerston North, NZ: Dunmore Press, 1994.
Langelaan 2007
Langelaan M, van Nispen RMA. Multidisciplinary rehabilitation and monodisciplinary rehabilitation for visually impaired adults. Cochrane Database of Systematic Reviews2007, Issue 2. [DOI: 10.1002/ 14651858.CD006543]
Levy 1949
Levy WH. On the blind walking alone and of guides.
Outlook for the blind and teachers forum1949;43:103–10.
Long 1996
Long RG, Boyette LW, Griffin-Shirley N. Older persons and community travel: the effect of visual impairment.Journal of Visual Impairment and Blindness1996;90(4):302–13.
Marsh 2000
Marsh RA, Hartmeiser F, Griffin Shirley N. Legal issues for orientation and mobility specialists minimizing the risk of
liability. Journal of Visual Impairment and Blindness2000;
94(8):494–5.
Massof 2001
Massof RW, Rubin GS. Visual function assessment questionnaires. Survey of Ophthalmology2001;45(6): 531–48.
Novi 1998
Novi RM. Orientation and mobility for sight deficients. Proceedings: the 9th International Mobility Conference, Atlanta, Georgia. Washington, DC: Department of Veterans Affairs Rehabilitation Research & Development Center, 1998:89–91.
Peterson 1998
Peterson L, Cory D, Wiener W, Brooks A. O&M services for all individuals with functional mobility limitations. Proceedings: the 9th International Mobility Conference, Atlanta, Georgia, 1998. Washington, DC: Department of Veterans Affairs Rehabilitation Research & Development Center, 1998:366–70.
Ross 1984
Ross MA.Fitness for the aging adult with visual impairment. New York: American Foundation for the Blind, 1984.
Seybold 1990
Seybold D. Accessing the “MET”. International Conference on Low Vision, 1990: Low Vision Ahead II, Conference Proceedings. Melbourne: Association for the Blind, 1990: 282–5.
Soong 2000
Soong GP, Lovie-Kitchin JE, Woods R, Arnold N, Byrnes J, Murrish J. Preferred walking speed for assessment of mobility performance: sighted guide versus non-sighted guide techniques. Clinical and Experimental Optometry
2000;83(5):279–82.
Soong 2001b
Soong GP, Lovie-Kitchin JE, Brown B. Does mobility performance of visually impaired adults improve immediately after orientation and mobility training?.
Optometry and Vision Science2001;78(9):657–66.
Turano 1999
Turano KA, Geruschat DR, Stahl JW, Massof RW. Perceived visual ability for independent mobility in persons with retinitis pigmentosa.Investigative Ophthalmology & Visual Science1999;40(5):865–77.
West 2002a
West SK, Rubin GS, Broman AT, Munoz B, Bandeen-Roche K, Turano K. How does visual impairment affect performance on tasks of everyday life? The SEE Project. Salisbury Eye Evaluation. Archives of Ophthalmology2002;
120(6):774–80.
West 2002b
West CG, Gildengorin G, Haegerstrom-Portnoy G, Schneck ME, Lott L, Brabyn JA. Is vision function related to physical functional ability in older adults?.Journal of the American Geriatric Society2002;50(1):136–45.
White 2008
White 2008 White IR, Higgins JP, Wood AM. Allowing for uncertainty due to missing data in meta-analysis - Part 1. Two-stage methods.Statistics in Medicine2008;27(5): 711–27.
WHO 1992
World Health Organization.Related Health Problems, Tenth Revision. Vol. 1, Geneva, Switzerland: World Health Organization, 1992.
Wiener 2000
Wiener WR, Siffermann E. Development of orientation and mobility certification examination. Journal of Visual Impairment and Blindness2000;94(8):485–94.