Center for Social & Economic Research
FOREIGN
PRIVATIZATION
IN POLAND
Carl J. Bellas, Susquehanna University
Zbigniew Bochniarz, University of Minnesota
Władysław W. Jermakowicz, University of Southern Indiana
Michał Meller, University of Minnesota
David Toft, University of Minnesota
Project leader: Władysław W. Jermakowicz
Materials published in this series have a character of working papers
which can be a subject of further publications in the future. The views
and opinions expressed here reflect Authors' point of view and not
necessary those of CASE .
Paper is edited under the Project of
Data Base about the Processes of
Privatization in East-European Countries
, carried out by CASE -
Center for Social and Economic Research and financed by the
Committee of Scientific Research
(
Komitet Bada
ń
Naukowych)
.
CASE
Research Foundation, Warsaw 1994
ISBN - 83-86296-21-6
Editor:
CASE
- Center for Social & Economic Research 00-585 Warszawa, Bagatela 14ACKNOWLEDGMENTS
This project has been underwritten by the Centre for International Cooperation and Development, Ljubljana/Slovenia in the framework of the ACE Project on "Foreign Direct Investment and Privatization in Central and Eastern Europe" whose support is gratefully acknowledged. The authors want to express gratitude to Dr. Matija Rojec for his leadership role and support by the projects execution.
Special thanks go to Dr. Leszek Balcerowicz, Chairman of the Board, and Dr. Marek Dąbrowski, Deputy Chairman of the Center for Economic and Social Studies "CASE Foundation" for their encouragement and friendly support in preparing and carrying out of the survey on foreign acquisition strategies in Poland.
The authors wish to express their gratitude to Mr. Stefan Rogulski, Department's Director and Mr. Jerzy Olszewski from the Ministry of Privatization for their help in data assessment. Special thanks should be given to Mr. Marek Górski, the President of the State Foreign Investment Agency for the time he spent in answering questions on the policy issues.
Special thanks also go to Dr. Jane Thompson Follis, University of Southern Indiana, to staff members of the Center for Nations in Transition at the Humphrey Institute, University of Minnesota: Jane E. Burss, Christopher J. Miller and Maureen (Mo) Reilly for help in preparing this report, and Ms. Maria Lenard from Pomorski Bank Kredytowy S.A., Warsaw and also Mrs. Anna Maciążek from CASE Foundation, for logistic help in preparation of the survey.
We also own our appreciations to the international students team feeding the FDI data to PC for processing: Agnieszka Bajur, Simona Adelina Hentia, Daniel Jasiński, Cherie Jones, Roma Toft, and David Toft, who also contributed to chapter 3 of this report as a co-author.
FOREIGN DIRECT INVESTMENT AND
PRIVATIZATION IN CENTRAL AND EASTERN
EUROPE: Facts and Issues
Władysław W. Jermakowicz, Carl J. BellasINTRODUCTION
The long-term development of the former socialist countries of Central and Eastern Europe (CEE)1 largely depends on their success in attracting foreign direct investment (FDI) to revive
their economies2. FDI is the most common vehicle used by foreign investors when entering new
markets with their own products and technologies.
The perception of the FDI phenomenon in CEE countries is frequently based on emotional prejudices and short run political considerations, not rational economic considerations. Two divergent perceptions of the FDI phenomenon exist: at one extreme is the illusion that FDI can solve a country's major economic problems; at the other, the fear that the country will be "sold out". Neither of these two perceptions is realistic, and each is detrimental to both the host countries and foreign investors.
It is true that CEE countries have a large potential need for FDI. Foreign investments can be the driving forces toward achieving the four following goals:
* to combat the lack of foreign capital: At the macroeconomic level FDI inflows can provide a source of savings with which to finance the major investment requirements of CEE economies, and FDI inflows can provide a source of convertible foreign exchange over and above export earnings, thereby releasing funds for debt repayment and permitting a higher level of imports.
* to accelerate the privatization process of CEE economies: FDI inflows can bring in CEE countries the opportunity to link up with Western companies of much greater financial strength, which increases their credit stature with potential lenders.
* to introduce modern technology and management techniques: At the microeconomic level, FDI can be a source of new technology, introduce superior management and marketing techniques, provide management and employee training to meet western
* to supply the local markets with quality products, as well as provide direct quality and design expertise to meet the requirements of Western markets.
Early optimism about CEE economic reforms and resulting large FDI inflows was based on the expected opening up of new markets with good growth prospects, the existence of a skilled labor force and low labor costs, and relatively low cultural barriers, particularly for West European companies investing in Central Europe. The emergence of a large number of potentially
1 In this paper, the Central and East European countries are: Albania, Belarus, Bulgaria, Croatia, Czech Republic, Estonia, Hungary, Latvia, Lithuania, Poland, Romania, Russia, Slovakia, Slovenia, and Ukraine. 2 Foreign direct investment (FDI) occur when a firm invests directly in new facilities to produce a product in a
foreign country and when a firm establishes an interest in a business entity based in another country by acquiring more than 10 percent of the entity's ownership. Less than 10 percent of the ownership in a foreign business is foreign portfolio investment (FPI).
highly profitable new investment opportunities was expected to generate a flow of FDI as well as internal funds to finance new investment.
Since then, both sides have reassessed the potential costs and benefits. To date, the volume of FDI into CEE countries has been very small, the technology is in most cases outdated, and the management skills of Western investors are disappointing. From the other side, the costs of doing business for Western companies in the CEE are much higher than they expected and the anticipated benefits have been lower, at least in the short to medium term.
Is there a more accurate assessment of the current situation? In this paper, the authors attempt to: present the real growth in FDI from a global perspective; examine the structure of the CEE investment; put forth some basic political recommendations to promote an active strategy and policy towards FDI which the CEE countries can incorporate into the enhancement of their indigenous competitive advantage and capabilities.
FOREIGN DIRECT INVESTMENT IN CEE: A GLOBAL
PERSPECTIVE
By 1988 most Socialist countries, with the exception of Albania and East Germany, allowed joint venture partnerships with Western capital (Dunning (1993)). For the entire Communist Block countries, 378 firms had foreign partnerships (an 570% increase over 1985) with a total FDI of $808 million. In 1993 the number of firms with foreign participation increased to 99.5 thousand (263 times over 1988) and the capital invested to $19.5 billion (24 times over 1988). (See Table 1.)3
In spite of the tremendous rate of growth, these investments have not met the expectations of the host CEE governments, causing serious disappointment. FDI in CEE countries is still in its infancy and represents only a small share of worldwide FDI. During 1985-1993, total world FDI in the world economy amounted to $1,350 billion, and accumulated FDI in less developed countries (LDCs) in 1993 amounted to $203.2 billion (World 1994). Therefore, over a comparable time the CEE countries attracted approximately 1.5 percent of the world FDI inflows, and less than 10 percent of the capital inflows of less developed countries. In 1993 the inflows of FDI to CEE amounted 3 percent of the world inflows and 6.2 percent of developing countries inflows. In 1993 total FDI inflows amounted an estimated $5 billion in comparison with $5 billion inflows to Mexico alone in the same year (World 1994).
Even if the FDI flow into CEE continues to increase at the current rate, it seems unlikely that this will divert any appreciable FDI from other regions of the world. In the year 2000 projected FDI inflow to CEE would still account for only about 10 percent of all worldwide FDI.
The decreasing size of FDI per firm seems to indicate that more new firms can be established without central consent, encouraging more small foreign firms to enter the CEE market.
3 The compilation of data on FDI differs from country to country and sometimes even within countries, where
they are compiled by several government agencies (Statistical Offices, Foreign Investment Agencies and National Banks). The differences in criteria used may result in considerable divergence in aggregated FDI statistics. As a result, the data are often not comparable and should be used with caution (See: ECE 1994). Nevertheless, the general trends are informative and indisputable.
TABLE 1. FOREIGN DIRECT INVESTMENTS (FDIs) IN CENTRAL AND EASTERN EUROPE IN COMPARISON TO THE LESS DEVELOPED COUNTRIES (LDCs) (Cumulative data) Year Number of FDIs in CEE FDI in CEE ($Million) FDI in LDCs ($Million) CEE as % of LDC 1985 1988 1989 1990 1991 1992 19934 6 378 2,413 9,121 32,828 71,170 99,533 250 808 2,507 5,150 10,203 14,690 19,493 - 19,752 43,059 67,067 100,984 139,246 203,246 - 4.1 5.8 7.7 10.1 10.5 9.6 Calculations based on Sader (1993), East-West (1991-1993), Gutman (1993), World (1994).
THE PATTERNS OF FOREIGN DIRECT INVESTMENT IN
CEE COUNTRIES
The CEE countries are at different stages in their development. FDI is rather heavily concentrated in Hungary, Russia, Poland, and Czech Republic, which together had 41.4 percent of all CEE investment occurrences and accounted for 68.3 percent of total FDI. Romania ranks high in the number of investments (29.3%), but low in the amount of invested capital (3.9%). Conversely, Slovenia has 6.2 percent of the FDI but only 3.3 percent of the number of investments (See Tables 2 and 3.)
In 1993, Czech Republic had the highest FDI per firm, followed by Russia and Slovenia. Romanian and Lithuanian firms had the lowest, with average FDI investment below $50 thousand per enterprise. (See Table 4.) These differences indirectly reflect the degree of centralization in decision-making by governments. Central authority is usually required to establish large firms; therefore the more centralized the decision process, the larger the average investment.
FDI projects have tended to decrease in size over these five years. In 1988, the average FDI per firm was $1.68 million; in 1993 this average decreased to $196 thousand. Apparently liberalization of foreign investment has increased the number of small private firms with foreign participation5.
This principle seems to be confirmed by the analysis of the trends over the last five years. In 1988 only large FDI firms were operating, and their establishment was the result of their willingness to persevere through lengthy bureaucratic procedures. For example, Suzuki needed seven years to complete its agreement with the Hungarian Foreign Investment Agency in 1991. In subsequent years,
The country comparison seems to indicate that the size of the country is also an important factor in average FDI per enterprise. The smaller the country, the more centralized its decision making and the more control the central body exercises over new investment. In Slovenia, it is
4 Based on committed (but not actually implemented) FDI projects. As of December 31, 1993 cumulated FDI
stock in CEE amounted to an estimated $13 billion (World 1944:98).
5 Undoubtedly, the average size of foreign affiliates in the region is small. For comparison, affiliates in
developed countries average $18 million in invested foreign equity capital and LDC affiliates average $4 million (World 1994). In Hungary only 4 percent and in Poland 1.4 percent of the projects involving foreign investors had investment exceeding $1 million (See Chapter 2).
the Agency for Privatization and in Czech Republic, the Ministry of Privatization. These bodies make all of the case-by-case decisions concerning foreign investment. The reverse is true in "anarchistic" Poland and Romania where firms with foreign participation can start their activity without governmental consent. The relatively high FDI per firm in Russia seems to reflect continued centralized decision making, the result of the traditions prevailing in this country.
TABLE 2. NUMBER OF FOREIGN DIRECT INVESTMENTS IN CENTRAL AND EASTERN EUROPEAN COUNTRIES 1988 1989 1990 1991 1992 1993 % of total for 1993 Albania Belarus Bulgaria Czech Rep. Estonia Hungary Latvia Lithuania Poland Romania Russia Slovakia Slovenia Ukraine USSR Others6 - - 20 11 - 149 - - 33 5 - - 44 - 141 - - - 25 50 - 1,201 - - 551 5 - - 182 - 1,000 - - - 70 500 - 5,693 - - 2,044 4,421 - - 680 - 2,051 - - 283 900 3,066 1,100 9,117 295 220 5,583 8,022 2,022 934 1,000 400 - - 70 714 1,200 3,120 2,662 17,182 2,621 2,000 5,740 20,684 3,252 2,875 2,815 2,000 - 4,235 - 1,250 2,300 5,000 4,150 21,468 2,850 3,000 6,800 29,115 7,989 4,350 3,300 2,800 - 5,161 0.0 1.3 2.3 5.0 4.2 21.6 2.9 3.0 6.8 29.3 8.0 4.4 3.3 2.8 - 5.2 TOTAL 403 3,014 15,459 32,828 71,170 99,533 100.0 Calculations based on East-West (1991-1993), Gutman (1993), Rojec (1993), World (1994).
TABLE 3: TOTAL FOREIGN DIRECT INVESTMENT IN CENTRAL AND EASTERN EUROPEAN COUNTRIES ($Million), 1988-1993
COUNTRY 1988 1989 1990 1991 1992 1993 % of total for 1993 Albania Belarus Bulgaria Czech Rep. Estonia Hungary Latvia Lithuania Poland Romania Russia Slovakia Slovenia Ukraine USSR Others - - - 38 - 48 - - 7.6 - - - - - 583 - - - - 85 - 326 - - 104 - - - 136 - 1,846 - - - - 180 - 1,017 - - 308 60 - - 386 - 3,208 - - - 130 952 84 3,137 45 33 479 269 2,827 124 650 440 - ? 37 265 170 1,573 142 3,680 84 90 1,545 540 2,850 231 962 480 - ? - 340.0 200,0 2,053.0 220.0 6,005.7 150.0 140.0 2,100.0 755.0 3,153.2 380.0 1,200.0 600.0 - ? 0.0 1.7 1.0 10.5 1.1 30.8 0.8 0.7 10.8 3.9 16.2 1.9 6.2 3.1 - TOTAL 676.6 2,497 5,159 10,203 14,690 19,493.7 100.0 Calculations based on East-West (1991-1993), Gutman (1993), World (1994).
6 Others also include the Republics that comprised the former Soviet Union and Yugoslavia (with exception
TABLE 4: AVERAGE FOREIGN DIRECT INVESTMENT PER ENTERPRISE ($Thousand), 1988-1993 COUNTRY 1988 1989 1990 1991 1992 1993 Albania Belarus Bulgaria Czech Rep. Estonia Hungary Latvia Lithuania Poland Romania Russia Slovakia Slovenia Ukraine USSR Others - - - 3,454.5 - 322.1 - - 230.3 - - - - - 4,134.8 - - - - 1,700.0 - 271.4 - - 188.7 - - - 747.3 - 1,846.0 - - - - 360.0 - 178.6 - - 150.7 13.6 - - 567.6 - 1,564.1 - - - 144.4 300.7 76.4 344.1 152.5 150.0 85.8 33.5 1,398.1 148.7 650.0 1,100.0 - - 528.6 371.1 141.7 504.2 53.3 214.2 32.0 45.0 269.2 26.1 876.4 80.3 341.7 240.0 - - - 272.0 87.0 410.6 53.0 279.8 52.6 46.7 308.8 25.9 394.7 87.4 363.6 214.3 - - TOTAL 1,678.9 828.5 333.7 310.8 206.4 195.9 Calculations based on East-West (1991-1993), Gutman (1993), World (1994).
The average size of the firms also depends on the type of foreign investor. In Poland, Slovakia, and Romania, foreign investors are predominantly natural persons and small firms who invest small amounts of capital. The large multinational enterprises (MNEs) avoid these countries. Generally, more than half of the foreign investors in CEE are individuals (natural persons), usually nationals living abroad and using their own connections in the CEE country. This is typical for all of the countries where emigration in the last ten years has been especially large, e.g., Poland, Romania, and Slovakia.
The analysis of average amounts invested by foreign investors in different countries shows that two stages in FDI development are clearly visible. First stage occurs when liberalization of investment conditions is taking place. In this stage over years the average FDI size is declining. The second stage appears when the investment conditions are already stabilized, and the average FDI increases as a result of larger investors' interest to enter the country.
From all analyzed the countries, only Hungary, Poland, Slovenia, Slovakia and the Czech Republic (mixed results) are in the second, more advanced stage. The remaining countries are apparently still in the first stage. This measure can indirectly indicate the country's relative maturity in dealing with foreign investors.
The distinction in the first and second stage countries is closely related to the type of commercial legislation prevailing in the country. In the first stage countries, the enclave law model7 still prevails which gives preferred conditions in taxation, profit repatriation, or firm registration to foreign firms. FDI laws in this model often constitute the first step in a series of market-oriented legislation and can be the core of that legislation around which other basic laws evolve. In the second stage the national treatment law model prevail, where commercial legislation dealing with securities, stock exchanges, and bankruptcies is the same for both domestic and foreign investors. The enclave model still prevails in Albania, Belarus, and the Ukraine, where FDI legislation still provides the legal base for business and investment (Foreign 1992). By contrast, Hungary, Poland, Slovenia, Slovakia and the Czech republic adopted separate
7 The names for enclave model and national treatment model the authors have borrowed from Kubielas
commercial legislation which forms the legislative base not only for domestic but also for foreign firms. The remaining countries are in the transitional stage.
The research conducted in Poland also shows that a negative correlation exists between the proximity of the country to the investor's home country and the amount of capital invested by the investor. The closer the countries, the smaller the average investment. The smallest firms were those established by German investors, and the largest were those established by Americans and Canadians (Jermakowicz, Bochniarz 1991).
As a final observation, it seems that resource-rich countries (e.g. Russia) have tended to attract larger investments.
THE IMPACT OF FOREIGN DIRECT INVESTMENT IN CEE
COUNTRIES
As one would expect, FDI have had a different impact in different CEE countries. FDI per capita is highest in Slovenia ($600), followed by Hungary ($580), Czech Republic ($199) and Estonia ($137.5). FDI is the lowest in Albania ($11), Ukraine ($11.5), Russia ($21) and Bulgaria ($22). (See Table 5.)
TABLE 5: FOREIGN DIRECT INVESTMENTS AS GDP SHARE AND PER CAPITA (in Millions US$) (December 31, 1993)
Number of Firms Invest-ment ($) Popula- tion (Million) GNP ($Bil.) Popula-tion per firms FDI as % of GDP FDI per Capita Albania Belarus Bulgaria Czech Rep. Estonia Hungary Latvia Lithuania Poland Romania Russia Slovakia Slovenia Ukraine 70 1,250 2,300 5,000 4,150 21,468 2,850 3,000 6,800 29,115 7,989 4,350 3,300 2,800 37 340 200 2,053 220 6,005 150 140 2,100 755 3,153 380 1,200 600 3.4 10.3 9.0 10.3 1.6 10.3 2.6 3.8 38.5 23.2 148.7 5.3 2.0 52.1 2.7 30.1 36.4 69.0 6.1 60.1 8.9 10.3 162.7 71.9 478.8 40.8 21.4 121.7 48.00 8.24 3.91 2.06 .38 .48 .91 1.27 5.66 .79 18.61 1.22 .60 18.60 1.37% 1.13% .55% 2.98% 3.61% 9.99% 1.69% 1.36% 1.29% 1.05% .66% .93% 5.61% .49% $ 11.0 $ 33.0 $ 22.2 $199.3 $137.5 $580.8 $ 57.7 $ 36.8 $ 54.5 $ 32.5 $ 21.2 $ 71.7 $600.0 $11.5 Average 6,746 1,238 22.9 80.1 7.91 2.34% $133.6 Calculations based on Gutman (1993), The 1994 Information (1994), World (1994).
The average contribution of foreign affiliates to the gross national product in CEE is 2.34% in 1993. FDI as a percentage of GDP is highest in Hungary (10%), Slovenia (6.61%), Estonia (3.61%) and Czech Republic (2.98%); lowest in Ukraine (.49%), Bulgaria (.55%) and Russia (.66%). For comparison, in Western economies, FDI as a percentage of GDP varies from 22% in Portugal to 40% in Austria. Generally speaking, the smaller the country by population, the higher the ratio of FDI to GDP and the higher the amount of FDI per capita.
Comparing the population of a country to the number of firms with foreign investment in that country is one indicator of investment density. Countries with high investment density are Estonia (360 persons per firm), Hungary (480), Slovenia (600) and Romania (790). Albania, Russia, and Ukraine are at the low end of this scale.
Considering all three indicators, i.e. FDI per capita, FDI/GDP, and population per firm-investments, one can conclude that FDI has been important in Hungary, Czech Republic, Slovenia and Estonia; of some importance in Poland, Slovakia and Romania; and has had only minimal impact in Albania, Bulgaria, Latvia, Lithuania, and the CIS countries. The importance of FDI is positively correlated with the size of GNP per capita. The GNP per capita is the highest in Slovenia ($10.7 thousand), followed by the Czech Republic ($6.thousand) and Hungary ($5.8 thousand). The lowest GNP appears in Albania ($803), the Ukraine ($2.3 thousand), and Belarus ($2.9 thousand).
In spite of the relatively low role of FDI in CEE, the impact of FDI on the economic transition may have been larger than the actual size and relative importance of these investments suggest. In the Czech Republic and in Poland, economic recovery is fostered by the increase in domestic automobile production fuelled by FDI in the automobile industry (Volkswagen, Fiat and GMC). Likewise, in brewing, the best performing sectors of the Hungarian and Polish economy, the largest part of the breweries are owned by foreign companies.
SOURCES OF FDI INFLOWS TO CENTRAL AND EASTERN
EUROPE
Table 6 lists the amounts of investment from eight investor nations into eight CEE countries. Four countries, Germany, Austria, Italy and the United States, account for 75 percent of the total investment from 1989 through June 1993.
The variability of a source country's investment (standard deviation divided by the mean) is a measure of the dispersion of investments among the eight host countries. Germany has been the largest investor nation but also has distributed its investments across the CEE countries. Italy has placed more than half of its CEE investment in Poland and mainly in two large projects (Fiat-FSM and Lucchini-Huta Warszawa).
The entries in Table 7 are the rank of a country's investments in relation to all other investors in the host country. For example, German-based investments of $218 million in Slovenia make it the largest investor there, while its $215 million of investments in Poland make it the third largest investor in that country.
Medians of the rankings provide a measure of the relative importance an individual country's investors play across the CEE countries listed. Germany is clearly the leader. Despite its relatively low total dollar investment, France's investments in smaller countries have resulted in the second highest median ranking. The EC and EFTA countries have been the dominant investors8. The United Kingdom has not been a major source of investment for Central and
Eastern Europe.
Three factors help explain the patterns evident in the two tables:
. Strong economic ties made it easier for already familiar trading partners from the other European countries to upgrade their cooperation to direct investment.
. The nationals from CEE countries residing in Western Europe are formally registered as foreign investors from their countries of residence.
. The political crises in CEE at the end of 1989 and the early 1990s were a lesser investment impediment to investors from neighboring countries which were more familiar with developments in the CEE because of traditional trading links.
TABLE 6: COUNTRY SOURCES OF FDI FOR SELECTED CENTRAL AND EASTERN EUROPEAN COUNTRIES 1989 - JUNE 1993 ($Million)
COUNTRY G USA I A F NL S UK Host Total Albania Bulgaria Czech Rep. Hungary Poland Romania Slovakia Slovenia 6 4 657 421 215 108 57 218 0.7 1 609 117 347 88 44 7 10 0.2 117 88 546 38 12 95 4 0.8 138 410 65 17 63 150 6 9 275 135 84 109 1 35 2 0.3 78 130 143 23 13 1 0.9 0.1 149 115 40 10 2 5 0 0.1 47 72 60 29 0.5 1 29.6 51.5 2,070 1,488 1,500 422 192.5 512 TOTAL 1722 1213.7 906.2 847.8 654 390.3 322 209.6 6,267 Variability .97 1.34 1.41 1.19 1.07 1.15 1.37 1.07
TABLE 7: RANKING OF SOURCE COUNTRIES' INVESTMENTS IN CEE COUNTRIES 1989 - JUNE 1993
COUNTRY G F A USA I NL S UK Albania Bulgaria Czech Rep. Hungary Poland Romania Slovakia Slovenia 3 2 1 1 3 2 2 1 2 3 2 4 5 1 11 4 3 5 6 2 7 11 1 2 6 4 1 6 2 4 3 6 1 6 5 8 1 5 5 7 5 8 13 5 4 6 4 9 6 10 5 7 10 14 9 7 0 13 17 9 8 3 23 12 Median Rank 2 3.5 4 4 5 5.5 8 12.5
There are instances where United State's firms have made investments in CEE countries through their Western European subsidiaries9. These investments would be included with the
numbers from the Western European country. As noted in the introduction, the pacific Rim countries, including Japan, have been relatively minor investors in CEE.
Cultural background appears to be very important. The traditionally close relationships between countries constituting the Austro-Hungarian Empire affect the German and Austrian investment in Hungary, Slovenia, Slovakia and Czech Republic. In Poland, the traditionally close relationships with the United States and Italy help explain the investment levels.
As noted earlier, Germany is investing throughout East Europe because of its traditional interest in this region, while American capital has tended to flow into big markets. This is indicated by the dominating position of American capital in Russia (not shown in the tables) and Poland rather than Hungary, Slovenia, Bulgaria and Albania. Also, from a geographical point of view, as noted by Jermakowicz and Bochniarz (1991), German investment is usually located in the western parts of the country, and American investors locate themselves in
9 The best example is GMC's investment in Poland, which is made through OPEL, its German based
eastern parts of Poland, Slovakia or Hungary in the hope that this will be a future springboard to the large emerging markets of Ukraine and Russia.
STRATEGIES OF WESTERN INVESTORS
Generally speaking, foreign investors are following two different generic investment strategies in entering the CEE markets. We designate them Type I and Type II.
Type I investments are focused on local markets and can be called import-substitution FDI. These investments are made to begin production for local markets of simple products and commodities with uncomplicated technology, or the assembly of more technologically advanced products, generally to avoid import barriers. The examples of such investment are new establishments of foreign automobile operations in the Polish market (Peugeot, Volkswagen, Opel and Volvo). The investments are made to gain access to the local market.
Type II investments are export-oriented FDI, which are made to develop firms specializing in the production of products for the world market on an integrated basis. For example, Skoda, Volkswagen's affiliate in the Czech Republic; ABB's affiliates in Poland, or Japan's Daikon affiliate in Hungary provide components to their parent companies on a globally integrated basis. These types of investment are made to achieve a competitive advantage through low taxes, a favorable geographical location, access to resources, and low labor costs.
Type I investments are typically smaller because they involve simple processes or the final, assembly phase of a process. It is possible that a successful Type I investment will lead to expansion into Type II investment. Nevertheless, first intentions determine the investment classification.
Type II investments are usually larger and involve larger capital inflows (more than $100 million). They include all stages of the production process and result in greater autonomy for the CEE enterprise.
Currently, import substitution strategies dominate, while export-oriented investments are still modest. However, the differences among CEE countries permit classification into three groups. The Type I investment group, comprises Albania, Bulgaria, Romania, Russia, and Ukraine. These countries succeed in bringing almost exclusively Type I investments. This type of FDI includes: enterprises in mineral resource development (Conoco, Deminex, Elf in Russia), in tobacco products (RJ Reynolds in Ukraine, RJR Nabisco in Russia), in automobiles (Balcanscar in Bulgaria), and breweries and food processing (Unilever in Bulgaria, Romania and Estonia).
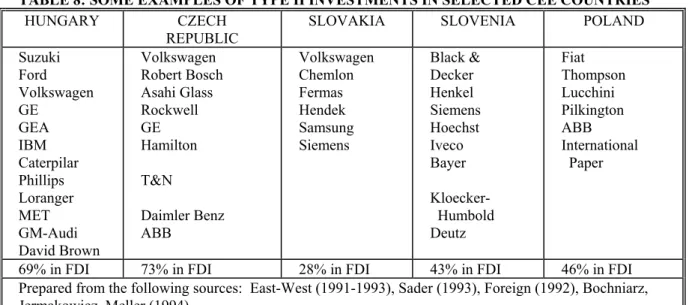
Type II investment countries (Table 8) include Hungary and Czech Republic where this type of investment comprises more than 50 percent of all investments (percentages at the bottom of the table display the share of the type II investments in all investments in the country)10.
Poland, Slovenia, and Slovakia form a group of countries with an even mix of Type I and Type II investments. These countries have successfully attracted some large investments such as Fiat, Thompson, International Paper, ABB, Black and Decker, and Volkswagen. Still, the majority of firms create Type I investments with production or service for the local
markets. For example the largest foreign investment in Slovakia is K-MART, the U.S.-based retailer, focusing on serving local markets.
The volume of the Type I investment appears to be positively correlated with the country's import barriers, the population of the local market, and their purchasing power, i.e., the larger the population and the higher the barriers, the higher the likelihood that investment will concentrate on the local market. In this respect, the CIS and Polish markets seem to be the most attractive for Type I investors. The volume of Type II investment, in turn, depends on the benefits which a country offers foreign investors, as well as the country's political stability. The benefits can be either institutional (e.g. long tax holidays, reduced taxes, investment in the infrastructure, subsidies, free land) or arise from lower wages, or better access to resources.
The predominant share of Type II investment in Hungary and in the Czech Republic is the result of strong government interventionist policies, relatively inexpensive labor and the perception of their political stability.
TABLE 8: SOME EXAMPLES OF TYPE II INVESTMENTS IN SELECTED CEE COUNTRIES
HUNGARY CZECH
REPUBLIC SLOVAKIA SLOVENIA POLAND Suzuki Ford Volkswagen GE GEA IBM Caterpilar Phillips Loranger MET GM-Audi David Brown Volkswagen Robert Bosch Asahi Glass Rockwell GE Hamilton T&N Daimler Benz ABB Volkswagen Chemlon Fermas Hendek Samsung Siemens Black & Decker Henkel Siemens Hoechst Iveco Bayer Kloecker- Humbold Deutz Fiat Thompson Lucchini Pilkington ABB International Paper
69% in FDI 73% in FDI 28% in FDI 43% in FDI 46% in FDI Prepared from the following sources: East-West (1991-1993), Sader (1993), Foreign (1992), Bochniarz, Jermakowicz, Meller (1994).
Given the above, the CEE governments are facing a dilemma: should they pursue liberal policies that are not attractive to foreign investors or should they pursue active, interventionist investment policies that provide investment incentives?
In contrast to Poland's liberal policy, the Hungarian and Czech governments offer long tax holidays and reduced taxes, free land, and government investment in infrastructure, worker training and enterprise subsidies. For example, in Hungary Audi has received a five-year tax holiday and a 60% tax reduction for the following five five-years. Also, Suzuki, Japan's investment in the Hungarian automobile industry was conditioned on high tariff protection of domestic automobile production. Similarly, in Czech Republic, Volkswagen's engagement in Skoda (originally at $5.3 billion) was linked to protective tariff measures on imports and tax reductions for 10 years. Also, Philip Morris was aided by increased import tariffs for cigarettes produced abroad. These efforts bring rapid results. The relative unattractiveness of Poland, Slovenia, the Baltic States, and Russia for Type II investors is the result of a lack of clear investment policies in these countries. They are prisoners of their own liberal approach to economic doctrine and practice.
MODES OF FDI
A part of a foreign company's decision to invest in a particular country is the selection of the most appropriate investment mode. This depends to a large degree on the investor's motives and the industry. No one mode is better or worse than another; all depend on individual intentions and circumstances.
There are three basic modes: greenfield (new) investment; indirect acquisition through establishment of a joint venture; and direct acquisition, through which a foreign investor buys a share (partially or entirely) in a local company.
The greenfield mode is selected if the production process is labor intensive. High labor intensity lowers the relative cost of a greenfield venture. Furthermore, greenfield mode is chosen when the investor's name and products are already widely known in the local markets; when the costs of restructuring an acquired local company could prove to be higher than the establishment of a new operation, and when an unresolved ownership status due to the restitution process could be a serious impediment to privatization.
Indirect acquisition (Joint-ventures) is an appropriate way to gain access to a new business if it is uneconomical or risky for a foreign investor to make a greenfield investment. This type of acquisition works best when pooling resources and competencies produces a competitive advantage. The foreign investor brings technology and know-how; the local partner contributes a plant site, qualified labor, and knowledge of the local laws and government operation.
Direct acquisition (privatization) is likely to be successful if the acquired enterprise is in a capital intensive industry, making a greenfield investment very costly. Furthermore, direct acquisition is appropriate if the local producer has a strong market share and local brand recognition as well as a well developed local supply and distribution network (Dunning, Rojec 1993).
Table 9 illustrates the dramatic change in CEE foreign direct investment modes between 1988 and 1993. Although the value of all modes of investment have increased, the proportions of greenfield and privatization have increased while that of joint ventures has significantly decreased.
TABLE 9: MODES OF FOREIGN DIRECT INVESTMENT IN CEE ($Million)
Year Greenfield Indirect
Acquisition Direct Acquisition Total
$ % $ % $ % $ % 1988 1989 1990 1991 1992 1993 17 266 1,139 2,266 4,618 7,038 2.6 9.6 22.2 22.2 31.3 36.1 632 1,594 2,775 4,744 4,407 5,458 93.3 64.6 53.8 46.5 30.0 28.0 28 644 1,236 3,193 5,665 6,998 4.1 25.8 24.0 31.3 38.7 35.9 677 2,497 5,159 10,203 14,690 19,494 100.0 100.0 100.0 100.0 100.0 100.0 Calculations based on Bellas, Bochniarz, Jermakowicz, Meller (1994), Sader (1993), East-West (1990-1993), Robinson (1993).
Up until 1989 a joint venture was the only attractive and available way to bring foreign investment into a state-owned enterprises. By 1993 a wider range of investment options, including privatization and greenfield opportunities, were available. As privatization progresses the most attractive enterprises will have found foreign investors or due to resistance within a country, may not be available to outside investment. Greenfield
investments are likely to become increasingly attractive options, however some countries, notably the Czech Republic have not instituted land ownership reforms that are necessary for greenfield investment.
MODELS OF FDI DEVELOPMENT
John Dunning (1993) has suggested three models of FDI development in CEE countries. The gradualistic model (Dunning calls it "the developing country model") is characterized by the gradual attraction of inflows of foreign capital. It is based on the hypothesis that the CEE countries are comparable to industrializing developing countries which changed from being small to substantial hosts to foreign capital inflows as they moved along a particular development path. This model has been applied in South Korea, Taiwan, Malasia, and some South American countries.
The second model is the reconstruction model. It explains the massive and wide-spread involvement of FDI over a short time period. This model recalls the experiences of the German and Japanese economies in the years after the Second World War. It assumes that the CE countries are highly industrialized and developed, but their industrial structure is outdated and inferior to that of the fastest growing, newly industrialized countries. Massive investment will turn them around and bring rapid profitability.
The third or "mixed" model is a combination of the first two models. The willingness of foreign investors to enter CEE markets depends primarily on the speed and extent to which these CE countries alter their economic and legal systems, and also on the ethos of their people towards entrepreneurship and wealth-creating activities. The nature of the systemic changes and the rate and efficiency with which they are introduced will determine the rate of FDI.
Foreign investors tend to apply the gradualistic model to Central and Eastern European countries. While this may be superficially pertinent, the underlying assumptions in most cases are, however, less appropriate. These countries consume more energy and have a work force that is better educated, better trained and well-off medically than most prosperous developing countries. Expenditures for research and development, as a percentage of GNP, approach that of some Western countries.
The Central and Eastern European countries are inclined to expect that foreign investors will follow the reconstruction model and will bring large amounts of FDI over a short period of time. They seem to disregard such difficulties as the need for a new commercial and legal system, the high political risk, and the investment necessary to improve a backward infrastructure.
Given the above, it is likely that the learning process will make everyone's assumptions more realistic. Foreign investors are using different strategies in different countries. The reconstruction approach, which implies rapid and widespread FDI, is being applied in Eastern Germany, the Czech Republic, Hungary, and Estonia. Investment from west to east within Germany has been approximately $100 billion per year. German investors treat the Czech Republic and Hungary as countries within its sphere of interest, and they invested more than $500 million there in 1991 and 1992. The Finnish investors, in turn, regard Estonia as their own future market and investment area.
The gradualistic model is applied toward the East European (EE) countries. This path, from attracting little to attracting substantial inflows of foreign investment, is used toward
investment in Russia, Albania, Romania, Bulgaria, Ukraine, and Belarus. Investors with small amounts of capital apply a "wait and see" strategy before they risk larger commitments.
The mixed approach is applied to such countries as Poland, Latvia, Lithuania, Slovenia, and Slovakia. The western investors expect a much slower initial participation of foreign investors due to the substantial initial and continuing costs they might have to incur to establish production units and market their products. Over time, it is expected that more FDI will accompany emerging reforms.
CONCLUSIONS
Analysis of the 1988-1992 data presented here leads to the conclusion that overall the CEE countries' privatization strategies have not been successful in attracting foreign direct investment. The $19.5 billion in investments constitutes only one and one-half percent of worldwide investment inflows. Only about two-third of the enterprises that were granted licenses actually commenced operations, a statistic which makes the picture of foreign investment even more dismal (Dunning 1993; Jermakowicz and Bochniarz 1991; Kubielas 1994).
Equally disappointing is the contribution that FDI has made to the privatization of state-owned enterprises. The estimated $7 billion of these investments is only a small percentage of the initial state-owned equity. In Poland, as shown by Jermakowicz (1994) foreign direct investments in privatization projects through June 1993 were only 1.67 percent of the state equity as valued in 1989 prices. This percentage is higher in the Czech Republic and Slovakia but does not exceed three percent. "Internationalization" of CEE enterprises has been a substantial contributor to economic restructuring and activity.
There has been some noticeable introduction of new technology and management practices provided by the large multinational investors. The smaller investors who account for much of the investment have contributed little. As experts from the Polish Foreign Investment Agency note, most of the foreign partners are trying to use already existing equipment (Spó_ki 1990). They are using different forms of equipment and machinery leases and returning stock payments as shareholders' dividends to their partners. The capital stock of many companies is kept artificially low.
Foreign direct investment has not fulfilled expectation that it would increase supplies of goods and services to local markets. The share of the total sale of goods and services provided by FDI enterprises is approximately ten percent. More than forty percent of enterprises with foreign direct investment are focusing on trade while most of the others are involved in simple food processing, textile production, and commodities.
Several major flaws contributed to these unsatisfactory results.
First, the recession in the European Union, and investment competition from the developing countries could have contributed to the slow growth of FDI in CEE.
Second, the overall domestic environment in most of CEE countries, with declining domestic output, high inflation rates, inconvertible currencies, underdeveloped infrastructure and financial services, and lack of the regulatory framework pertaining to land and property ownership, is also not conductive to attracting foreign investment.
Third, in a number of countries, the actual process of building market economy, privatization and creating the necessary institutional framework has not advanced significantly.
DEVELOPMENT OF FOREIGN DIRECT INVESTMENT
IN POLAND
Zbigniew Bochniarz, Władysław Jermakowicz, and Michał MellerINTRODUCTION
Despite the fact that since 1976 Poland has been the recipient of foreign direct investment (FDI), the real acceleration of FDI begun after the first free election in June 1989 and after the beginning of the "Big Bang - Balcerowicz Program" in January 1990 (Balcerowicz 1993). These political and economic factors immensely influenced the new FDI legislation and dramatically improved the "business climate."
This paper examines the influx, origin, and strategy of foreign direct investment in Poland which we define as a majority or minority ownership in another country's business entity. The paper particularly examines a strong relationship between the historical relationships and the past experience of western companies investing in Poland.
CHANGES IN LEGISLATION
The first joint venture law allowing full foreign participation was passed by the Polish Sejm on 23 April 1986. From this date forward, foreign investment legislation has become progressively more liberal, opening more sectors of the economy to foreign investors, allowing the full transfer of profits abroad, and finally, giving the investor more control over the venture (Jermakowicz, Bochniarz 1991).
This process of liberalization of FDI legislation culminated with the law of June 14, 1991. This law abolished the former requirement of a $50,000 minimum investment. The new law now requires a minimum start-up capital of only $1,000 for a limited liability company and $26,000 for a joint stock company. Furthermore, the 20% minimum stock ownership requirement was abandoned, and foreign companies became subject to the same taxation as Polish firms. Special permits are no longer required except in areas dealing with operation of sea- ports and airports, real estate agency transactions, defense industry, wholesale trade of imported goods, and consulting and legal services. The new legislation also removed some investment incentives such as tax holidays of between 3 to 6 years. Under the new law a firm may apply for a tax holiday, if stringent conditions requiring an investment of at least 2,000,000 ECU in regions experiencing structural unemployment are met.
POLISH EXPECTATIONS AND REALITY
There are high expectations about the role of FDI in the transition process, particularly in a country with a very limited capacity to generate capital and change its structure due to long history of central planning and mismanagement. Poland expects foreign direct investment to play a major role in three areas.
First, it expects FDI will stimulate the privatization process of Poland's economy. It expects that this process will not only convert the structure of the Polish economy into an efficient one, but will also be a major factor in integrating the economy into the international
system. Furthermore, FDI is expected to be a strong contributor of foreign capital which Poland needs due to its hard currency shortages. And lastly, Poles expect from FDI not only the introduction of modern technology know-how, but also managerial skills. The major argument is that foreign investment through its introduction of modern technology and international connections will change Poland's export structure to high value added products (Jermakowicz, Bochniarz 1991).
Poland has experienced increasing FDI inflows since 1987. The largest increase over the preceding year occurred in 1989. In 1988 there were 30 investments in Poland whereas in 1989, 518 foreign investors entered the country (Table 1). This dramatic, almost eight fold increase in capital and joint ventures numbers in 1988 was beaten the next year when the number of joint ventures increased by a factor of 16.7 and capital increased by 13.7. It is obviously clear that such a dynamic could not be sustained.
TABLE 1: FLOWS AND STOCK OF FDI (FOREIGN DIRECT INVESTMENT)
Year Growth of FDI By Number Growth of FDI by Capital Average Size of the Firm Number Accum Dynamic Capital Accumulate Dynamic Annual Accum 1987 1988 1989 1990 1991 1992 1993 3 30 518 1,493 3,125 3,456 4,179 3 33 551 2,044 5,169 8,625 12,804 11.00 16.70 3.71 2.53 1.67 1.48 696 6,880 96,413 204,458 425,096 679,984 1,375,929 696 7,576 103,989 308,447 733,543 1,413,527 2,789,456 10.89 13.73 2.97 2.38 1.93 1.97 232.0 229.3 186.1 136.9 136.0 196.8 329.2 232.0 229.6 188.7 150.9 141.9 163.9 217.9 Source: Computation based on the data provided by Ministry of Privatization and the Main Statistical Board
A similar situation occurs with invested capital. Although the number of projects increased by 48 percent in 1993, the growth of capital is about 97 percent. The observation of the average size of the firm measured by invested capital shows that beginning in 1992, the per firm capital contribution each year was greater than in the previous year. This may mean that larger investors are starting to invest in Poland.
GREENFIELD VS. ACQUISITIONS
A part of a foreign company's decision to invest in a particular country is the selection of the most appropriate investment mode. This depends to a large degree on the investor's motives and the industry. No one mode is better or worse than another; all depend on individual intentions and circumstances.
As stated in the Chapter One, there are three basic investment modes: greenfield (new) investment, indirect acquisition through establishment of a joint venture, and direct acquisition through which a foreign investor buys a share (partially or entirely) in a local company. The last mode is closely related to the privatization process.
Table 2 illustrates the dramatic change in the structure of the investment modes between 1988 and 1992. Although the value of all modes of investment have significantly increased, the proportions of greenfield and privatization have changed over these years.
TABLE 2: GREENFIELD INVESTMENT AND INDIRECT AND DIRECT ACQUISITIONS IN POLAND (1987-1993)
Year Greenfield Indirect Acquisition Direct Acquisition Total $ % $ % $ % $ % 1987 82 11.8% 614 88.2% 0 0.0% 696 100 1988 1,686 24.5% 5,194 75.5% 0 0.0% 6,880 100 1989 26,514 27.5% 54,399 56.4% 15,500 16.1% 96,413 100 1990 72,992 35.7% 91,266 44.6% 40,200 19.7% 204,458 100 1991 180,666 42.5% 126,796 31.4% 105,300 26.1% 403,646 100 1992 320,272 47.1% 9,712 1.4% 350,000 51.5% 679,984 100 1993 692,092 50.3% 4,934 0.4% 678,903 49.3% 1,377,929 100 Total 1,294,308 46.4% 293,748 10.6% 1,189,903 43.0% 2,768,006 100 Source: Computation based on data provided by the Ministry of Privatization and the Main Statistical Board
First of all, an impressive process of increase in the role of greenfield investment is observable. If in 1987 only $82 thousand were investments in new companies, then at the end of 1993, these investments were more than eight thousand times higher and constituted almost half of all FDI inflow (46.4%). This increase is the best indicator of the increase in the trust in the Polish market and its growing willingness to start new ventures.
A second clear observable phenomenon is an increase in the receipts from direct acquisition. If in 1989 only $15.5 million was received for firms privatized, which constituted 16.1% of all inward investment, then in the year 1993 the receipts for privatization were more than 42 times higher ($678.9) and constituted 49.3 percent of all inflow.
The third phenomenon is the decline of the share of the FDI in joint venture establishments. If in 1987 joint ventures were the only attractive method to improve the financial situation of State-Owned Enterprises (SOEs), then six years later they play a more than marginal role (.4%). Apparently, greenfield investment and privatization are more attractive paths.
The fourth observable process is the relatively faster growth of greenfield investment than direct acquisition (privatization) investment. Privatization was a hit in 1992 when it constituted 51 percent, but in 1993 it seems to grow more slowly than new establishments. The author believes that greenfield investments will increase at a faster rate than those involving privatization. Poland has either already privatized the most attractive enterprises, or privatization is meeting increased resistance among population. Adding to the relative interest in greenfield investment is the growing investor confidence in political stability and the potential for high returns.
The role of greenfield investment is more impressive if the number of enterprises is compared (see Table 3). In 1993 there was a total of 10,672 greenfield investments which constituted 92.4 percent of all FDI as opposed to 815 indirect acquisitions which comprise 7.1 percent of foreign investors, and 60 direct acquisitions which constitute a mere .5 percent of all cases. The analysis of the capital invested by both groups, however, shows that indirect and direct acquisitions have contributed relatively more capital than greenfield in both aggregate amounts and average investment per enterprise.
Investors acquiring Polish firms directly in the framework of the privatization process in the years 1989-1993 contributed $1,189.9 million or 43 percent of the total FDI capital contributions. The average foreign share in capitalization per one firm shows enormous differences. Greenfield investment amounts to only $121.3 thousand per firm, whereas the average share in capitalization per joint venture is $360.4 thousand (nearly three times more),
and per direct acquisition is $18,028.8 thousand (149 times more). Apparently, greenfield investments are fairly small shops made by small investors. In privatization through direct acquisition, in turn, mostly large firms are involved.
TABLE 3: DISTRIBUTION OF FOREIGN INVESTMENT BY THE TYPE OF INVESTMENT (December 31, 1993)
Average Size
of Firm Modes of Investment in Poland
Greenfield Indirect Acquisition Direct Acquisition 10,672 815 66 92.4 7.1 0.5 1,294,308 293,748 1,189,903 46.4 10.6 43.0 121.3 360.4 18,028.8 Total 11,553 100.0 2,768,006 100.0 239.6
Modes of Investment in CEE Greenfield Indirect Acquisition Direct Acquisition 7,038,000 5,458,000 6,997,000 36.1 28.0 35.9 Total 99,533 100.0 19,493,000 100.0 195.8
Source: Computation based on the data provided by Ministry of Privatization, the Main Statistical Board and Jermakowicz, Bellas (1994). See also Chapter One.
The comparison of the Polish FDI distribution to distribution present in other Central and Eastern European countries (CEE) show few differences. First, foreign investors entering the Polish markets choose greenfield investment to a higher degree than in other post-communist countries (46.4% vs. 36.1%). This can be the result of both a more liberal investment climate existing in Poland or quite the opposite, fears of a restitution process due to the lack of the Reprivatization Law. Also the opinion of the strong rebelling trade unions existing in Polish enterprises which could be acquired in acquisition cases, contributes to the relative popularity of greenfield investment. Through greenfield investment, the foreign investors can build the firm and its culture and select a staff according to the owners' visions and desires. Second, the comparison of the distribution of foreign investment by the mode of investments also shows that in Poland to a much lower degree indirect acquisition through joint ventures is applied (10.6% vs. 28.0%). This may also be an indicator that the Polish economy is entering a more mature stage in attracting foreign investors according to the rule that the large share of joint ventures in an economy seems to indicate that the economy is in its infancy stage.
Data on the direct acquisition between different the Central European (CE) and selected Eastern European (EE) countries also shows different features (See Table 4)
The comparison of CE and selected EE countries seems to show that the first are much more advanced in privatization than the latter. The small, two million population Slovenia sold to foreigners more equity than the 148 million Russia (This situation has already changed in 1994.) Romania is much behind the small Estonia, and so forth. Undoubtedly, the Central European countries are more advanced in the road to a United Europe and more attractive for West European investors.
The situation among the CE countries is also very differentiated. Over the years 1989-1992, Hungary has recorded the largest number of sales (102) and the largest amount of FDI in privatization ($2.3 billion). About 81 percent of FDI in this country is accounted for by direct foreign acquisition. Poland is second with 66 privatization projects, however the capital invested is very modest ($511 million) and much lower than that in Czechoslovakia (46 projects and total capital inflow from privatization of $1.8 billion). In Czechoslovakia,
over 1/3 of the foreign investments were made in the companies privatized within Large Scale Privatization. It should be noted that two Central European countries, Lithuania and Latvia, had no FDI flowing into the privatization of state-owned enterprises.
TABLE 4: DIRECT ACQUISITIONS IN CENTRAL EUROPEAN AND SELECTED EASTERN EUROPEAN COUNTRIES (data on December 31, 1992)
Country # of acquired firms Equity of acquired firms
Equity sold Equity sold to foreigners Future commit-ments Av. size of the sale Czech-slovakia 46 3,749.1 (100%) 2,023.8 (53.9%) 1,822.3 (90.1%) 7,043.3 44.0 Estonia 5 296.0 (100%) (41.8%) 124.0 (100%) 124.0 0 24.8 Hungary 102 4,742.3 (100%) (66.1%) 3,134.5 (73.2%) 2,295.0 828.0 30.7 Poland 66 1,046.4 (100%) 735.5 (70.3%) 511.0 (69.5%) 1,876.0 11.1 Slovenia 3 148.3 (100%) 129.0 (87.0%) 129.0 (100%) 0 43.3 Romania 2 70.6 (100%) (70.3%) 60.0 (51.6%) 31.0 0 15.0 Russia 8 140.1 (100%) 120.0 (70.3%) 120.0 (100%) 0 30.0 Ukraine 3 15.7 (100%) 8.0 (51%) 8.0 (100%) 0 4.0 Yugoslavia 3 720.0 (100%) (50.0%) 360.0 (100.0%) 360 0 120.0 Source: Own calculations on the basis: Sader (1993), East-West (1991-1993)
Poland's situation in comparison to other countries is very mixed. Poland has the second largest number of firms acquired through foreign investors but at the same time the average size of the sale is the smallest one among central European economies -- one-fourth of the size of Czechoslovakia and Slovenia and one-third of that in Hungary. Undoubtedly the Polish privatization projects are the smallest ones. Poland, however, was successful in getting the second largest future commitment (1,876.0) after Czechoslovakia ($6.1 billion Volkswagen alone) and before Hungary (828.0). In Poland the future commitments are 3.6 times higher than the capital invested by foreign firms. This is a typical game pursued by Polish managers: lower the sale price because receipts from the sale will go to the State Budget, and maximize future commitments because these commitments will stay in the company. Unfortunately, many firms have problems in executing these commitments in the future.
MAJORITY VS. MINORITY STAKES
Foreign investors prefer majority holdings over minority stakes. Table 4 shows the relationship between acquisitions and greenfield investments in terms of equity ownership. The general trend suggests an investor preference towards majority holdings, although there are some discrepancies between greenfield and acquisition type investments. Approximately 1/2 of foreign investment through acquisitions results in minority share holdings between 11 percent and 50 percent. The second half falling between 51 percent and 99 percent. There
are only 5 acquisitions with 100 percent foreign ownership. Nevertheless, the tendency is an ownership structure of at least 50 percent of shares.
Error! Reference source not found.TABLE 5. DISTRIBUTION OF FDI BY FOREIGN SHARE IN CAPITAL
Foreign share
in capital (%) Total Acquisitions Foreign Greenfield Investments Number % Number % Number % up to 10% 11% to 49% 50% 51% 52% to 74% 75% to 99% 100% 1,4 1,9 2,7 4,0 0.2 12.1 16.6 4.3 7.8 23.9 35.2 5 255 174 112 199 64 5 .6 31.4 21.3 13.7 24.4 7.9 0.6 1, 1, 2, 4, 0.1 10.7 16.2 3.6 6.5 25.1 37.8 Total 11,55 100.0 815 100.0 10,7 100.0 Source: Computation based on the data provided by Ministry of Privatization and the Main Statistical
Board
In terms of greenfield investments, we see two different strategies. In the first group 36 percent of the investors hold either a minority or a 50 percent stake with about 16 percent of greenfield investments having exactly 50 percent of the shares. The second group or 62 percent of new start up ventures have a clear majority stake between 74 percent and 100 percent. A little over half of this group has a 100 percent ownership structure. When comparing investments between greenfield and acquisitions, the investors choosing the acquisition path have a tendency toward a lower share holdings than greenfield investors. Since an acquisition in Poland is equivalent to privatization, a large portion of shares becomes distributed among employees, the state, and in some cases, creditors or banks. This partially explains the difference in the percentage of ownership associated with foreign investment through acquisition.
In 1992 the major concentration of FDI was channeled into industry; 35 percent of FDI entered that sector. Some of the better known investments are the Italian concern Fiat, General Motors, Asea Brown Boveri and Unilever. Trade accounts for about 8 percent of FDI and the remaining investments are distributed among construction, services, and tourism. It is interesting that services account for a small percentage of FDI. The service sector has generally been underrepresented in the CEE countries which suggests that this lack of competition would attract investors. One reason for the small inflow of FDI in the service sector may be the quick entry of local companies, therefore increasing competition.
ORIGIN OF INVESTORS
The majority of investors come from countries bordering Poland or those which have historically been Poland's trading partners. The role of immigration also plays an important part in the source of FDI inflow.
In terms of numbers of FDI projects, among 93 countries whose capital is present in Poland, four of them (Italy, the United States, Germany and the Netherlands) account for 47.6 percent of investment projects and 69.2 percent of the capital invested in Poland. Germany has the largest share with 27.3 percent of the total foreign investment projects. In terms of capital, however, Italy occupies the first position, having invested 30.2 percent of the foreign
capital. The average size of Italy's firm amounts to $887.9 million, the result of the large capital investments made by Fiat, Luccini Groupe, and Frotrade Financing. Germany, in turn, has a large number of firms with very small average capital amounting to $67.9 thousand per firm. According to average investments, Germany is ranked 20th place among all countries.
From an investment strategy perspective, Italy accounts for 53.8 percent of foreign acquisitions in Poland while its share in greenfield investments has been relatively low at 2.9 percent. On the other hand, the United States, Germany and the Netherlands account for 69.2 percent of the FDI projects, and their combined share of greenfield investments is 60 percent.
While examining this pattern, it is interesting to note the historical relationships which are mirrored in today's investment patterns. Those past relationships have created a tradition or familiarity with the region. Today firms from those countries are less wary of Poland and tend to invest greater amounts. The European Union accounts for 62.2 percent of the capital invested, and 61.2 percent of FDI projects. We see that it holds the majority stake, followed by the United States and Canada. Japan has a very low share of both capital (.2 percent) and projects (.4 percent); Japanese firms tend to be more conservative in their investment patterns.
TABLE 6: DISTRIBUTION OF FDI BY MAJOR INVESTING COUNTRIES - VALUE OF INVESTED FOREIGN CAPITAL AT THE END OF 1993
Total Acquisition Greenfield
Country $Millions % Firms Ave. $Millions % $Millions % ITALY USA GERMANY NETHERLANDS FRANCE SWEDEN AUSTRIA GREAT BRIT. NORWAY SWITZERLAND DENMARK LIECHTENSTEIN BELGIUM AUSTRALIA AFGHANISTAN USSR CANADA IRELAND ISRAEL GREECE SPAIN JAPAN LUXEMBOURG PORTUGAL 546.058 347.706 214.983 143.731 83.671 70.063 65.935 59.878 40.331 40.174 36.862 24.300 20.461 13.066 11.631 9.359 9.181 8.949 7.179 4.358 3.927 3.063 1.593 0.528 30.2 19.2 11.9 7.9 4.6 3.9 3.6 3.3 2.2 2.2 2.0 1.3 1.1 0.7 0.6 0.5 0.5 0.5 0.4 0.2 0.2 0.2 0.1 0.0 615 983 3,167 739 621 634 700 490 91 302 263 74 281 123 14 150 184 21 56 92 100 36 33 10 887.9 353.7 67.9 194.5 134.7 110.5 94.2 122.2 443.2 133.0 140.5 328.4 72.8 106.2 830.9 62.5 49.9 426.1 128.2 47.4 39.3 85.1 46.6 52.8 521.501 66.532 71.800 79.915 11.989 40.571 35.606 31.441 32.561 17.237 24.638 6.522 5.273 7.307 0.000 2.974 2.138 2.484 1.067 0.135 0.428 0.000 0.115 0.287 53.8 6.9 7.4 8.2 1.2 4.2 3.7 3.2 3.4 1.8 2.5 0.7 0.5 0.8 0.0 0.3 0.2 0.3 0.1 0.0 0.0 0.0 0.0 0.0 24.557 281.174 143.183 63.816 71.682 29.491 30.329 28.437 7.769 22.937 12.223 17.778 15.187 5.759 11.631 6.384 7.043 6.465 6.112 4.223 3.499 3.063 1.478 0.241 2.9 33.5 17.0 7.6 8.5 3.5 3.6 3.4 0.9 2.7 1.5 2.1 1.8 0.7 1.4 0.8 0.8 0.8 0.7 0.5 0.4 0.4 0.2 0.0 OTHERS EEC TOTAL 42.947 1,125.000 100.0% 62.2 9,779 7,066 61.2% 159.1 750,00666.3% 77.3% 374,99433.4% 44.6% TOTAL % 1,809.934 100.0 0.0 100.0 11553 100 184.9 969.720 53.6 100 840.213 46.4 100
Then next observation relates to the structure of FDI. In the case of EEC countries, 2/3 of all investment is made by acquisition of existing businesses and only 1/3 by new greenfield allocations. In the case of the rest of the world, the proportion is quite opposite: two thirds of FDI is made in greenfield and only one third in existing businesses. Undoubtedly,
geographical distance is an important factor: the closer the country the more investment is made via acquisitions, the further located country the more greenfield investment seems to be attractive. We see very little investment from the CEE countries; there is some investment from the former USSR and that is mostly related to the construction of a gas pipeline form Siberia to Western Europe.
INVESTMENT PROJECTS
According to the latest information from the State Foreign Investment Agency (November 15, 1993) , the total financial involvement of the 173 biggest foreign investors (equity and credit) amounts to $2.614 million. The investment commitments of these 173 investors reach the level of $3.467 million. Table 6 shows the 20 largest foreign investors in Poland. The joint venture between the Italian Fiat and the Small Car Factory (FSM) in Bielsko-Biała is the absolute leader on this list both in actual financial involvement and their attitude about future investment commitments.
TABLE 7: TWENTY LARGEST FOREIGN INVESTORS IN POLAND (ON NOVEMBER 15, 1993)
No. Foreign Investor Country Area of activity Financial involvement (equity+debt) ($ mill.) Future investment commitments ($ mill) 1. 2. 3. 4. 5. 6. 7. 8. 9. 10. 11. 12. 13. 14. 15. 16. 17. 18. 19. 20. Fiat Coca-Cola Int. Paper (IPC) Warimpex
Asea Brown Boveri Curtis Internat. Unilever
Pol.-Amer. Enterp. Fund EBRD
Procter & Gamble Thompson C.E. Fortrade Financing Cimenteries CBR RJ. Reynolds Ameritech France Telecom Alcatel IFC Pepsico Ringnes Italy USA USA Austria Swiss/Swede n USA Netherlands USA - USA France Italy International USA USA France Spain International USA Norway car industry soft drinks paper products hotels, offices power eng. ind. electron./constr. chemicals, food capital participat. banking, port.inv hygiene products tv. tubes and sets office & ind. bldg. cement industry tobacco industry telecommunication s telecommunication s telecommunication s glass, construction sweets, soft drinks packaging, distrib. 180.0 170.0 120.0 100.0 100.0 100.0 96.0 83.0 72.0 60.0 60.0 55.0 54.0 50.0 45.0 45.0 42.7 42.0 40.0 40.0 830 50 175 80 20 0 0 29 0 130 40 0 33 0 100 100 85 144 68 29 Total % of all firms 1,564.7 (60%) 1,913 (55%)
Table 7 shows different modes of foreign investment. Some of them are typical joint ventures between foreign investors and Polish state-owned companies (FSM with Fiat, Dolmel and Zamech with ABB), involvement in equity privatization through direct buying of strategic packages of shares (Kwidzyń Paper Company acquired by IPC, TELFA Telecommunications Equipment Company in Bydgoszcz bought by Ameritech), portfolio investment in new private companies as well as in privatized ones (Polish American
Enterprises Fund, WEDEL with PepsiCo), and typical greenfield investments (Curtis International, Procter and Gamble, Warimpex, RJ Reynolds) (Błaszczyk, Dąbrowski 1993). These twenty largest foreign investments constitute 55,8 percent of all the investments and 55 percent of all investment commitments: a high capital concentration of FDI in Poland. Eight companies are from the United States, two from Italy, two from France. Very remarkable is the absence on the "Top Twenty" list of any companies from Germany, which seems to confirm the observation about small average capital investments from Poland's western neighbors.
TRENDS IN THE FOREIGN DIRECT INVESTMENT IN
POLAND
Zbigniew Bochniarz, Michał Meller, David ToftINTRODUCTION
Poland made a historical turn to a pluralistic society with a market economy during this period of analysis. This historically important fact, does not necessarily mean the same for foreign investors. Although, it would be difficult to find foreign investors glorifying the old communist regime, many of them, indeed, felt lost in the turmoil caused by the political and economic changes in Central and Eastern Europe and in the Newly Independent States (NIS). For them, these radical changes, although regarded as highly positive, presented distortions in the business environment in which they used to operate.
Despite the pioneering role of Poland in political and radical economic reforms among nations in transition, five governments within four years often suggested a lack of political stability.
In the previous chapter we analyzed foreign direct investment data in terms of greenfiled and acquisition type investments. This chapter examines the impact of environmental degradation, unemployment, development, and the degree of urbanization on the regional inflows of foreign capital into Poland between the years 1990 and 1992. We obtained data on the date the investment was registered, the number of Polish and foreign partners, the percent of Polish and foreign share in a proposed joint-venture, the home country of the foreign investor and the total capitalization rate of the investment. This work serves as an initial overview of detailed data from the Polish Ministry of Privatization.
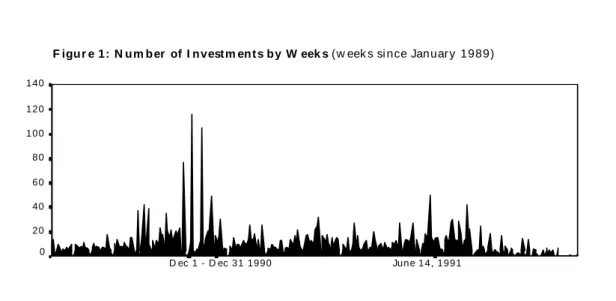
Time
Figure 1 presents data of FDI by weeks from the end of 1989 to the beginning of 1993. The registration peak (close to 120 registrations per week) was reached at the end of 1990, when the new budget law was announced canceling three years of tax holidays from January 1,1991.
F igu r e 1: N um b er of I nvestm ent s by W eek s (w eek s si nce Januar y 1989)
140 120 100 80 60 40 20 0 June 14, 1991 D ec 1 - D ec 31 1990
The second highest peak of registration took place after the new J-V Law was passed by the Parliament on June 14, 1991. Despite the lack of tax holidays, the new law abolished the