by
Guanting Tang
M.Sc., Georgia Southwestern State University, 2008 B.Sc. Shanghai Ocean University, 2007 Thesis Submitted in Partial Fulfillment of the Requirements for the Degree of
Doctor of Philosophy in the
School of Computing Science Faculty of Applied Sciences
c
Guanting Tang 2015 SIMON FRASER UNIVERSITY
Spring 2015
All rights reserved.
However, in accordance with theCopyright Act of Canada, this work may be reproduced without authorization under the conditions for “Fair Dealing.” Therefore, limited reproduction of this work for the purposes of private study,
research, criticism, review and news reporting is likely to be in accordance with the law, particularly if cited appropriately.
Name: Guanting Tang
Degree: Doctor of Philosophy
Title of Thesis: NEW METHODS IN OUTLIER DETECTION
Examining Committee: Dr. Ramesh Krishnamurti Chair
Dr. Jian Pei, Senior Supervisor, Professor, Computing Science, SFU
Dr. Wo-Shun Luk, Supervisor, Professor, Computing Science, SFU
Dr. Yupin Yang, Supervisor,
Assistant Professor, Beedie Business School, SFU
Dr. Jiangchuan Liu, Internal Examiner, Professor, Computing Science, SFU
Dr. Alex Thomo, External Examiner,
Associate Professor, Computer Science, University of Victoria
Date Approved: April 22nd, 2015
Partial Copyright Licence
Outlier detection has been studied extensively in data mining. However, as the emergence of huge data sets in real-life applications nowadays, outlier detection faces a series of new challenges. Many traditional outlier detection techniques do not work well in such an environment. Therefore, developing up-to-date outlier detection methods becomes urgent tasks.
In this thesis, we propose several new methods for detecting different kinds of outliers in high-dimensional data sets from two different perspectives, namely, detecting the outlying aspects of a data object and detecting outlying data objects of a data set. Specifically, for detecting the outlying aspects of a data object, we propose the problems of mining outlying aspects and mining contrast subspaces; for detecting outlying data objects of a data set, we propose the problems of mining contextual outliers and mining Markov blanket based outliers. We develop efficient and scalable algorithms to tackle the computational challenges. We also conduct comprehensive empirical studies on real and synthetic data sets to verify the effectiveness of the proposed outlier detection techniques and the efficiency of our algorithms.
Keywords: outlier detection; outlying aspects detection; outlier interpretation
— The Perks of Being a Wallflower,Stephen Chbosky, 1999
Acknowledgments
I wish to express my deepest gratitude to my senior supervisor and mentor, Dr. Jian Pei. I thank him for his continuous encouragement, confidence and support during my Ph.D study. He shared with me not only valuable knowledge and research skills but also the wisdom of life. Dr. Pei’s guidance enables me to hurdle all the obstacles in the completion of this research work. I believe what he has trained me in graduate school will benefit my career all the time.
My gratitude goes to my supervisors, Dr. Wo-Shun Luk and Dr. Yupin Yang, for providing insightful comments and helpful suggestions that helped me to improve the quality of my research. Their visionary thoughts and energetic working style have inuenced me greatly. Part of this work is done in collaboration with Dr. James Bailey, Dr. Guozhu Dong and Dr. Lei Duan. I thank them for the knowledge and skills they imparted through the collaboration.
I am very thankful to Dr. Jiangchuang Liu and Dr. Alex Thomo for serving in my thesis examining committee. I would also like to thank Dr. Ramesh Krishnamurti to chair my thesis defense.
I would also like to thank many people in our department, support staff and faculty, for always being helpful over the years. I thank my friends at Simon Fraser University for their accompany and help. A particular acknowledgement goes to Crystal (Zhengzheng) Xing, Carrie (Cong) Wang, Ming Hua, Bin Jiang, Bin Zhou, Qiang Jiang, Yi Cui, Hossein Maserrat, Luping Li, Zhenhua Lin, Da Huang, Yi Han, Xiao Meng, Xiangbo Mao, Guangtong Zhou, Juhua Hu, Jiaxing Liang, Chuangcong Gao, Xiaoning Xu, Yu Tao, Ruiwen Chen, Yu Yang, Lin Liu, Berer Lu, Ye Wang, Lumin Zhang and Li Xiong. They have made my graduate school enjoyable and memorable.
Last but not least, I am very grateful to my families who always support, encourage, and tolerate me without limits. Their love accompanies me wherever I go.
Approval ii
Partial Copyright License iii
Abstract iv
Dedication v
Quotation vi
Acknowledgments vii
Contents viii
List of Tables xii
List of Figures xiv
1 Introduction 1
1.1 Motivation . . . 2
1.2 Challenges and Contributions . . . 5
1.3 Organization of the Thesis . . . 9
2 Related Work 11 2.1 Traditional Outlier Detection Method . . . 11
2.1.1 Statistical methods . . . 11
2.1.2 Proximity-based methods . . . 13
2.1.3 Clustering-based Methods . . . 14 viii
2.3 Related Work to the Proposed Problems . . . 17
2.3.1 Mining Outlying Subspaces . . . 17
2.3.2 Mining Contrast Subspaces . . . 19
2.3.3 Mining Contextual Outliers . . . 21
2.3.4 Mining Markov Blanket Based Outliers . . . 23
3 Mining Outlying Aspects 26 3.1 Motivation . . . 26
3.2 Problem Definition . . . 29
3.3 The Framework . . . 31
3.3.1 Kernel Density Estimation . . . 32
3.3.2 The Framework ofOAMiner . . . 34
3.4 Critical Techniques in OAMiner . . . 37
3.4.1 Bounding Probability Density . . . 38
3.4.2 Efficiently Estimating Density Bounds . . . 46
3.4.3 Subspace Pruning . . . 47
3.5 Empirical Evaluation . . . 51
3.5.1 Mining Outlying Aspects on Real Data Sets . . . 51
3.5.2 Outlying Aspects Discovery on Synthetic Data Sets . . . 56
3.5.3 Outlying Aspects Discovery on NBA Data Sets . . . 58
3.5.4 Efficiency . . . 61
3.6 Conclusions . . . 65
4 Mining Contrast Subspaces 66 4.1 Motivation . . . 66
4.2 Problem Formulation and Analysis . . . 67
4.2.1 Problem Definition . . . 68
4.2.2 Kernel Density Estimation . . . 69
4.2.3 Complexity Analysis . . . 70
4.3 Mining Methods . . . 75
4.3.1 A Baseline Method . . . 75
4.3.2 The Framework ofCSMiner . . . 76
4.3.3 A Bounding-Pruning-Refining Method . . . 79 ix
4.4.2 Efficiency . . . 91
4.4.3 Sensitivity to the Bandwidth . . . 94
4.4.4 Comparison with Epanechnikov Kernel . . . 98
4.5 Conclusions . . . 101
5 Mining Contextual Outliers 102 5.1 Motivation . . . 102
5.2 Contextual Outliers . . . 105
5.3 Contextual Outlier Analysis . . . 109
5.3.1 Redundancy Removal Using Closures . . . 109
5.3.2 Relationships among Outliers . . . 111
5.3.3 Finding Significant Outliers . . . 112
5.4 Detection Algorithms . . . 113
5.5 Experimental Results . . . 116
5.5.1 Results on Real Data Sets . . . 116
5.5.2 Results on Synthetic Data Sets . . . 126
5.6 Conclusions . . . 127
6 Mining Markov Blanket Based Outliers 129 6.1 Motivation . . . 129
6.2 Markov Blankets for Subspace Discovery . . . 131
6.2.1 Preliminaries . . . 131
6.2.2 Markov Blanket Subspaces . . . 132
6.3 Mining Outliers in Markov Blanket Subspaces . . . 135
6.3.1 Learning Bayesian Networks in Subspaces . . . 136
6.3.2 Mining and Characterizing Outliers . . . 139
6.3.3 Pruning Markov blanket subspaces . . . 142
6.4 Experiment results . . . 142
6.4.1 Experiments on synthetic data . . . 143
6.4.2 Experiments on real-world data . . . 147
6.5 Conclusion . . . 149 x
7.1 Summary of the Thesis . . . 150 7.2 Future Research . . . 152
Bibliography 155
Appendix A List of Publications 167
A.1 Publications Related to This Thesis . . . 167 A.2 Other Publications . . . 168
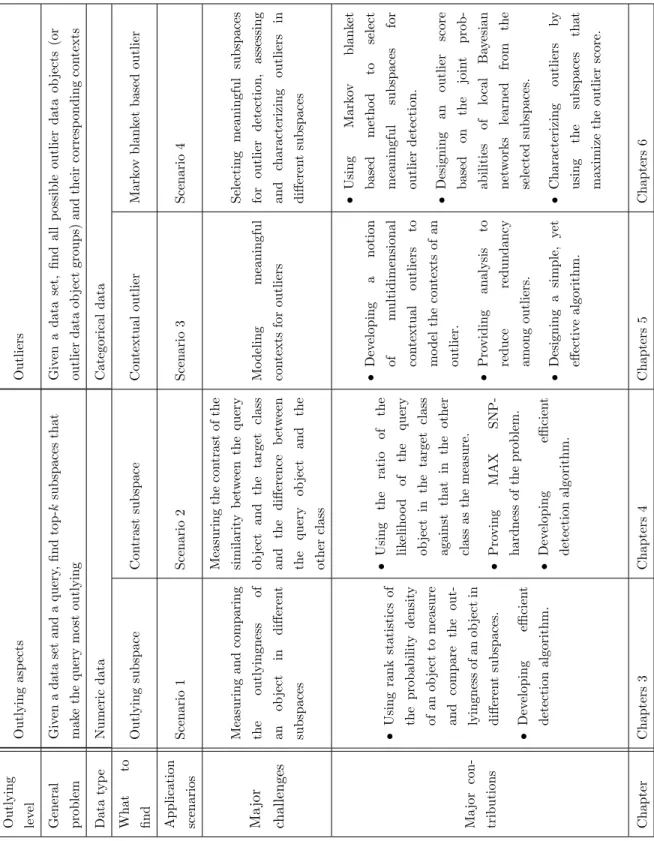
1.1 A summary of problems, challenges, and contributions. . . 8
3.1 A numeric data set example . . . 36
3.2 Quasi-density values of objects in Table 3.1 . . . 37
3.3 Summary of frequently used notations in Chapter 3. . . 38
3.4 The 20 technical statistics . . . 52
3.5 Data set characteristics . . . 52
3.6 Sensitivity ofOAMiner’s effectiveness w.r.t. parameter`. . . 55
3.7 Outlying aspects on Synth10D. . . 57
3.8 Statistics on the mining results ofOAMiner on synthetic data sets . . . 58
3.9 The guards having the most rank-1 outlying aspects . . . 59
3.10 The guards having poor ranks in outlying aspects . . . 60
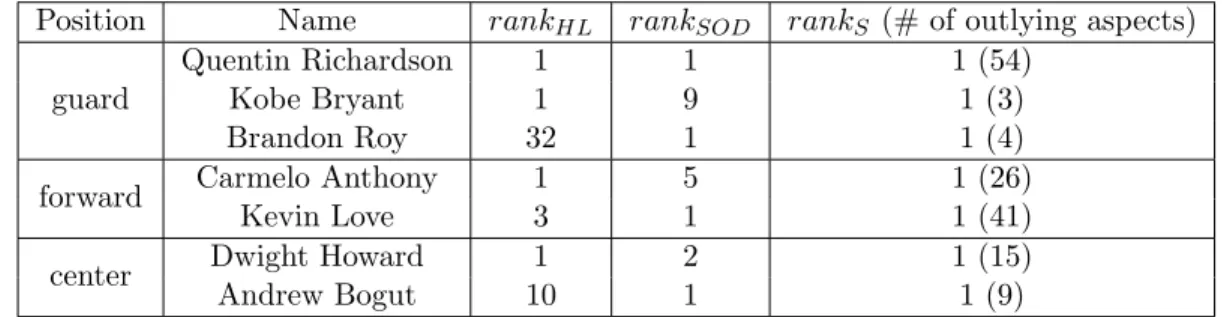
3.11 The outlyingness ranks of players ranked top inHiCS orSOD . . . 60
3.12 Average runtime ofOAMiner w.r.t parameter α . . . 65
4.1 Summary of frequently used notations in Chapter 4 . . . 69
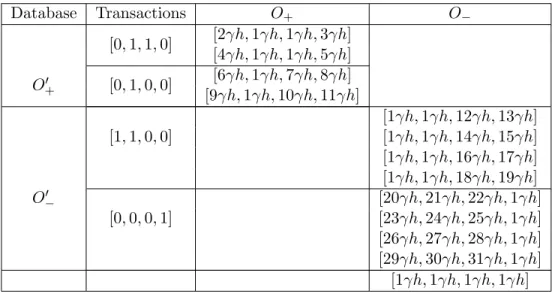
4.2 An example transformation from a transaction database to a numeric dataset according to the EP→ Complete-CS reduction . . . 72
4.3 Data set characteristics . . . 85
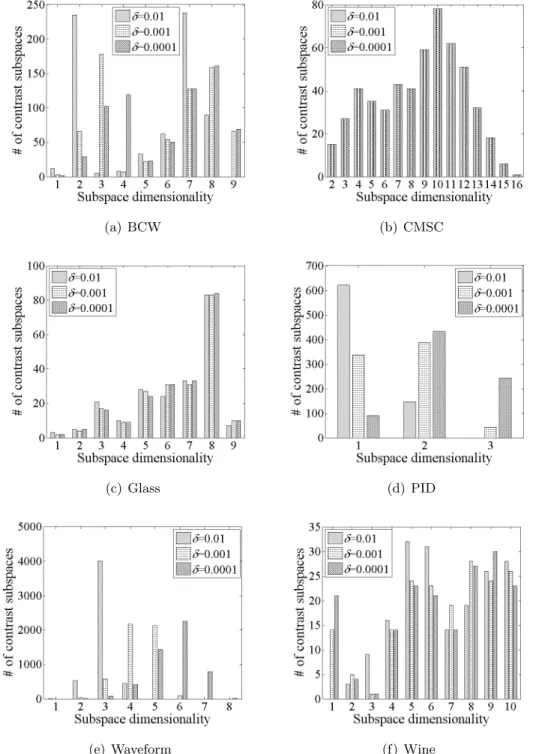
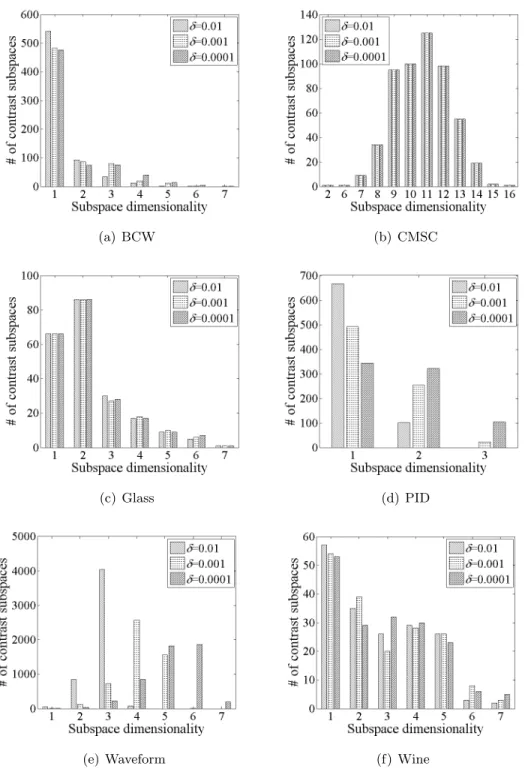
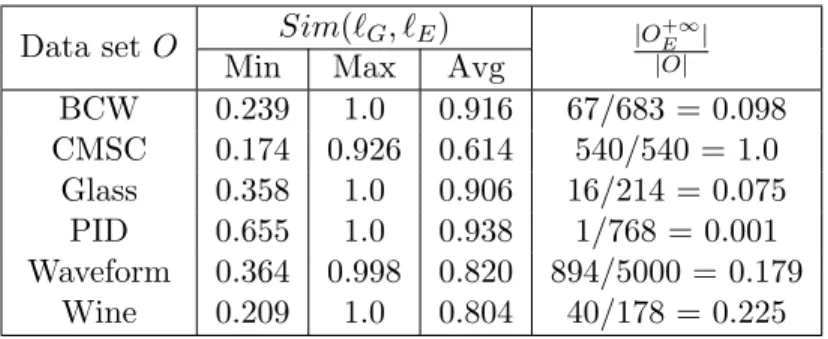
4.4 Distribution ofLCS(q) in BCW (δ= 0.001, k= 1) . . . 86 4.5 Distribution ofLCS(q) in CMSC (δ = 0.001, k= 1) . . . 86 4.6 Distribution ofLCS(q) in Glass (δ= 0.001, k= 1) . . . 86 4.7 Distribution ofLCS(q) in PID (δ= 0.001, k= 1) . . . 87 4.8 Distribution ofLCS(q) in Waveform (δ = 0.001, k= 1) . . . 87 4.9 Distribution ofLCS(q) in Wine (δ = 0.001, k= 1) . . . 87 xii
4.11 Similarity between top-10 inlying contrast subspaces using different kernel
functions in data set O (δ = 0.001) . . . 99
4.12 Similarity between top-10 outlying contrast subspaces using different kernel functions in data set O (δ = 0.001) . . . 100
4.13 Similarity between top-10 inlying contrast subspaces using different kernel functions in data set O\O+E∞ (δ = 0.001) . . . 100
4.14 Similarity between top-10 outlying contrast subspaces using different kernel functions in data set O\O+E∞ (δ = 0.001) . . . 101
5.1 A table T of a set of customers. . . 105
5.2 Summary of definitions and frequently used notations in Chapter 5. . . 108
5.3 The statistics of the data sets. . . 116
5.4 Some contextual outliers on data set hayes-roth (∆ = 5, s = 10−8). The underlined attributes indicate the shared AVSs. . . 118
5.5 Some contextual outliers on data set mushroom-sc (∆ = 50, s= 10−3). The underlined attributes indicate the shared AVSs. . . 119
5.6 The number of contextual outliers w.r.t. significance threshold. . . 122
5.7 The precision & recall of COD, and comparison with LOF. . . 126
6.1 Summary of frequently used notations in Chapter 6 . . . 135
6.2 Nine outliers discovered in the zoo data set . . . 148
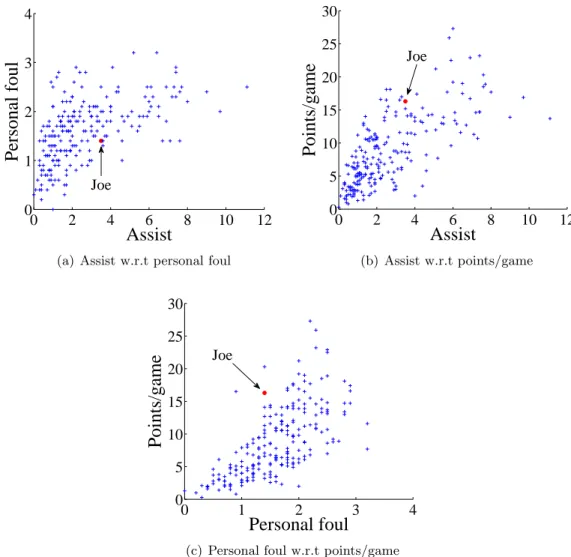
3.1 Performance of NBA guards on assist, personal foul and points/game in the
2012-2013 Season (the solid circle (•) represents Joe Johnson) . . . 27
3.2 A set enumeration tree. . . 35
3.3 Distributions of outlyingness ranks (`= 5) . . . 53
3.4 Distributions of total number of outlying aspects (`= 5) . . . 54
3.5 Outlying aspects for objects 245 and 315 in Synth10D . . . 57
3.6 Runtime w.r.t. data set size. . . 61
3.7 Runtime w.r.t. data set dimensionality. . . 62
3.8 Runtime w.r.t. `. . . 62
3.9 Runtime w.r.t. outlyingness rank . . . 64
4.1 A set enumeration tree. . . 76
4.2 An example of an -neighborhood in a 2-dimensional subspace (within the dashed circle) . . . 80
4.3 Dimensionality distributions of top inlying contrast subspaces (k= 1) . . . 89
4.4 Dimensionality distributions of top outlying contrast subspaces (k= 1) . . . 90
4.5 Scalability test w.r.tδ (k= 10, α= 0.8) . . . 91
4.6 Scalability test w.r.t data set size (k= 10, δ= 0.01, α= 0.8) . . . 92
4.7 Scalability test w.r.t dimensionality (k= 10, δ= 0.01, α= 0.8) . . . 92
4.8 Relative runtime of CSMiner-BPR w.r.t k(δ= 0.01, α= 0.8) . . . 93
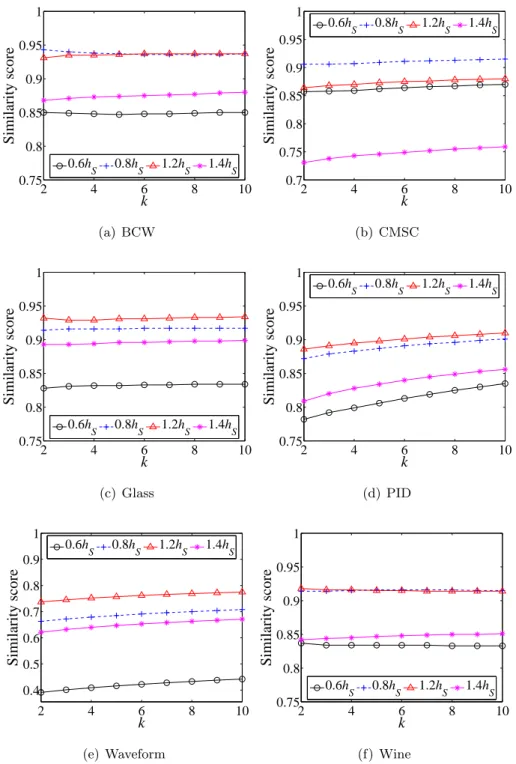
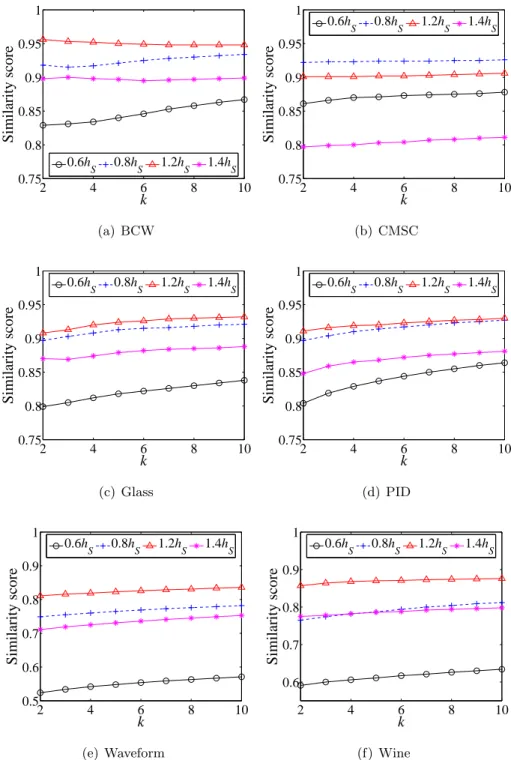
4.9 The similarity scores of inlying contrast subspaces using different bandwidth values with respect tok (δ = 0.001) . . . 96
4.10 The similarity scores of outlying contrast subspaces using different bandwidth values with respect tok (δ = 0.001) . . . 97
5.2 Names for the Parts of a Mushroom . . . 119
5.3 The number of contextual outliers / outlier objects w.r.t different ∆. The y-axis (# of contextual outliers / outlier objects) is in logarithmic scale. . . 121
5.4 The runtime of COD, COD− and BOD on the six real data sets (s = 10−3 inCOD). . . 123
5.5 The number of outliers of COD with respect to dimensionality. . . 124
5.6 The runtime of COD with respect to dimensionality (s= 10−3). . . 124
5.7 The number of outliers of COD with respect to number of tuples. . . 125
5.8 The runtime of COD with respect to number of tuples (s= 10−3). . . 125
5.9 The scalability of COD on synthetic data sets w.r.t. number of tuples . . . 127
6.1 Example of a Bayesian network [75] . . . 132
6.2 Framework of mining outliers in Markov blanket subspaces . . . 136
6.3 Examples of two Bayesian networks in Markov blanket subspaces . . . 137
6.4 Precision ofMiCOM against its rivals . . . 144
6.5 Recall of MiCOM against its rivals using Top 5 data objects based on outlierness scores . . . 144
6.6 Recall of MiCOM against its rivals using Top 15 data objects based on outlierness scores . . . 145
6.7 Running time of MiCOM against its rivals . . . 146
6.8 Running time of MiCOM against HiCS and BNOM using various data sizes 146 6.9 The scalability of MiCOM against 4S-S . . . 147 6.10 The number of the identified true positive outliers using top-kdata objects 148
Introduction
An outlier is a data object that is signicantly different from the rest of the data objects in a data set. Hawkins [53] provided a formal definition as following:
“An outlier is an observation which deviates so much from the other observations as to arouse suspicions that it was generated by a different mechanism.”
Outlier detection is the process of identifying data objects, which are drastically different from the rest of the data set. It is an important data mining task with broad applications, such as credit card fraud detection [18, 19], insurance claim fraud detection [109, 124], medical diagnosis [28, 97], image processing [30, 94], intrusion detection [73, 103], and event detection [26, 59].
Outlier detection has been studied extensively in the data mining research community. However, as the emergence of huge data sets in real-life practice nowadays, outlier detection faces a series of new challenges. Many traditional outlier detection methods do not work well in such an environment. Therefore, developing up-to-date outlier detection methods becomes urgent tasks. In this thesis, we aim at developing new outlier detection methods, which try to tackle some of the new challenges, specifically, dimensionality and under-standability.
• Dimensionality. How to find meaningful subspaces for outlier detection? Real-life data sets often have many dimensions, which may lead to a huge number of subspaces. Detecting outliers in every subspace is ineffective and inefficient mainly because of three reasons. First, in high-dimensional subspaces, data becomes sparse; and the similarities among data objects in full space become indistinguishable. The
true outliers are often covered up by the noises generated by the high dimensionality. Second, in order to assist business users to effectively analyze outliers, it is helpful to avoid reporting outliers from meaningless subspaces. Third, brute force methods, such as testing all data objects in all possible subspaces, are not feasible when a data set has a huge number of subspaces.
• Understandability. Understanding why the detected objects are outliers is important to business users. Outliers usually conveying useful information regarding different properties of the underlying data sets. Such information can help business users to propose suitable action plans for the outliers. In order to facilitate the un-derstandability of outliers, an outlier detection method needs to provide justifications of the detection, such as the contexts of the outliers.
1.1
Motivation
Our study propose four different outlier detection methods from two different perspectives, detecting the outlying aspects of a data object and detecting outlying data objects of a data set. In some application scenarios, using the appropriate outlier detection perspective can provide useful information.
Example 1.1. (Mining outlying aspects and outliers in healthcare applications). Despite the tremendous improvements in healthcare practice and systems nowadays, having sustainable healthcare is still one of the most important and urgent issues. From the individual point of view, healthcare is important to every one, even for those who are currently in good health. No one wants to get sick, but every one will get sick at some point of his life. From the global point of view, healthcare has a notable impact on a country’s economy. According to the well-known Canadian Institute for Health Information, the total spending on healthcare in Canada in 2013 was projected to exceed $211 billion, or $5,988 per person.
Healthcare has many outlier detection applications. In this example, we consider four different application scenarios from two different perspectives, identifying outlying aspects of individuals (Scenario 1 and Scenario 2) and detecting outliers under different circumstances (Scenario 3 and Scenario 4).
Scenario 1. Identifying Most Important Factors in Medical Treatment. Assume you are a medical doctor having many patients diagnosed with cardiovascular diseases. When facing a particular patient, you may want to know the most outlying (or dangerous) aspects of the patient, though the patient may not be top ranked on those aspects or on any other among all patients. After some analysis, you notice that the patient’s glycemic aspect, which includes triglyceride (“TG”) value: 420 mg/dL and low-density lipoprotein (“LDL”) value: 185 mg/dL, is outlying most. Reducing the risk factor values in glycemic aspect is very important to this patient. Based on the previous analysis, you probably make a treatment plan focusing on improving the patient’s current glycemic status, which includes medicines such as Statins and Fibrates, and suggestions of reducing the amount of “bad” fat in his diet and exercising more.
The scenario illustrated in the above example is different from traditional outlier detection. Specifically, instead of searching for outliers from a data set, here we are given a query object and want to find the outlying aspects whereby the object is most unusual. The query object itself may or may not be an outlier in the full space or in any specific subspaces. In this problem, we are not interested in other individual outliers or inliers. The outlying aspect finding questions cannot be answered by the existing outlier detection methods directly.
In Chapter 3, we will explore the novel and interesting problem of finding outlying aspects of a query object on multidimensional numeric data. We systematically developed a model and a heuristic method.
Scenario 2. Reduce Misdiagnosis by Providing Useful Information. The occurrence of medical errors, such as diagnostic error, is a serious problem. Tehrani et al. [100] pointed out that about 28.6% of the paid malpractice medical claims in US had been misdiagnosed.
Imagine you are a medical doctor facing a patient having symptoms of being overweight, short of breath, and some others. You want to check the patient on two specic possible diseases: coronary artery disease and adiposity. Please note that clogged arteries are among the top-5 most commonly misdiagnosed diseases [29]. You have a set of reference samples of both diseases. Then, you may naturally ask “In what aspect is this patient most similar to cases of coronary artery disease and, at the same time, dissimilar to adiposity?”
The above scenario cannot be addressed well using an existing data mining method, and thus suggests a novel data mining problem. In a multidimensional data set of two classes,
given a query object and a target class, we want to find the subspace where the query object is most likely to belong to the target class against the other class. We call such a subspace a contrast subspace since it contrasts the likelihood of the query object in the target class against the other class.
In Chapter 4, we will study the interesting problem of mining contrast subspaces to discover the aspects that a query object most similar to a class and dissimilar to the other class. A heuristic method with embedded pruning techniques is developed.
Scenario 3. Detect Fraud Suspects in Health Insurance. Fraud detection is an important task for business analysts in health insurance industry. According to the Canadian Health Care Anti-Fraud Association, about 2% to 10% of Canadian’s healthcare spending is lost to fraud every year [42].
Suppose you are a business analyst in the auditing department of a health insurance company. Your job is to identify frauds. You may not only want to find out all fraud suspects, but also the insightful reasons about why these people are suspicious. Par-ticularly, for a small group of fraud suspects, you may want to know in what aspects they share similarity with the majority of normal patients; and in what aspects they deviate dramatically from the normal patients.
A concrete example is: “Among the patients who consume narcotic drugs in the Greater Vancouver area, a small group of 10 patients purchasing narcotic drugs from more than 60 different pharmacies is an outlier group, comparing to a reference group of 3000 patients buying narcotic drugs from fewer than 5 different pharmacies.” The 10 patients in the outlier group have a high probability to submit fraud claims to the insurance company. Since among the patients who take narcotic drugs in the Greater Vancouver area, this small group of people have a very different purchase pattern from the majority.
In Chapter 5, we will we develop a notion of contextual outliers to solve the previous scenario. We systematically develop a model, including a concise representation, for contextual outlier analysis, and devise a detection algorithm that leverages the state-of-the-art data cube computation techniques.
Scenario 4. Discover Diseases and Related Factors in Medical Diagnosis. Assume you are a medical doctor having a set of patients’ medical records. Each record contains many different features of a patient, such as the patient’s age, weight, skin humidity, blood type, work place, lab test results, symptoms, and diagnosis history.
In order to find out patients who have serious illness and the possible causes of the illness, you may want to identify some patients who are very different from the others in a certain feature and its causal features. For example, a leukemia patient is usually very different from the others in features related to blood, such as complete blood count, blood chemistry tests, and bleeding and clotting factors. Other features such as “age” and “skin humidity” may be irrelevant for detecting this type of outlier, but are relevant for discovering the abnormal patients with the “dehydration” status.
In Chapter 6, we will explore the problem of detecting Markov blanket based outliers. Particularly, we develop a model to first select meaningful subspaces using Markov blanket. And then, the model will detect, characterize, and summarize outliers in the selected subspaces.
Example 1.1 demonstrates the great needs of detecting meaningful outlying aspects and outliers in practice. Traditional outlier detection techniques do not work well here. It is not only because of infamous “curse of dimensionality”, which reveals that the distances between all pairs of data objects are similar in high-dimensional spaces [15], but also because of the lack of contexts for the detected outliers. In real-life applications, a business analyst may want to see not only the outliers detected, but also the possible contexts about the outliers.
Besides the application scenarios mentioned in Example 1.1, detecting outlying aspects and outliers have many other applications, such as intrusion detection and image processing.
1.2
Challenges and Contributions
While being useful in many real-life applications, detecting meaningful outlying aspects and outliers pose special challenges.
• How to model the outlying aspects of a data object? Scenario 1 and Scenario 2 in Example 1.1 illustrate two different applications in mining outlying aspects of a data object. They not only show the great practical value of mining outlying aspects, but also raises a fundamental question: how can we formulate the outlying aspects of a data object that capture the most outstanding characteristics of the data object and suit application needs?
the outlyingness of an object in a subspace? Second, how to compare the outlyingness of an object in different subspaces?
• How to model meaningful outliers in multidimensional data sets? As shown in Scenario 3 and Scenario 4 of Example 1.1, context is an important component in outlier detection. Outliers usually convey useful information regarding different properties of the underlying data set. Proper contextual information of the outliers can help a business analyst to better understand and investigate individual outliers and propose action plans suitable for such outliers.
Therefore, we need to tackle two problems in developing meaningful outliers in multi-dimensional data sets. First, how to model outliers according to different application interests? Second, how to find contexts best manifesting the outlyingness of the detected outliers?
• How to explore the exponential number of subspaces in a multidimensional data set ef-ficiently? Given a data set withnattributes, there are 2n−1 non-empty subspaces. A
brute force method, which examines subspaces one by one, incurs heavy computational cost when the dimensionality is high. For example, on a data set of 100 dimensions, 2100−1 = 1.27×1030 subspaces have to be examined, which is unfortunately compu-tationally prohibitive using the state-of-the-art technology.
Thus, it is important to develop effective techniques, which can efficiently process the exponential number of subspaces of a multidimensional data set.
In this thesis, we propose several new methods for detecting different kinds of outliers in multidimensional data sets. In particular, we make the following contributions.
• We formulate the problem of detecting outlying aspects of a data object in both unsupervised data sets and supervised data sets. And we develop models to address the two application scenarios in Example 1.1, respectively.
In particular, for unsupervised data sets, we use the rank of the probability density of an object in a subspace to measure the outlyingness of the object in the subspace. For supervised data sets, we use the ratio of the likelihood of a query object in the target class against that in the other class as the outlyingness measure, which is essentially the Bayes factor [64] on the query object.
• For detecting meaningful outliers in multidimensional data sets, we develop two outlier detection methods to tackle the application Scenario 3 and Scenario 4 of Example 1.1. Specifically, we propose the problems of mining contextual outlier and mining Markov blanket based outlier.
We argue that the contextual information of an outlier is an important component in the outlier detection process. Thus, we integrate the task of identifying proper context information for outliers in both of the proposed methods.
• We develop a series of heuristic techniques to improve the efficiency of all methods proposed in this thesis. These techniques can be categorized into two categories: subspace pruning techniques and object pruning techniques.
Particularly, subspace pruning techniques are developed for the purpose of processing as fewer candidate subspaces as possible; while object pruning techniques are developed for the purpose of calculating as fewer candidate data objects in a subspace as possible.
Table 1.1 summarizes the four new outlier detection problems, their challenges, and our contributions presented in this thesis.
Outlying lev el Outlying asp ects Outliers General problem Giv en a data set and a query , find top-k subspaces th at mak e the query most outlyin g Giv en a data set, find all p ossible outlier data ob jects (or outlier data ob ject grou ps) and their corresp onding con texts Data typ e Numeric data Categorical data What to find Outlying subspace Con trast subspace Con textual outlier Mark o v blank et based outli e r Application scenarios Scenario 1 Scenario 2 Scenario 3 Scenario 4 Ma jor challenges Measuring and comparing the outlyingness of an ob ject in differen t subspaces Measuring the con trast of the similarit y b et w een the query ob je ct and the target class and the difference b et w een the query ob ject and the other class Mo deling meaningful con texts for outliers Selecting meaningfu l subspaces for outlier detection, assessing and characterizing outliers in differen t subspaces Ma jor con-tributions • Using rank statistics of the probabilit y d e n si ty of an ob ject to measure and compare the out-lyingness of an ob ject in differen t subspaces. • Dev eloping efficien t detection algorithm. • Using the ratio of the lik eliho o d of the query ob je ct in the target class against that in the other class as the measure. • Pro ving MAX SNP-hardness of the problem. • Dev eloping efficien t detection algorithm. • Dev eloping a noti on of m ultidimensional con textual outliers to mo del the con texts of an outlier. • Pro viding an alys is to reduce redundancy among outliers. • Designing a simple, y et effectiv e algorithm. • Using Mark o v blank et based metho d to select meaningful sub sp ac es for outlier detection. • Designing an outlier score based on the join t prob-abilities of lo cal Ba y esian net w o rks learned from the selected sub sp ac es. • Characterizing outliers b y using the subspaces th at maximize the outlier score. Chapter Chapters 3 Chapters 4 Chapters 5 Chapters 6
1.3
Organization of the Thesis
The rest of the thesis is organized as follows.• In Chapter 2, we review the related work and explain how they are related to and different from this thesis.
• In Chapter 3, we propose a novel problem of mining outlying aspects on numeric data, which finds the subspaces best manifesting the unusualness of a specified query object, using the other objects as the background in comparing different subspaces. This problem is related to, but critically different from traditional outlier detection. Specifically, instead of searching for outliers from a data set, here we are given a query object and want to find the outlying aspects whereby the object is most unusual. The query object itself may or may not be an outlier in the full space or in any specific subspaces.
• In Chapter 4, we study the problem of mining contrast subspaces on numeric data. In a multidimensional data set of two classes, given a query object and a target class, we want to find the subspace where the query object is most likely to belong to the target class against the other class. While there are many existing studies on outlier detection and contrast mining, they focus on collective patterns that are shared by many cases of the target class. The contrast subspace mining problem addressed here is different. It focuses on one query object and finds the customized contrast subspace. This problem is a supervised version of the problem we proposed in Chapter 3. • In Chapter 5, we propose the framework of detecting contextual outliers on categorical
data. A notion of contextual outliers is introduced to model the context of an outlier. Intuitively, a contextual outlier is a small group of objects that share strong similarity with a signicantly larger reference group of objects on some attributes, but deviate dramatically on some other attributes. We presented a detection algorithm leveraging the state-of-the-art data cube computation techniques.
• In Chapter 6, we propose the frame work of detecting Markov blanket based outliers on categorical data. Given a data set, we regard the Markov blanket of each dimension and the dimension itself as a Markov blanket subspace. Markov blanket based outliers are outlying data objects, which are detected from the Markov blanket subspaces. The
experimental results using synthetic and real-world data validate the effectiveness, efficiency and scalability of the proposed model.
Related Work
Outlier analysis is a well studied subject in data mining. Several recent surveys on the topic [1, 4, 24, 57, 78, 79, 92, 125, 126] as well as dedicated chapters in classical data mining textbooks [50] provide thorough treatments.
In this chapter, we review the existing studies related to this thesis. First, we review some of the state-of-art methods on traditional outlier detection. Then, we review the recent studies on subspace outlier detection. Last, we discuss the related work on each of the proposed problems in this thesis.
2.1
Traditional Outlier Detection Method
Given a set of data objects, traditional outlier detection focuses on finding outlier objects that are significantly different from the rest of the data set in the full attribute space.
A number of outlier detection methods have been proposed. We categorize them into three categories according to how outliers are defined, namely, statistical methods, proximity-based methods, and clustering-based methods.
2.1.1 Statistical methods
Statistical methods [38, 41, 61, 104, 123] assume that data objects in a given data set are generated by a certain statistical model. Outliers are data objects that significantly deviate from the statistical model. Statistical methods usually contain two steps. First, assume (or train) a distribution (or a probabilistic) model based on the given data set. Then, test
if a data object is significantly deviating from the assumed (or trained) model. If yes, the tested data object is an outlier. Based on whether the assumption of data distribution is made or not, statistical methods can be categorized into two categories, namely, parametric method and non-parametric method.
Parametric methods [45, 104, 106, 123] assume data is generated by certain distribution (or probabilistic) models. For example, in early 1930s, Shewhart [104] proposed to apply a simple outlier detection technique to the quality control process. Particularly, he first assumed that all data objects were following the Gaussian distribution. Then, any data object that is more than 3σ distance away from the mean µ is an outlier, where σ is the standard deviation of the Gaussian distribution.
Later, mixture probabilistic models [45, 123] are used to deal with more complex forms of data distribution. For instance, Yang et al. [123] proposed to use the Expectation-Maximization (EM) algorithm [33] to fit a Gaussian Mixture Model (GMM) with Gaussians centered at each data object to a given data set. Each mixture proportion represents the degree of a data object being a cluster center. The outlier score of each data object is defined as a weighted sum of the mixture proportions with weights representing the similarities to other data objects. The smaller the outlier score of a data object, the more likely it is an outlier.
Non-parametric methods [56, 61, 88] do not assume any priori data distribution (or probabilistic) models. For example, Javitz and Valdes [61] proposed a histograms based method for intrusion detection. Histograms were constructed to represent the profile of normal behaviors. A testing behavior is a potential intrusion if it does not fall into any of the bins in the constructed histograms.
Besides the histograms technique, kernel function is another popular technique used under this theme. For instance, Palpanas et al. [88] proposed a framework to detect outliers in a sensor network. In essence, they used kernel density estimator [102] to estimate the expected distribution of normal values generated by a sensor at a certain time. Epanechnikov kernel was adopted. Given a timet, an observed value is outlying if it does not fall into a certain range of the values in the expected distribution. A sensor is an outlier if it generated more than nsuch outlying values within a certain time period.
The effectiveness of statistical methods heavily rely on whether the given data set fits the chosen statistical model or not.
2.1.2 Proximity-based methods
Proximity-based methods [20, 27, 66, 96, 108] assume that outliers are data objects isolated from the rest of the data set. In other words, the proximity of an outlier object to its neighbors is very different from that of a normal object. Based on the choice of proximity measurements, proximity-based methods can be further divided into two categories, namely, density-based methods and distance-based methods.
Density-based methods [20, 27, 108] assume that the density or relative density around an outlier object is substantially different from that around its neighbors. For instance, Breunig et al.[20] proposed the famous Local Outlier Factor (LOF) algorithm. The basic idea of LOF is to use the relative density of a data object against its neighbors as the indicator of the outlyingness degree of the data object. Specifically, given a data object p
and the number of data objects in the local neighborhood of a data object M inP ts, the reachability distance of p with respect to data object o, denoted by reach-distM inP ts(p,o),
is the maximum value between the distance frompto its farthest neighbor in p’sM inP ts -neighborhood and the distance from p to o. The local reachability density of p is defined as
lrdM inP ts(p) = 1/
P
o∈M inP ts(p)reach-distM inP ts(p,o)
|NM inP ts(p)|
,
where |NM inP ts(p)| is the number of data objects falling into p’s M inP ts-neighborhood.
And theLOF of p in a given data set is defined as
LOFM inP ts(p) = P o∈M inP ts(p) lrdM inP ts(o) lrdM inP ts(p) |NM inP ts(p)| .
A data object is likely to be an outlier if it has a LOF score that is significantly greater than 1.
Subsequently, many density-based outlier detection techniques have been developed based on the idea of LOF. For instance, Chiu and Fu [27] proposed a method named
GridLOF. GridLOF uses a simple grid-based technique to prune non-outlier objects, such that the computation of LOF for all data objects can be avoided. Another interesting variant ofLOF is the connectivity-based outlier factor (COF) proposed by Tanget al.[108], which aims to improve the effectiveness of LOF when a potential outlier has similar local neighborhood density as that of its neighbors.
Distance-based methods [9, 14, 46, 66, 96, 120] assume that data objects which are far away from their neighbors have high probabilities to be outliers. Knorr and Ng [66] firstly
introduced the notion of distance-based outlier [1]. Given a radius εand a percentage p, a data objectois a outlier if at leastp% of all other data objects have a distance toogreater thanε.
Later, this distance-based outlier notion [66] has been extended based on the distance of a data object to its kth nearest neighbor, which is known as the nearest neighbour (k-NN) method. For example, given a data set, Ramaswamyet al.[96] considered data objects with the top-khighestDks as outliers. TheDkof a data objectois the distance betweenoand its
kth nearest neighbor. The distance between two data objects can be measured by different
distance metrics, such as manhattan distance, euclidean distance, and so on. In this paper, the authors use the square of the euclidean distance instead of the euclidean distance itself, for the sake of reducing computational costs. Angiulli and Pizzuti [9] provided another way of defining thek-NN distance based outliers. Specifically, the outlier score of a data object
o is defined as the sum of the distances fromo to all itsk nearest neighbors. The outliers are data objects with top-khighest outliers scores. Many methods [14, 46, 120] have been developed to improve the efficiency of the distance-based outlier detection methods.
The effectiveness of proximity-based methods highly depend on the proximity measure adopted.
2.1.3 Clustering-based Methods
Clustering-based methods identify three different cases of outliers: (1) outliers are data objects that do not belong to any cluster; (2) outliers are data objects which are far away from their closest cluster centroid; (3) outliers are data objects that belong to very small and distant clusters.
Methods for detecting data objects that do not belong to any cluster. Clustering algorithms [39, 37, 48] that do not require every data object belonging to at least one cluster can be naturally applied here. Take the well knownDBSCAN algorithm proposed by Ester et al. [39] as an example. Given a neighborhood radius ε and the minimum number of data objects contained in the neighborhood M inP ts, DBSCAN check the ε -neighborhood for each data object. If a data object o has more than M inP ts objects in its ε-neighborhood, a new cluster is formed, and o is the core of this cluster. All data object ino’sε-neighborhood are added to this cluster, as well as their own ε-neighborhood only if the ε-neighborhood also have more than M inP ts objects. The cluster grows when no more core object can be found. Then, a new unvisited data object will be chosen to
repeat the previous process. The whole clustering will stop when no more new object can be added into any cluster. As a result, data objects that do not belong to any cluster can be considered as outliers.
Methods to tackle the second and third cases often have two phases, namely, the clustering phase and the testing phase. In the clustering phase, clustering algorithms such as k-means [76] or DBSCAN [39], are applied to identify clusters or dense regions. The testing phase computes the outlyingness scores for data objects. Assume o is an arbitrary data object in a given data set. People usually consider the following three aspects when designing the outlyingness score: (1) the fitness ofofor the clusters identified in clustering phase; (2) the sizes of the clusters that obelongs to; (3) the distances between the clusters thato belongs to and the other clusters.
Methods for detecting data objects which are far away from their closest cluster centroid.
Many methods [12, 71, 95] designed for intrusion detection are under this assumption. Barbar´a et al. [12] proposed a bootstrap outlier detection method by considering the similarity between data points and the clusters in a training data set. The authors rst separated normal data from abnormal data in the training data set by frequent itemsets based method. Then, normal data in the training data set were clustered into groups. Last, testing whether a data point is an outlier with respect to the clusters from the previous step.
Methods for detecting data objects that belong to very small and distant clusters. Various methods [54, 63, 87] proposed under this theme. For example, Jiang et al.[63] proposed a two-step clustering process to detect outliers belonging to very small and distant clusters. In the first step, a modified k-means algorithm is applied to find clusters. This algorithm uses a heuristic that a new data object is the center of a new cluster if it is far away from the centers of all existing clusters. The modified k-means algorithm produces clusters in a coarse way by allowing the number of clusters to be greater than k. Note that k is the number of cluster set by the user. In the second step, each cluster is represented by its center node; and a minimum spanning tree (MST) is constructed based on the distance between every two nodes. The longest edge of the MST is removed; and the MST is replaced by the two newly obtained subtrees. We can repeat the process of removing the longest edges of the subtrees untilk subtrees have been obtained. Outliers are data objects that belong to the clusters in the smallest subtree.
clustering algorithms can capture the true clustering structure of normal objects or not.
2.2
Subspace Outlier Detection Methods
Data sets from real life often have very high dimensionalities. Due to the curse of di-mensionality, measurements designed to calculate the differences between an object and the other objects, such as distance and probability density, become meaningless in the full space [16]. Thus, many conventional outlier detection techniques may not work well in such situation. Identifying outliers in various subspaces becomes a possible approach to solve practical outlier detection problems like this.
Given a set of high dimensional data objects, subspace outlier detection techniques aim to identify outlier objects, which are drastically deviating from the majority in some selected subspaces.
Most studies in subspace outlier detection have two major components, subspace selection and outlyingness measurement design. Many subspace selection methods have been proposed based on the different assumptions of meaningful subspaces. For example, Keller et al. [65] and B¨ohm et al. [17] selected subspaces with high contrast by statistical approaches. Another example is that Kriegel et al. [68] explored the outlyingness of a data object in a subspace made up by its nearest neighbors. Similar to the traditional outlier detection, various outlyingness measurements are designed for different purposes. For instance, M¨ulleret al.[81] designed the outlier score of a data object based on the size and the dimensionality of the corresponding reference cluster. Some studies [17, 65, 85] directly adopted the existing outlyingness measurement from the traditional outlier detection.
For example, Kriegel et al.[67] introducedSOD, a method to detect data objects that do not fit well into their axis-parallel subspaces. Given a data object o, the axis-parallel subspace of o is a subspace spanned by o’s reference points. The reference points of o are modeled as a set of data objects, each of which shares at least nof its k-nearest neighbors with that ofo. Note thatnandkare two user input parameters. nis the minimum number of nearest neighbors that a reference point and ohave in common; andk is the number of nearest neighbors that a data object needs to consider. The outlier score of o is designed based on two elements: (1) the distance between o and the mean values of the reference points in each dimension; (2) the variance of reference points in each dimension.
contribution of some selected subspaces where an object deviates from its neighborhood (modeled as the closest cluster). The selected subspaces are chosen to provide a large contrast between the object and its immediate neighborhood (modeled as a set of objects within a specified radius. The chosen radius is subspace dependent). For a chosen object,
OUTRES computes an aggregate outlier score that incorporates only the contribution of subspaces where the object has significantly low density (more than two standard deviations from the mean). The challenge of calibrating density measures in different subspaces is tackled by using an adaptive neighborhood which grows according to the number of features in the subspace.
The effectiveness of techniques in subspace outlier detection depend on both the quality of the selected subspaces and the fitness of the adopted outlyingness measurements.
2.3
Related Work to the Proposed Problems
In this section, we review the related work for each of the proposed problems, and briefly point out their relationships to our studies and the significant differences.
2.3.1 Mining Outlying Subspaces
The mining outlying subspaces problem is mainly related to the existing work on outlying property detection and subspace outlier detection. In this section, we review the previous studies and show the signicant differences.
Outlying Property Detection
Given a data set, outlying property detection problem discovers the properties, which distinguish an outlier from the normal data objects in the data set. To the best of our knowledge, [7, 8, 80] are the only studies on finding explanation of outlying aspects, and are most relevant to our problem of mining outlying subspaces.
Given a multidimensional categorical database and an outlier, Angiulli et al.[7] found the top-k subsets of attributes (i.e., subspaces) from which the outlier receives the highest outlyingness scores. The outlyingness score for a given object in a subspace is calculated based on the frequency of the value that the outlier takes in the subspace. It tries to find subspaces E and S such that the outlier is frequent in one and much less frequent than
expected in the other. Searching all such rules is computationally costly. To reduce the cost within a manageable scope, the method takes two parameters, σ and θ, to constrain the frequencies of the given object in subspaces E and S, respectively. Therefore, if a query object is not outlying compared to the other objects, no outlying properties may be detected. Angiulliet al. [8] provide a version of numeric data for this problem.
Micenkov´aet al.[80] proposed a method to find a subspace as possible explanations for a detected outlier. Particularly, given a data set and an outlier, this method sampled a subset of the original data based on the outlier for classification. Subset feature selection methods were used to select candidate explanation subspaces. Classification accuracy was used to measure the outlierness of a data object. A candidate subspace where the outlier has the highest outlierness score will be selected as the explanation subspace.
How is our work different? There are several essential differences between [7, 8] and this study. First, the problems in [7, 8] find contextual rule based explanations, while our method returns individual subspaces where the query object is mostly outlying comparing to the other subspaces. The meaning of the two types of explanation is fundamentally different. Second, Angiulli et al. [7] focuses on categorical data, and our method targets on numeric data. Although [8] considers numeric data, its mining target is substantially different from this work. Specifically, given a set of objects O in a multi-dimensional space
Dand a query objectq∈O, [8] finds the pairs (E, d) satisfyingE ⊆Dandd∈D\E, such that there exists a subsetO0⊆O, includingq, in which objects are similar onE(referred to asexplanation), whileqis essentially different from the other objects inO0 ond(referred to as property). Besides one-dimensional attributes, our method can find outlying subspaces with arbitrary dimensionality.
Micenkov´aet al.[80] is also very different from our study. First, they require a detected outlier to be the input query; while we do not. Second, their method only finds one subspace; while our method finds top-k subspaces. Third, they use the classification accuracy to measure the outlierness; while we use density rank as outlierness measure.
Subspace Outlier Detection
Subspace outlier detection aims to detect data objects, which are drastically deviating from the majority in some subspaces. Detailed literature review can be found in Section 2.2.
How is our work different? The problem settings of outlying subspaces mining and subspace outlier detection are different. In outlying subspaces mining, we focus on the
following question. Given a query object o in a multidimensional numeric data set O, in which subspace isomost outlying? Note that the query itself may or may not be an outlier. Recently, some subspaces outlier detection studies attempt to use the selected subspaces as explanations to demonstrate the outlying properties of outliers. The explanations may be a byproduct of outlier detection. For example, B¨ohm et al. [17] and Keller et al. [65] proposed statistical approaches CMI and HiCS to select subspaces for a multidimensional database, where there may exist outliers with high deviations. Both CMI and HiCS are fundamentally different from our method. They choose highly contrasting subspaces for all possible outliers in a data set, while our method chooses subspaces based on the query object. Kriegel et al. [67] introduced SOD, a method to detect outliers in axis-parallel subspaces. There are two major differences betweenSOD and our work. First,SOD is still an outlier detection method, and the hyperplane is a byproduct of the detection process. Our method does not detect outliers at all. Second, the models to identify the outlying subspaces in the two methods are very different. When calculating the outlyingness score,SOD only considers the nearest neighbors as references in the full space. Our method considers all objects in the database and their relationship with the query object in subspaces.
Other Data Mining Techniques
To some extent, outlyingness is related touniqueness and uniqueness mining. Paravastuet al. [90] discovered the feature-value combinations that make a particular record unique. Their task formulation is reminiscent of infrequent itemset mining, and uses a level-wise Apriori enumeration strategy [3]. It needs a discretization step. Our method is native for continuous data.
Our method uses probability density to measure outlying degree in a subspace. There are a few density-based outlier detection methods, such as [20, 69, 55, 2]. Our method is inherently different from those, since we do not find outlier objects at all.
2.3.2 Mining Contrast Subspaces
The problem of mining contrast subspaces is related to the existing work on contrast mining, subspace outlier detection and typicality queries. We briefly review previous works and show the difference in the following.
Contrast mining
Contrast mining discovers patterns and models that manifest drastic differences between datasets. Dong and Bailey [35] presented a comprehensive review of contrast mining, together with a range of real-life applications. Some of the best known types of contrast patterns include emerging patterns [36], contrast sets [13] and subgroups [119]. Although their definitions vary, the mining methods share many similarities [86].
How is our work different? Contrast pattern mining identifies patterns by considering all objects of all classes in the complete pattern space. Orthogonally, contrast subspace mining focuses on one object, and identifies subspaces where a query object demonstrates the strongest overall similarity to one class against the other. These two mining problems are fundamentally different. To the best of our knowledge, the contrast subspace mining problem has not been systematically explored in the data mining literature. Though Chen and Dong [25] presented a contrast-pattern length based algorithm to detection global outliers, their problem setting is different from ours.
Subspace Outlier Detection
As reviewed in Section 2.2, subspace outlier detection discovers objects that significantly deviate from the majority in some subspaces.
How is our work different? In contrast subspace mining, the query object may or may not be an outlier. We are trying to find the top-k subspaces, in which a query object is the most typical in the current class and is very unlikely to occur in other classes.
Some recent studies find subspaces that may contain substantial outliers. Keller et al. [65] and B¨ohm et al. [17] proposed statistical approaches HiCS and CMI to select subspaces for a multidimensional database, where there may exist outliers with high deviations. BothHiCSandCMI differ from our method. Technically, they choose subspaces for all outliers in a given database, while our method chooses the most contrasting subspaces for a query object. In HiCS and CMI, contrast refers to the differences between the as-sumptions on whether the subspaces are mutually independent or not. In our work,contrast
Typicality Queries
Given a data set and a query object, typicality queries focus on the problem of finding the most typical data objects according to the query. Hua et al.[58] introduced a novel top-k
typicality query, which ranks objects according to their typicality in a data set or a class of objects. Density estimation based methods are used to calculate the typicality of a query object with respect to a set of data objects. Caiet al.[21] proposed a method that adopted concepts from human cognition, to answer the top-k typicality queries. The typicality of an object with respect to a set of data objects was calculated based on the similarity and support of the object with respect to the set of data objects.
How is our work different? The problem settings are different. Works in typicality query [58, 21] aim to find the most typical data objects according to the query object; in contrast subspace mining, we find the most contrasting subspaces for a query object. Although both [58] and our work use density estimation methods to calculate the typicality/likelihood of a query object with respect to a set of data objects, typicality queries [58] do not consider subspaces.
2.3.3 Mining Contextual Outliers
In this section, we briefly review the previous works on contextual outlier detection, rule-based outlier detection and some other data mining techniques related to the proposed contextual outlier detection problem. We show the relationships and differences between the existing works and the proposed problem.
Contextual Outlier Detection
Given a set of data objects, contextual outlier detection focuses on finding outlier objects under some specific circumstances. A contextual outlier usually associates with a set of contextual attributes and a set of behavioral attributes. Contextual attributes define the context of the outliers; while behavioral attributes are used to determine outliers. For example, “a temperature of 30◦C in winter in Vancouver” is an outlier. “winter” and “Vancouver” are the contextual attributes; and “a temperature of 30◦C” is the behavioral attribute. Contextual outliers are also known as conditional outliers [107].
Song et al. [107] proposed the notion of conditional outliers to model the outliers manifested by a set of behavioral attributes (e.g. temperature) conditionally depending
on a set of contextual attributes (e.g. longitude and latitude). The behavioral attributes and the contextual attributes are pre-defined.
Li et al. [116] introduced a hypergraph-based outlier detection test (HOT) to identify outliers and their contexts. Given a dataset and a minimum support threshold, a hypergraph is built based on the frequent itemsets in the dataset. Particularly, a vertex is a data object; and a hyperedge denotes a group of objects containing frequent itemsets. A deviation score has been designed to calculate the outlyingness of a data object in a certain attribute with respect to a hyperedge. Given a deviation threshold θ, a data object o is an outlier in attributeA with respect to a hyperedgehe, if the deviation score of oinAwith respect to
he is lower thanθ.
There are a few other contextual outlier detection studies, which detection outliers and their corresponding contexts from different angles. For example, Valkoet al.[111] detected conditional anomalies using a training set of labeled examples with possible label noise. And Wang and Davidson [114] used random walks to find context and outliers.
How is our work different? The contextual outlier mining problem proposed in this thesis is different from the existing studies in problem settings and solutions. For example, in [107], both the behavioral attributes and the contextual attributes have to be predefined; in contrast, our method can automatically identify these attributes. Take HOT [116] as another example. There are two major differences between HOT and our method. First, the detected outliers are very different. Outliers detected by HOT are single data objects (vertexes). Outliers detected by our methods are group-by tuples (hyperedges). Second, outlying attributes are different. An outlying attribute detected byHOT only contains one attribute; while an outlying subspace detected by our method can have several attributes. Thus, the problem and the framework proposed by our work are more general than the ones proposed byHOT.
Rule-based Outlier Detection
Rule-based outlier detectionlearns rules, which can represent the normal behaviors of a given data set. A data object is an outlier if it does not follow any of the learned rule. There are a number of methods [41, 23, 77, 84, 117] using rules in outlier detection. A contextual outlier (r, o) identified in our method can be written as a pair of rules: cond(r, o)⇒avs(r)−
cond(r, o) for the reference group, andcond(r, o)⇒avs(o)−cond(r, o) for the outlier group.
important aspects. First, most of the existing rule-based methods focus on detecting individual outliers, and may not be able to identify outlier groups and measure the out-lyingness accordingly. Second, many existing rule-based methods use rules to model only the normal objects or strong associations. Outliers are individual objects that do not follow those rules. Those methods do not model and analyze context explicitly. Lastly, many existing methods, such as [31, 74, 117], set strict constraints on the size of the rules or the aggregate groups to be considered, such as a very small number of items/attributes allowed in a rule or only the parents and their sibling groups.
Other Data Mining Techniques
Our study is also related to the previous work on emerging pattern mining ([36] and the consequent studies) andcontrast mining (see [34] and the references there). Conceptually, mining contextual outliers can be regarded as mining the non-redundant set of emerging patterns in all possible subspaces and under all possible shared AVSs as the constraints. Chen and Dong [25] provided an emerging pattern length based outlier detection method, but it is limited to global outliers. To the best of our knowledge the contextual outlier detection problem has not been systematically explored in the emerging/contrast pattern mining area.
More broadly, our study uses related concepts and techniques in data cube computation [47, 16] and formal concept analysis [44]. However, to the best of our knowledge, no previous study systematically integrates the techniques to tackle the contextual outlier detection problem.
2.3.4 Mining Markov Blanket Based Outliers
The problem of mining Markov blanket based outliers is related to the existing work on subspace outlier detection and Bayesian network based outlier detection. We briefly review previous works and show the difference in the following
Subspace Outlier Detection
As mentioned before, a brief literature review ofsubspace outlier detection can be found in Section 2.2.
How is our work different? We adopt a novel subspace search approach for the subspace selection, which can significantly reduce the computational cost in subspace selection.
Most existing subspace outlier detection algorithms have prohibitive computational costs in subspace selection. For example, some state-of-the-art subspace outlier detection algorithms, such as OUTRES [83], HiCS [65] and CMI [17], employ an Apriori-style subspace search scheme. Given a data set with n attributes, an Apriori-style subspace search scheme has 2n−1 possible candidate subspaces, and thus incurs very expensive com-putational cost. Recently, Nguyen et al. [85] proposed the 4S algorithm to mitigate the problem of exponential runtime. Instead of a levelwise subspace search strategy, the 4S
algorithm computes the correlation of each pair of dimensions and transforms the top K
pairs with the largest correlations to an undirected correlation graph. Then, 4S performs a direct mining of correlated subspaces in the graph. The 4S algorithm still needs to explore an exponentially large number of candidate subspaces.
We use the concept of Markov blankets in Bayesian networks for the subspace selection. Particulary, given a data set with n attributes, we find outliers from only n subspaces selected by a Markov blanket based method, instead of 2n−1 arbitrary subspaces.
Bayesian Network Based Outlier Detection
Bayesian network based outlier detection usually builds a Bayesian network [93] over a full feature space first. And then, for a testing data object, it uses the learned Bayesian network to estimate the posterior probability of being an outlier for the testing data object. A number of works in outlier detection use this method, such as [10, 22, 118].
For example, Wong et al. [118] proposed a Bayesian network based outlier detection technique for the disease outbreak detection. Given a database with Emergency Department (or “ED” for short) records, all attributes are divided into two groups by domain experts, namely, environmental set and indicator set. Environmental set is a group of attributes, which can form the trends of disease outbreaks. The rest attributes are put into the indicator set. The Bayesian network, which is used to represent the baseline distribution, is conditioned on forming relation only between attributes belonging to environmental set to attributes in the indicator set. The distribution of the testing data is compared against the baseline distribution to identify outlying patterns that may cause disease outbreaks.
How is our work different? Our method detects subspace outlier, which is different from most of the existing works in Bayesian networks outlier detection. Methods in most existing
Bayesian networks outlier detection search outliers in a single space of given attributes, and are unable to detect outliers hidden in subspaces.
Mining Outlying Aspects
When we are investigating an object in a data set, which itself may or may not be an outlier, can we identify unusual (i.e., outlying) aspects of the object?
In this chapter, we identify the novel problem of mining outlying aspects on numeric data. Given a query objectoin a multidimensional numeric data setO, in which subspace is omost outlying? Technically, we use the rank of the probability density of an object in a subspace to measure the outlyingness of the object in the subspace. A minimal subspace where the query object is ranked the best is an outlying aspect. Computing the outlying aspects of a query object is far from trivial. A na¨ıve method has to calculate the probability densities of all objects and rank them in every subspace, which is very costly when the dimensionality is high. We systematically develop a heuristic method that is capable of searching data sets with tens of dimensions efficiently. Our empirical study using both real data and synthetic data demonstrates that our method is effective and efficient.
3.1
Motivation
In many application scenarios, a user may wish to investigate a specific object, in particular, the aspects where the object is most unusual compared to the rest of the data. In addition to the application Scenario 1 of the Example 1.1, there are quite a few interesting applications of outlying aspects mining in practice.
For example, when a commentator mentions an NBA player, the commentator may want to name the most distinguishing features of the player, though the player may not be top ranked on those aspects or on any others among all players. Take the technical statistics of
the 220 guards on assist, personal foul and points/game in the NBA Season 2012-2013 as an example (Figure 3.1), an answer for Joe Johnson may be “the most distinguishing feature of Joe Johnson is his scoring ability with respect to his performance on personal foul”. Note we collect the NBA Season 2012-2013 statistics from http://sports.yahoo.com/nba/stats.
0 2 4 6 8 10 12 0 1 2 3 4
Assist
Personal foul
Joe(a) Assist w.r.t personal foul
0 2 4 6 8 10 12 0 5 10 15 20 25 30
Assist
Points/game
Joe (b) Assist w.r.t points/game 0 1 2 3 4 0 5 10 15 20 25 30Personal foul
Points/game
Joe(c) Personal foul w.r.t points/game
Figure 3.1: Performance of NBA guards on assist, personal foul and points/game in the 2012-2013 Season (the solid circle (•) represents Joe Johnson)
As another example, when evaluating an applicant to a university program, who herself /himself may not necessarily be outstanding among all applicants, one may want to know the strength or weakness of the applicant, such as “the student’s strength is the combination of GPA and volunteer experience, ranking her/him in the top 15% using these combined
aspects”. Moreover, in an insurance company, a fraud analyst may collect the information about various aspects of a claim, and wonder in which aspects the claim is most unusual. Furthermore, in commercial promotion, when designing an effective advertisement, it may be useful for marketers to know the most distinctive set of features characterizing the product. Similar examples can easily be found in other analytics applications.
The questions illustrated in the above examples are different from traditional outlier detection. Specifically, instead of searching for outliers from a data set, here we are given a query object and want to find the outlying aspects whereby the object is most unusual. The query object itself may or may not be an outlier in the full space or in any specific subspaces. In this problem, we are not interested in other individual outliers or inliers. The outlying aspect finding questions cannot be answered by the existing outlier detection methods directly.
We emphasize that investigating specific objects is a common practice in anomaly and fraud detection and analysis. Specifying query objects is an effective way to explicitly express analysts’ background knowledge about data. Moreover, finding outlying aspects extends and generalizes the popular exercise of checking a suspect of anomaly or fraud. Currently, more often than not an analyst has to check the features of an outlying object one by one to find outlying features, but still cannot identify combinations of features where the object is unusual.
We address several technical challenges and make solid contributions on several fronts. First, we identify and formulate the problem of outlying aspect mining on numeric data. Although [7, 8] recently studied detecting outlying properties of exceptional objects, their methods find contextual rule based explanations. We discuss the differences between our model and theirs in detail in Section 2.3.1 in Chapter 2. As illustrated, outlying aspect mining has immediate applications in data analytics practice.
Second, how can we compare the outlyingness of an object in different subspaces? While comparing the outlyingness of different objects in the same subspace is well studied and straightforward, comparing outlyingness of the same object in different subspaces is subtle, since different subspaces may have different scales and distribution characteristics. We propose a simple yet principled approach. In a subspace, we rank all objects in the ascending order of probability density. A smaller probability density and thus a better rank indicates that the query object is more outlying in the subspace. Then, we compare the rank statistics of the query object in different subspaces, and return the subspaces of the best rank as