ISSN: 2522-2465 (Online)
Indexing/Abstracting
Economic Value Added or Earnings per Share? An Incremental Content Analysis
Author: Maham Ejaz1 Rubeena Tashfeen2c Kinza Younas3
Abubaker Naeem4
Affiliation:
1Lecturer, Government College University, Faisalabad,
Pakistan
2Associate Professor, University of Management &
Technology, Lahore, Pakistan.
3Research Associate, Department of Finance , University
of Management and Technology , Lahore, Pakistan
4PhD. Scholar, Massey University, New Zealand c Email: [email protected]
Submission: December 16, 2017 Acceptance: November 22, 2018
Article Information:
To cite this document
Ejaz, M., Tashfeen, R., Younas, K., & Naeem, A. (2018). Economic Value Added or Earnings per Share? An Incremental Content Analysis. Empirical Economic Review, 1(2), 63-90.
The online version of this manuscript is available at https://journals.umt.edu.pk/sbe/eer/volume1issue2.aspx DOI: https://doi.org/10.29145/eer/12/010204
Additional Information
For Subscriptions Email: [email protected] For further information, please visit
http://journals.umt.edu.pk/sbe/eer/Home.aspx Published by Department of Economics University of Management and Technology Lahore, Pakistan
This manuscript has been published under the terms of Creative Commons Attribution-ShareAlike 4.0 International
License (CC-BY SA). EER under this license lets others distribute, remix,
tweak, and build upon the work it publishes, even commercially, as long as
the authors of the original work are credited for the original creation and the
Contributions are distributed under the same license as original.
Economic Value Added or Earnings per Share? An
Incremental Content Analysis
Maham Ejaz 1
Rubeena Tashfeen 2 Kinza Younas 3 Abubaker Naeem 4
Abstract
The primary objective of the study is to determine the relative and incremental information content of Economic Value Added (EVA) as compared to the traditional accounting measure of Earnings per Share (EPS). The study employs the methodology derived from Easton and Harris (1991). The study sample comprises 30 largest listed non-financial firms on Pakistan Stock Exchange (PSX) and covers the period from 2005-2014. The findings indicate that EPS outperforms EVA in capturing the market trends of stock return performance. The results of the research negate the common notion of EVA as a superior measure of firm performance. Although, evidence obtained from empirical tests illustrates that EVA provides marginal incremental information combined with EPS, but it is low. The study offers academicians, practitioners and investors a more accurate measure by which to assess performance in the markets. Keywords: Economic Value Added (EVA), Earnings Per Share (EPS), Market Value Added (MVA), Pakistan Stock Exchange (PSX)
JEL Classifications: G10, G11, G14, G19
1Lecturer, Government College University, Faisalabad, Pakistan. Email: [email protected]
2 Associate Professor, University of Management & Technology, Lahore, Pakistan.
Email: [email protected]
3 Research Associate, Department of Finance, University of Management and Technology, Lahore, Pakistan.
Email: [email protected]
4 PhD. Scholar, Massey University, New Zealand. Email: [email protected]
1. Introduction 1.1. Background
Theoretically, the purpose of financial management is the maximization of shareholder wealth. Conventionally, a variety of measures including accounting scales (earnings, profits and cash flows) and financial ratios (return on assets or equity etc.) are used to gauge the shareholder value. These measures seek to assist investors and other stakeholders to evaluate current performance and prospects of an enterprise. Following the Efficient Market Hypothesis (EMH), a group of researchers advocated that stock prices reflect all publicly available information about financial fundamentals of a firm. These studies deploy different capital asset pricing models to measure the firm market value.
Since 1960, studies have employed accounting measures to assess performance of corporate entities. The most basic studies use Net Present Value (NPV) or Internal Rate of Return (IRR) (Fisher, 1930; Hirschleifer, 1958). Miller and Modigliani (1961) introduced a more sophisticated valuation model that is supported by the Gordon (1962) model. While Solomon (1965) presented a modified measure of Residual Income (RI). Further, a more comprehensive measure to evaluate financial performance: Tobin’s Q, was presented by Tobin (1961). Stewart (1991) contended that Free Cash Flow (FCF) is also a useful valuation measure while Rappaport (1986) supported Shareholder Value approach (SHV) which is contained in Stewart’s (1991) idea of Economic Value Added.
1.2. The Concept of Economic Value Added (EVA) for Shareholders
Economic value added (EVA) is another measure for the financial performance of the firm. EVA estimates the economic profit of an enterprise along with the factor of value creation. The approach uses discounted future cash flows to generate profit (surplus return) after the earnings are distributed to the investors. The notion asserts EVA as a wealth maximization factor for shareholders and holds
important place in performance gauging measures. The advocates of EVA argue that conventional measures based on earnings are misleading indicators of corporate financial performance. While in contrast, EVA considers the true economic yield of an enterprise and is also aligned with shareholders’ value creation goal (Worthington & West, 2004). EVA recognizes that capital employed in the firm must be paid off in the form of wages. Thus, the error encountered by the conventional measures is corrected by the implementation of EVA factor. Additionally, EVA also adjusts the distortions prevalent in accounting information (Chen & Dodd, 2001).
Traditionally, numerous studies have used accounting measures like earnings, profits, accruals, cash flows and residual income to determine financial performance. This reliance on accounting measures was based on the notion that accounting estimates have considerable impact on market value of stock prices. However, this reliance has considerably shifted towards value driven estimates like EVA. The purpose of this research is to evaluate the effects of EPS and EVA on the market value of listed firms. Moreover, following earlier studies of Palliam (2006), Sharma and Kumar (2010), and Mostafa and Dixon (2013), this study additionally seeks to examine the efficiency of EVA in providing incremental informational advantages on market value of stock prices. Several papers have examined the impacts of EPS and EVA on stock prices in developed equity markets around the globe. However, very few studies have explored the underlying associations in Pakistan. A recent study by Khan, Aleemi, and Qureshi (2016) contended that EVA is superior in comparison to other accounting measures. Our study extends the literature by describing the relevance of EVA and EPS on stock prices by considering larger sample size and time span. The study not only intends to add value to the literature from local perspective, but also seeks to validate that the conclusions drawn from the analysis could be generalizable to other emerging markets.
2. The Literature Review
Earnings provide limited information about the financial performance of a company to investors and stakeholders. Thus, cash flows emerge as a vital source of information for the investors. Rappaport (1981, 1986) and Rappaport (1998) suggested that profits are not able to capture the actual impacts of firm economic value. Moreover, economic profit cannot be accurately measured using accounting rates of return. On the contrary, measures like economic value added and shareholder value can outperform traditional measures of performance. Stewart (1991) defined EVA as the capital charge deducted from Net Operating Profit after Taxes (NOPAT). When the cost of financing is exceeded by NOPAT then EVA is positive and results in the creation of value for shareholders. Contrary to this, shareholder value is destroyed by the company when EVA is negative (Bhasin, 2017). Further, Stewart (1991) suggested EVA to be the single best measure that creates wealth for shareholders and provides 50% better description of changes in shareholders wealth than other conventional accounting measures, which is strongly supported by Miller and Prondzinski (2017). Due to consideration of financial factors and long run non-financial issues, stakeholders tend to give more importance to the maximization of wealth and value creation.
The concept of value creation is more fascinating and visible to shareholders in Europe and other developed countries. Lehn and Makhija (1997) showed that EVA better recognizes the risks associated with company operations and has a stronger relationship with stock prices compared to other conventional measures. Research has been conducted to investigate the impact of accounting measures on stock price and stock return in Pakistan. However, empirical work on value creation indicator is limited (Azeem, Fayyaz, & Jadoon, 2018).
The inception of literature on EVA can be traced back to Stewart (1991). Empirical evidence from the study shows that there exists a strong association between EVA and market value added (MVA) measure. In his subsequent study, Stewart (1994)
showed that EVA can explain about half of the total percentage change in MVA as compared to sales and the findings are supported by Grant (1996) and O’Byrne (1996). E vidence s h o w s that the ratio of EVA to Weighted Average Cost of Capital (WACC) explains around 31.6% of the association between MVA and capital invested. Uyemura, Kantor, and Pettit (1996) corroborated the notion that EVA and MVA are strongly correlated. Using a different approach, Fernandez (2001) estimated the correlation coefficient between the two measures for 296 sample US firms and observes a higher association of EVA with NOPAT, when compared to MVA. Further, evidence shows that when taking MVA as the dependent variable, EVA is the superior measure in capturing shareholders value. Banerjee (1999) examined the relationship between shareholder wealth (MVA) and specific financial variables like EPS (Earning Per Share), ARONW (Average Return On Net Worth), KP (Capital Productivity), LP (Labor Productivity) and EVA (economic value added). The results of the study show that EVA has a positive and significant correlation with MVA which is also supported by others (Kurmi & Rakshit, 2017).
Other studies have shown that EVA has greater informational content in explaining stock returns (Kim, 2006; Palliam, 2006; Erasmus, 2008). Maditinos, Šević, and Theriou (2006) showed that EVA as compared to other measures is more strongly associated with stock returns and Ferguson, Rentzler, and Yu (2006) find that the EVA measure improves performance of stocks. Evidence from Australian firms indicates that in comparison to net cash flow, earnings and residual income, EVA is more strongly associated with stock return (Babatunde & Evuebie, 2017). Mengi and Bhatia (2017) examined economic value added (EVA) and traditional accounting measures as a predictor of market value added (MVA). MVA enables management to evaluate whether they are creating or destroying value and leads to better decisions.
Some studies indicate that the EVA measure is a superior source of information content. Chen et al. (2001) document, for a sample of US firms that EVA only explains 20% change in stock returns, while Return on Assets (ROA) explains 24.5% of
corresponding variability. Further, the results also showed that though EVA is a better measure when compared to EPS and ROA, when compared with residual income it fails to provide additional information content. Peterson and Peterson (1996) also contended that MVA exhibits a greater relationship with stock returns than EVA, which is reinforced by Biddle, Bowen, and Wallace (1997). According to Al-Taha'at, Al-Afeef, Al-Tahat, and Ahmad (2017) explained stock return, EVA is considered more powerful as compared to traditional measures. However, in addition to EVA, accounting earnings also provide useful information. The concepts of EVA and residual income are similar and comparable. Kumaran (2017) used a Shareholder Value Index to investigate banks listed on the Saudi Arabia stock exchange. The author finds that the success of Saudi banks could be attributed to increases in the shareholder value reflected through the measure of Economic Value Added (EVA). The authors suggest that cost of capital and NOPAT both are highly and significantly related to value creation, while some measures that capture highest capital do not necessarily lead to highest value creation.
On the other hand, Kiranga and James (2017) examined some other financial variables and found that EVA is positively and highly correlated with ROCE and ROWN, while EPS and EVA are positively correlated but to a lesser degree. When EVA is compared with traditional performance measures, and after applying the coefficient of determination (r2), it is observed that there is no traditional performance measure that explains the variation in shareholder wealth to its fullest extent.
Therefore, the extant literature provided mixed results about EVA’s ability to provide added advantages on the market value of the firm. However, majority research supports the view that EVA is an efficient financial performance measure when the goal is the maximization of shareholder value. Moreover Lovata and Costigan (2002) reported that EVA can assist in improving decision making through reducing agency conflicts.
Based on the mixed results of comprehensive literature and continuing debate on EVA as an effective performance measure, we examine following research questions: (a) Is EVA a better measure than EPS in explaining stock returns; and (b) Does EVA provide more information than EPS in explaining stock returns? Therefore, the hypotheses of this study are:
H1: EVA is a better measure than EPS in explaining stock return variation.
H2: EVA provides more information content than EPS in explaining stock return variability.
3. Sample, Data and Research Methodology 3.1. Sample & Data
The study sample comprises 30 largest listed non-financial firms on Pakistan Stock Exchange (PSX). The selection is based on the firm size which is derived from market capitalization. Moreover, the selected companies are from major non-financial sectors listed on PSX and covers the period from 2005-2014. The study sample contains 300 firm years for data analysis. The data is collected from annual financial statements of the respective companies for the independent variables, and data pertaining to stock prices is taken from the PSX official site. A list of the companies included in the sample is presented in Appendix A.
3.1.1. Definition of Variables
Dependent Variable: To evaluate the underlying hypotheses proposed in the study, the dependent variable utilized in the model is the logarithm of stock returns. Annual stock returns are calculated from daily closing stock prices. Additionally, the stock returns are also used to estimate the cost of capital. For this very purpose, PSE-100 index is used as the benchmark index and to measure the risk-free rate we take the Three-month Government Treasury bills.
Independent Variables: The independent variables of the study include, EVA, ΔEVA, EPS and ΔEPS, in the manner of Easton and Harris (1991). The definitions of these variables are provided in Table 1. Earlier studies use large number of adjustments to calculate EVA. However, Mouritsen (1998) advocates that 5 to 10 adjustments are adequate for the purpose. Therefore, we make the following adjustments to the figures of capital invested and NOPAT. Operating profit = Earnings before interest and taxes (EBIT) +
Amortization (1) Cash operating expenses = Tax paid+ Interest expenses Tax benefit
(2)
Interest expenses Tax benefit = Interest expenses (1-Tax rate) (3)
Net operating profit after taxes (NOPAT) = Operating profit – Cash
operating expenses (4)
Capital invested= Total equity capital +Shot-term and Long-term
debt +Other Provisions (5) CAPM = Rf + β (Rm – Rf) (6)
Weighted Average Cost of Capital (WACC) = Cost of Equity + Cost
of debt (1-Tax rate) (7) WACC = CAPM + [(Markup on Short term debt/ Total Short-term
debt) + (Markup on
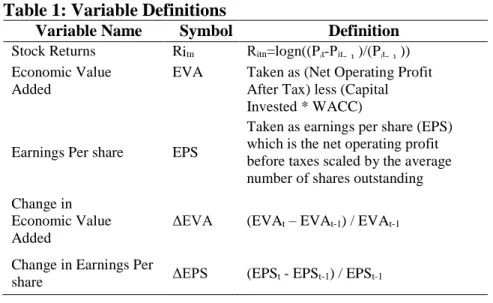
Table 1: Variable Definitions
Variable Name Symbol Definition
Stock Returns Ritn Rᵢtn=logn((Pᵢt-Pᵢt₋ ₁)/(Pᵢt₋ ₁))
Economic Value Added
EVA Taken as (Net Operating Profit
After Tax) less (Capital Invested * WACC)
Earnings Per share EPS
Taken as earnings per share (EPS) which is the net operating profit before taxes scaled by the average number of shares outstanding Change in
Economic Value Added
ΔEVA (EVAt – EVAt-1) / EVAt-1
Change in Earnings Per
share ΔEPS (EPSt - EPSt-1) / EPSt-1
3.2. Empirical Model
The empirical configurations used in the study are based on the valuation model proposed by Easton and Harris (1991). The model links the stock returns to all the included variables along with changes in those variables.
𝑅ᵢ𝑡𝑛 = 𝛾𝑡₀𝑛 + 𝛾𝑡₁𝐴ᵢ𝑡𝑛/𝑃ᵢ𝑡₋₁𝑛 + 𝛾𝑡₂∆𝐴ᵢ𝑡𝑛/𝑃ᵢ𝑡₋₁𝑛 + Ԑᵢ𝑡𝑛 (9) Where 𝑅ᵢ𝑡 is the share return of ‘i’ firm taken over twelve months, 𝐴ᵢ𝑡 represents earnings per share for firm ‘i’ for time t, ∆𝐴ᵢ𝑡 shows the accounting earnings change and 𝑃ᵢ𝑡₋₁ represents for ‘i’ firm at time t-1, the price per share. Therefore, based on the above model, we derive the following two regression equations:
Rtn = v0n + v1 EVA / Pt-1n +v2 ΔEVA/ Pt-1n + Ԑ1 (10)
Rtn = x0n + x1 EPS / Pt-1n + x2 ΔEPS / Pt-1n + Ԑ2 (11)
As used by the researchers (Easton & Harris, 1991; Biddle et al., 1997; Chen et al., 2001) we scale the independent variables by first trading day of the year stock price to minimize heteroskedasticity in data. As mentioned earlier, the incremental
content approach tests tend to explore if one specified measure adds information to the information provided by another measure. It is explained as; R2 p/q being the coefficient of determination of two
variable p and q indicates the increase in R2 because of p variable, conditional on q variable. Similarly, R2 f/q indicates the change in R2 because of both p and q variable (Cheng, Cheung, &
Gopalakrishnan, 1993). For the purpose of this study, the model proposed by Easton a n d Harris (1991) has been extended by combining one traditional accounting measure with one value-based measure of performance, EVA. Therefore, the following final equation appears;
Rtn = p0n +x1 EPS/Pt-1n +x2 ΔEPS/Pt-1n +v1 EVA/Pt-1n +v2 ΔEVA/Pt-1n
+Ԑ5 (12)
4. Results and Discussion 4.1. Descriptive Analysis
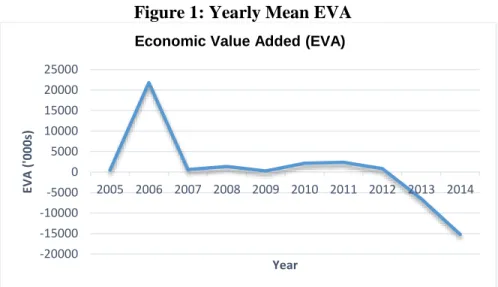
Variables are defined in Table 1. Table 2 reports descriptive statistics of the variables of study. The descriptive statistics are calculated based on pooled data. The statistics reveal that the EPS has the lowest variation among all the variables in the model. However, ΔEVA has the highest standard deviation. The skewness shows that EVA and EPS both are negatively skewed and most of the values of both variables are clustered on the negative side. Figure 1 provides a graphical depiction of mean values of EVA across the period from 2005 to 2006. The graph indicates that there was an increase in EVA from 2005 to 2006, while from 2013 the sample firms show negative EVA.
Table 2: Descriptive Statistics
Var. N Max. Min. Mean St. Dev.
Std. Error
Skewne
ss Kurtosis
Re 300 0.0183 -0.0160 -0.00002 0.0042 0.0002 -0.8894 6.3902
EVA 300 6.51E+08 -6.01E+08 812878.5 5.65E+07 3261163 0.6605 104.8133
ΔEVA 300 2971.683 -1100.021 13.2273 197.9536 11.4288 11.0773 173.2833
EPS 300 4.7397 -1.8413 0.1913 0.5340 0.0308 4.2193 31.2857
Figure 1: Yearly Mean EVA
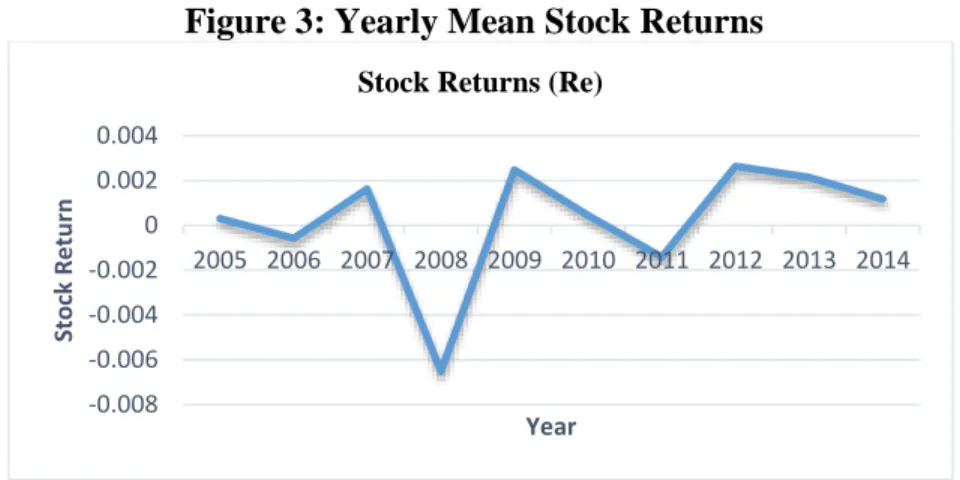
Figure 2 presents a graph of mean EPS for the sample firms for the period from 2005-2011. The curve indicates that there has been a steady increase in EPS over the years, except for 2011 where there appears to be is a significant dip in earnings per share. Figure 3 depicts stock return trend in the market. As expected the stock prices dipped sharply in 2008 showing the impacts of the global financial crisis, and a recovery by the middle of 2009. When we compare the trends in EVA and EPS there appears to be no synchrony in the trend lines as depicted in Figure 4.
Figure 2: Yearly Mean EPS -20000 -15000 -10000 -5000 0 5000 10000 15000 20000 25000 2005 2006 2007 2008 2009 2010 2011 2012 2013 2014 EV A ( '000s) Year
Economic Value Added (EVA)
0 5 10 15 20 25 30 35 2005 2006 2007 2008 2009 2010 2011 2012 2013 2014 EPS % Year
Figure 3: Yearly Mean Stock Returns
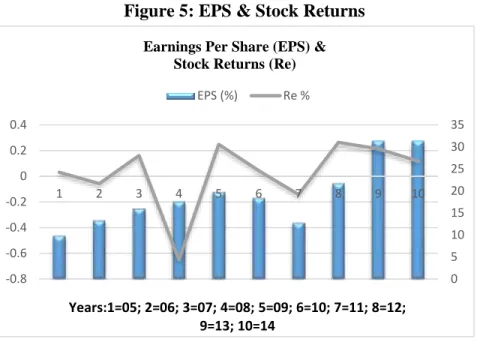
Finally, in Figures 5 and 6 we compare EPS and EVA with stock returns (Re) respectively. This provides a visual idea of the relationship of both EPS and EVA with stock prices. The trend lines in Figure 6 shows a perceptible difference between EVA and Re, especially during the last few years, while the EPS trend is more aligned with market stock return performance in Figure 5.
Figure 4: Comparison of year-wise EPS & EVA -0.008 -0.006 -0.004 -0.002 0 0.002 0.004 2005 2006 2007 2008 2009 2010 2011 2012 2013 2014 Sto ck R e tu rn Year
Stock Returns (Re)
0 0.05 0.1 0.15 0.2 0.25 0.3 0.35 -20000 -15000 -10000 -5000 0 5000 10000 15000 20000 25000 1 2 3 4 5 6 7 8 9 10 YEARS:1=05; 2=06; 3=07; 4=08; 5=09; 6=10; 7=11; 8=12; 9=13; 10=14; A X IS TI TLE
EVA & EPS
0 5 10 15 20 25 30 35 -0.8 -0.6 -0.4 -0.2 0 0.2 0.4 1 2 3 4 5 6 7 8 9 10 Years:1=05; 2=06; 3=07; 4=08; 5=09; 6=10; 7=11; 8=12; 9=13; 10=14
Earnings Per Share (EPS) & Stock Returns (Re)
EPS (%) Re %
Figure 5: EPS & Stock Returns
Figure 6: EVA & Stock Returns
-0.8 -0.6 -0.4 -0.2 0 0.2 0.4 1 2 3 4 5 6 7 8 9 10 -20000 -15000 -10000 -5000 0 5000 10000 15000 20000 25000 Years:1=05; 2=06; 3=07; 4=08; 5=09; 6=10; 7=11; 8=12; 9=13; 10=14
EVA & Stock Returns
Table 3: Correlations between Major Variables
Re EVA EPS
Re 1
EVA -0.0886 1
EPS 0.0892 0.0063 1
Table 3 depicts the correlations between three major variables utilized in the study. The results reveal that EPS has very low correlation with the stock returns. However, the results also illustrate that EVA shows negative correlation with stock returns which is consistent with Biddle et al. (1997) and Chen et al. (2001).
4.2. Relative and Incremental Information Content
Table 4 reports R2 and F-tests along with P-values of regression covering the full-time span of the study. Each of the regression models is estimated using the methodology of Easton and Harris (1991) and Chen and Dodd (2001) containing inter-temporal (all years), individual as well as pooled cross section sample. The results show that EVA and EPS both are statistically significant at 10 % level. Further, the results also report that more information about stock returns is explained by EPS (R2=1.02) as compared to EVA (R2=0.98). The findings are consistent with the conclusions drawn by Biddle et al. (1997), Chen et al. (2001), Worthington et al. (2004) and Kyriazis and Anastassis (2007). The evidence presented indicates that in the context of PSX, EVA generates less informative value as compared to the EPS. Therefore, the results suggest that the EPS provides more informational content about stock returns.
Table 4: Results for Pooled Regression (full period) Regression
(1)
Regression (2)
All Years EVA EPS
R2 0.0098 0.0102
F-Statistic (1.46)*** (1.53)***
4.3. Test for Heteroskedasticity
The heteroskedasticity factor in the data is also checked using Breusch-Pagan / Cook-Weisberg test on each regression model. The test indicates the Chi2 values along with p-values for significance. The results of the respective test are shown in Table 5. The Chi2 values reject the null hypothesis of homoskedasticity, and therefore we use the White-Huber sandwich estimator of variance to obtain robust standard errors and reduce the effects of heteroskedasticity.
Table 5: Breusch-Pagan /Cook-Weisberg Test
Variable Chi2 Chi2(p)
EVA 1.81 (0.0178)**
EPS 5.22 (0.0224)**
**Significance at 5 percent level
4.4. Test for Multicollinearity
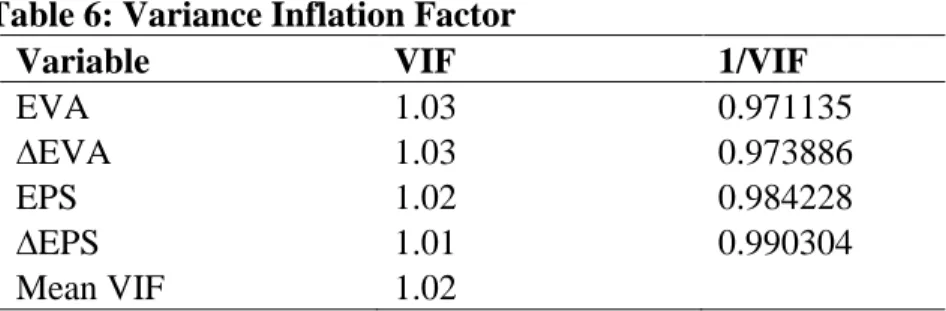
The VIF results presented in Table 6 indicate that the models are free from any problems of multicollinearity and all results are below the limit of 10.
Table 6: Variance Inflation Factor
Variable VIF 1/VIF
EVA 1.03 0.971135
∆EVA 1.03 0.973886
EPS 1.02 0.984228
∆EPS 1.01 0.990304
Mean VIF 1.02
In addition to inter-temporal (all years) results of four regressions, each independent variable is explained on yearly basis. The output provides the same conclusions. Indicatively, the output for EPS and EVA has been presented in Table 7 and 8 respectively.
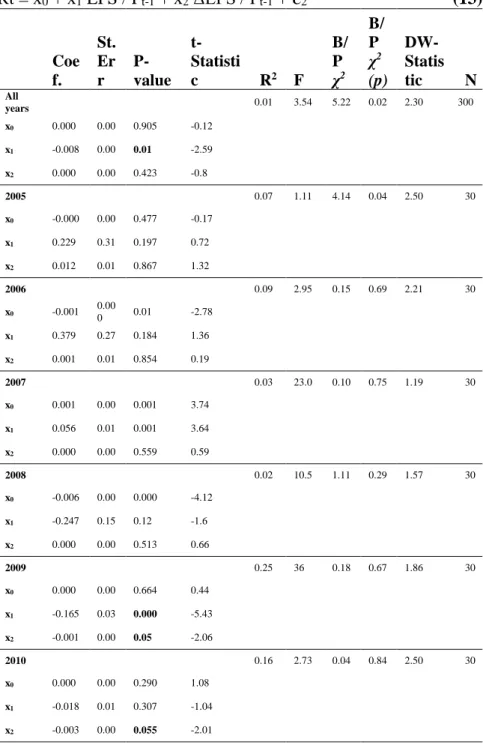
Table 7: Relative Information Content of EPS Rt = x0 + x1 EPS / Pt-1 + x2 ΔEPS / Pt-1 + Ԑ2 (13) Coe f. St. Er r P-value t-Statisti c R2 F B/ P χ2 B/ P χ2 (p) DW-Statis tic N All years 0.01 3.54 5.22 0.02 2.30 300 x0 0.000 0.00 0.905 -0.12 x1 -0.008 0.00 0.01 -2.59 x2 0.000 0.00 0.423 -0.8 2005 0.07 1.11 4.14 0.04 2.50 30 x0 -0.000 0.00 0.477 -0.17 x1 0.229 0.31 0.197 0.72 x2 0.012 0.01 0.867 1.32 2006 0.09 2.95 0.15 0.69 2.21 30 x0 -0.001 0.00 0 0.01 -2.78 x1 0.379 0.27 0.184 1.36 x2 0.001 0.01 0.854 0.19 2007 0.03 23.0 0.10 0.75 1.19 30 x0 0.001 0.00 0.001 3.74 x1 0.056 0.01 0.001 3.64 x2 0.000 0.00 0.559 0.59 2008 0.02 10.5 1.11 0.29 1.57 30 x0 -0.006 0.00 0.000 -4.12 x1 -0.247 0.15 0.12 -1.6 x2 0.000 0.00 0.513 0.66 2009 0.25 36 0.18 0.67 1.86 30 x0 0.000 0.00 0.664 0.44 x1 -0.165 0.03 0.000 -5.43 x2 -0.001 0.00 0.05 -2.06 2010 0.16 2.73 0.04 0.84 2.50 30 x0 0.000 0.00 0.290 1.08 x1 -0.018 0.01 0.307 -1.04 x2 -0.003 0.00 0.055 -2.01
Coe f. St. Er r P-value t-Statisti c R2 F B/ P χ2 B/ P χ2 (p) DW-Statis tic N 2011 0.28 102. 75 0.00 0.94 2.00 30 x0 -0.001 0.00 0.000 -4.96 x1 0.023 0.00 0.000 9.89 x2 0.000 0.00 0.000 6.22 2012 0.08 29.3 0.00 0.99 2.40 30 x0 0.002 0.00 0.0000 6.70 x1 -0.004 0.00 0.0000 -7.60 x2 0.000 0.00 0.489 0.70 2013 0.02 9.14 0.15 0.69 1.93 30 x0 0.002 0.00 0.000 4.06 x1 -0.039 0.02 0.148 -1.49 x2 0.000 0.00 0.012 -2.71 2014 0.06 7.26 0.11 0.73 1.82 30 x0 0.001 0.00 0.062 1.95 x1 0.002 0.00 0.040 2.16 x2 0.000 0.00 0.021 2.45
*The dependent variable is stock return, and EPS and ΔEPS represent the explanatory variables in the model.
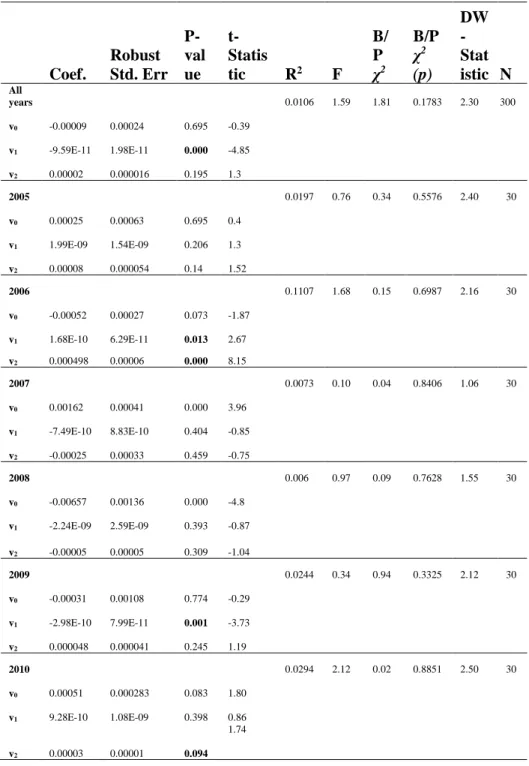
Table 8: Relative Information Content of EVA Rt = v0 + v1 EVA / Pt-1 + v2 ΔEVA/ Pt-1 + Ԑ1 (14) Coef. Robust Std. Err P-val ue t-Statis tic R2 F B/ P χ2 B/P χ2 (p) DW -Stat istic N All years 0.0106 1.59 1.81 0.1783 2.30 300 v0 -0.00009 0.00024 0.695 -0.39 v1 -9.59E-11 1.98E-11 0.000 -4.85 v2 0.00002 0.000016 0.195 1.3 2005 0.0197 0.76 0.34 0.5576 2.40 30 v0 0.00025 0.00063 0.695 0.4 v1 1.99E-09 1.54E-09 0.206 1.3 v2 0.00008 0.000054 0.14 1.52 2006 0.1107 1.68 0.15 0.6987 2.16 30 v0 -0.00052 0.00027 0.073 -1.87 v1 1.68E-10 6.29E-11 0.013 2.67 v2 0.000498 0.00006 0.000 8.15 2007 0.0073 0.10 0.04 0.8406 1.06 30 v0 0.00162 0.00041 0.000 3.96 v1 -7.49E-10 8.83E-10 0.404 -0.85 v2 -0.00025 0.00033 0.459 -0.75 2008 0.006 0.97 0.09 0.7628 1.55 30 v0 -0.00657 0.00136 0.000 -4.8 v1 -2.24E-09 2.59E-09 0.393 -0.87 v2 -0.00005 0.00005 0.309 -1.04 2009 0.0244 0.34 0.94 0.3325 2.12 30 v0 -0.00031 0.00108 0.774 -0.29 v1 -2.98E-10 7.99E-11 0.001 -3.73 v2 0.000048 0.000041 0.245 1.19 2010 0.0294 2.12 0.02 0.8851 2.50 30 v0 0.00051 0.000283 0.083 1.80 v1 9.28E-10 1.08E-09 0.398 0.86 v2 0.00003 0.00001 0.094 1.74
Coef. Robust Std. Err P-val ue t-Statis tic R2 F B/ P χ2 B/P χ2 (p) DW -Stat istic N 2011 0.1236 1.90 0.55 0.4572 1.96 30 v0 -0.0013 0.0003 0.000 -4.32 v1 7.23E-10 1.56E-10 0.000 4.63 v2 -0.0003 0.00024 0.199 -1.32 2012 0.2595 4.73 0.77 0.3808 2.32 30 v0 0.0024 0.00036 0.000 6.59 v1 -9.44E-12 2.14E-11 0.662 -0.44 v2 0.00022 0.00001 0.000 14.61 2013 0.0217 0.30 0.08 0.7748 1.97 30 v0 0.00209 0.000537 0.001 3.90 v1 -4.03E-11 1.53E-11 0.014 -2.64 v2 -0.00001 0.00001 0.073 -1.87 2014 0.1933 3.23 0.61 0.4333 2.06 30 v0 0.00099 0.000541 0.077 1.84 v1 -4.97E-11 2.05E-11 0.023 -2.42 v2 -0.00527 0.00176 0.006 -2.98
*The dependent variable is stock return, and EVA and ΔEVA represent the explanatory variables in the model. Variable definitions are provided in Table 1. The results of cross section regressions show similar results to our earlier presented result of pooled regression. In case of EPS, six out of ten years show statistically significant results. In year 2007, 2009, 2011, 2012, 2014 and full model the coefficients are significant and these are highlighted in bold. Furthermore, t-statistic reveals most of the annual regression coefficients to be significant statistically at levels, 0.01, 0.05, and 0.1. However, the results reported in Table 8 show that in case of EVA only five regressions out of 10 show statistically significant results, at 5 %. These five years include 2006, 2009, 2011, 2013, 2014 and full sample. A scrutiny of the magnitude of the coefficients reveals that EPS shows more robust results in comparison to EVA. This identifies EVA to be unassociated with stocks returns at least in case of individual years’ sample, providing support for the EPS measure having more
explanatory power about stock return trends and performance. Results of the Breusch-Pagan (B/P) χ2 tests are shown in columns 8
and 9 of Tables 7 and 8. The Durbin Watson (DW) test results for auto correlation are provided in column 10 of the Tables. Generally a Durbin Watson test statistic from 1.5 to 2.5 is considered relatively normal. While figures not within this range should be a cause of concern. Field (2009). Indicates that figures that are below 1 or above 3 may be a reason for worry.
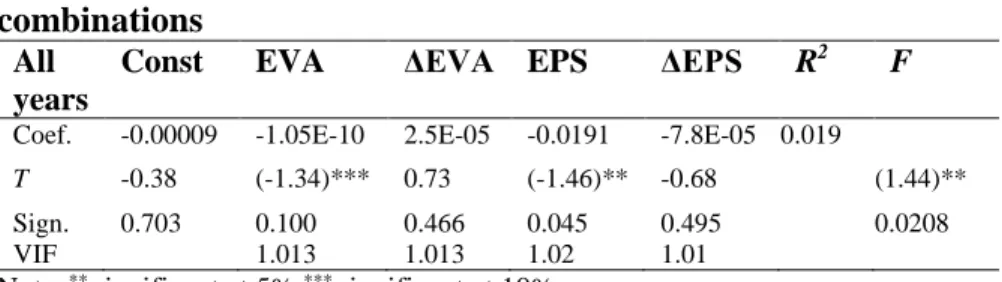
Table 9: Incremental information content approach – Pairwise combinations
All years
Const EVA ΔEVA EPS ΔEPS R2 F
Coef. -0.00009 -1.05E-10 2.5E-05 -0.0191 -7.8E-05 0.019
T -0.38 (-1.34)*** 0.73 (-1.46)** -0.68 (1.44)**
Sign. 0.703 0.100 0.466 0.045 0.495 0.0208
VIF 1.013 1.013 1.02 1.01
Note: ** significant at 5% *** significant at 10%
To determine the incremental information content of EVA,
we have used a pair-wise combination of EVA and EPS. The underlying assumption for using pair-wise combination is linear relationship between the variables. Further, to check multicollinearity between the variables Variance Inflation Factor (VIF) is employed. The Variance Inflation Factor for the respective regression indicates the value to be less than 5, depicting nonexistence of multicollinearity. In Table 9 we present results of the pair-wise combination regression. These results depict that highest R2 output (1.9%) is achieved by combining EVA, ΔEVA, EPS and ΔEPS. It can be inferred from these results that in the context of Pakistan, EVA combined with EPS provides better explanation. The results are like that evidenced by Chen et al. (2001) and Worthington et al. (2004) in the US and Australian capital markets.
5. Limitations of the Study
This study follows the models of Easton and Harris (1991). However, due to a comparatively smaller data sample in our
research with only 30 observations in each year-wise regression model and 300 in the pooled results, the R2 are comparatively small. This arises due to constraints on data availability. Easton and Harris (1991) do not use any control variables in their regression models, and this may also contribute to the weaker results, it provides the opportunity for employing a larger sample set in the future and with additional control variables which may provide stronger results.
6. Conclusion
The primary purpose of the study is to investigate the relative and incremental information of EVA as compared to conventional accounting measures in the capital market of Pakistan. The methodology deployed by the study is derived from Easton and Harris (1991). The evidence obtained in the study shows that EPS outperforms EVA in respect of relative information. This implies that EPS provides more explanatory power in relation to stock returns over EVA in PSX. The results are similar to other studies that have found EVA and RI, underperformed relative to EPS. The results are opposite to the notion that value based measures can better explain the financial performance of the company as compared to traditional accounting measures. Additionally, the results of incremental information content also reveal that EVA combined with EPS provides higher explanation of stock returns. Although, EVA provides marginal incremental information combined with EPS, but it is very low.
The findings of this study support the evidence presented by Khan et al. (2016) for capital market in Pakistan. Similar results are achieved with larger sample of companies. These findings depict that EVA fails to emerge as superior source of information. The results may be affected by the operational performance of the companies in our sample.
The study makes important contributions to the asset pricing financial literature and to a better understanding of capital market dynamics in Pakistan. It provides an insight into the importance of earnings in this market as compared to value measures such as EVA. Therefore, it suggests that focus on earnings and
profits would provide better performance in the stock markets. The results have various implications for academics, practitioners and investors. It can assist market participants understand the relationship between value-based measures and stock prices. Further, the study can be extended in various ways by using larger sample with more firm-year observations. Additionally, the cost of capital can be estimated using different approach as indicated by Rappaport (1998) and Stewart (1991) who suggested the use of risk premium based on the Arbitrage Pricing Theory (APT).
References
Al-Taha'at, E., Al-Afeef, M., Al-Tahat, S., & Ahmad, M. A. (2017). The impact of the general level of prices and operating profit on Economic Value Added (EVA) (Analytical study: ASE 2001-2015). Asian Social Science, 13(11), 142-151.
Anifowose, M., Rashid, A., Annuar, H. A., & Ibrahim, H. (2018). Intellectual capital efficiency and corporate book value: Evidence from Nigerian economy. Journal of Intellectual Capital, 19(3), 644-668.
Azeem, A., Fayyaz, A., & Jadoon, A. K. (2018). Economic value addition implications: A study of the Pakistani banking industry. Pakistan Business Review, 19(4), 892-907.
Babatunde, A. A., & Evuebie, O. C. (2017). The impact of economic value added (EVA TM) on stock returns in Nigeria. Scholar’s Journal of Economics, Business and Management, 4(2), 89-93.
Banerjee, A. (1999). Economic Value Added and shareholder wealth: An empirical study of relationship. Paradigm, 3(1), 99-133.
Bhasin, M. L. (2017). A study of economic value added disclosures in the annual reports: Is EVA a superior measure of corporate performance. East Asian Journal of Business Economics, 5(1), 10-26.
Biddle, G. C., Bowen, R. M., & Wallace, J. S. (1997). Does EVA® beat earnings? Evidence on associations with stock returns and firm values. Journal of Accounting and Economics, 24(3), 301-336.
Chen, S., & Dodd, J. L. (2001). Operating income, residual income and EVA™: Which metric is more value relevant? Journal of Managerial Issues, 13(1), 65-86.
Cheng, C. S. A., Cheung, J. K., & Gopalakrishnan, V. (1993). On the usefulness of operating income, net income and comprehensive income in explaining security returns. Accounting and Business Research, 23(91), 195-203. Easton, P. D., & Harris, T. S. (1991). Earnings as an explanatory
variable for returns. Journal of Accounting Research, 29(1), 19-36.
Erasmus, P. (2008). The relative and incremental information content of the value-based financial performance measure cash value added (CVA). Management Dynamics: Journal of the Southern African Institute for Management Scientists, 17(1), 2-15.
Ferguson, R., Rentzler, J., & Yu, S. (2006). Trading strategy on EVA and MVA: Are they reliable indicators of future stock performance?. Journal of Investing, 3(4), 88-94.
Fernandez, P. (2001). EVA, economic profit and cash value added do not measure shareholder value creation (Working Paper No. n.d). Retrieved from: http://citeseerx.ist.psu.edu/view-kdoc/download?doi=10.1.1.201.9225&rep=rep1&type=pdf Field, A. P. (2009). Discovering statistics using SPSS (3rd ed.).
London, United Kingdom: Sage.
Fisher, I. (1930). The theory of interest as determined by impatience to spend income and opportunity to invest it. New York, United States of America: Macmillan
Gordon, M. J. (1962). The investment, financing, and valuation of the corporation. Chicago, United States of America: RD Irwin.
Grant, J. L. (1996). Foundations of EVA™ for investment managers. The Journal of Portfolio Management, 23(1), 41-48.
Hirshleifer, J. (1958). On the theory of optimal investment decision. Journal of Political Economy, 66(4), 329-352.
Khan, U. A., Aleemi, A. R., & Qureshi, M. Z. (2016). Is economic value added more associated with stock price than accounting earnings? Evidence from Pakistan. City University Research Journal, 6(2), 204-216.
Kim, W. G. (2006). EVA and traditional accounting measures: Which metric is a better predictor of market value of hospitality companies?. Journal of Hospitality & Tourism Research, 30(1), 34-49.
Kiranga, P. W., & James, M. M. (2017). The Relationship between intrinsic and market values of listed companies in the Nairobi securities exchange. International Journal of Marketing Strategies, 1(1), 63-75.
Kumaran, S. (2017). Shareholder Value Index for Saudi Banks. International Journal of Financial Research, 8(4), 196-212. Kurmi, M. K., & Rakshit, D. (2017). Information content of EVA and traditional accounting based financial performance measures in explaining corporation’s change of market value. International Journal of Research in Finance and Marketing, 7(2), 1-14.
Kyriazis, D., & Anastassis, C. (2007). The validity of the economic value added approach: An empirical application. European Financial Management, 13(1), 71-100.
Lehn, K., & Makhija, A. K. (2005). EVA, accounting profits, and CEO turnover: An empirical examination, 1985-1994. Journal of Applied Corporate Finance, 10(2), 90-97.
Lovata, M. L., & Costigan, M. L. (2002). Empirical analysis of adopters of economic value added. Management Accounting Research, 13(2), 215-228.
Maditinos, D. I., Sevic, Z., & Theriou, G. N. (2006). The introduction of economic value added (EVA) in the corporate world. The South European Review of Business and Accounting, 4(2), 1-11.
Mengi, T., & Bhatia, B. S. (2017). Shareholder value creation-comparison of traditional accounting measures and EVA as predictors of MVA. Abhigyan, 35(2), 66-78.
Miller, M., & Modigliani, F. (1961). Dividend policy, growth, and the valuation of shares. The Journal of Business, 34(4), 411-433.
Miller, M., & Prondzinski, D. (2017). Stock Repurchases: Do they add to shareholder value over time?. Journal of Accounting and Finance, 17(4), 48-62.
Mostafa, W., & Dixon, R. (2013). The impact of earnings extremity on information content of cash flow. Review of Accounting and Finance, 12(1), 81-104.
Mouritsen, J. (1998). Driving growth: economic value added versus intellectual capital. Management Accounting Research, 9(4), 461-482.
O'Byrne, S. F. (1996). EVA® and market value. Journal of Applied Corporate Finance, 9(1), 116-126.
Palliam, R. (2006). Further evidence on the information content of economic value added. Review of Accounting and Finance, 5(3), 204-215.
Peterson, P. P., & Peterson, D. R. (1996). Company performance and measures of value added. The Research Foundation of the Institute of Chartered Financial Analysts.
Rappaport, A. (1981). Selecting strategies that create shareholder value. Harvard Business Review, 59(3), 139-149.
Rappaport, A. (1986). Creating shareholder value: the new standard for business performance. Michigan, United States of America: Free Press.
Rappaport, E. (1998). Copyright term extension: Estimating the economic values. Congressional Research Service (Report No. 98-144 E). Retrieved from the University of Northern Texas Digital Library website: https://digital.library.unt-.edu/ark:/67531/metadc822525/versity?q=%20Copyright% 20term%20extension%3A%20Estimating%20the%20econo mic%20values.%20Congressional%20Research%20Servic e
Sharma, A. K., & Kumar, S. (2010). Economic value added (EVA)-literature review and relevant issues. International Journal of Economics and Finance, 2(2), 200-206.
Solomons, D. (1965). Divisional performance: measurement and control. Princeton, United States of America: Markus Wiener Publishers.
Stewart, G. B. (1994). EVA™: Fast and Fantasy. Journal of Applied Corporate Finance, 7(2), 71-84.
Stewart, G. B. (1991). The Quest for Value. New York, United Sates of America: Harper Collins Publishers.
Tobin, J. (1961). Money, capital, and other stores of value. The American Economic Review, 51(2), 26-37.
Uyemura, D. G., Kantor, C. C., & Pettit, J. M. (1996). EVA® for banks: Value creation, risk management, and profitability measurement. Journal of Applied Corporate Finance, 9(2), 94-109.
Worthington, A. C., & West, T. (2004). Australian evidence concerning the information content of economic value-added. Australian Journal of Management, 29(2), 201-22.
Annexure
Sr. No
Ticker Company Name Industry
1 AGIL Agriauto Industries Limited Automotive
manufacturers industry
2 ANL Azgard Nine Limited Textile industry
3 ATBA Atlas Battery Limited Automotive and industrial
batteries manufacturers
4 BYCO Byco Petroleum Pakistan Limited Petroleum industry
5 CHCC Cherat Cement Company Cement industry
6 DAWH Dawood Hercules Corporation Investment Company
7 FCCL Fauji Cement Company Limited Cement industry
8 GATM Gul Ahmed Textile Mills Limited Textile industry
9 HUBC The Hub Power Company Power Producers industry
10 ICI ICI Pakistan Limited (Imperial
Chemical Industries)
Chemical industry
11 ICL Ittehad Chemicals Limited Chemicals industry
12 IDYM Indus Dyeing & Manufacturing
Company Limited
Textile industry
13 KOHE Kohinoor Energy Limited Power Producers industry
14 LUCK Lucky Cement Limited Cement industry
15 MARI Mari Petroleum Company Limited Petroleum industry
16 NATF National Foods Limited Food products industry
17 NESTLE Nestlé Pakistan Food products industry
18 NICL National Insurance Company
Limited
Insurance company
19 NML Nishat Mills Limited Textile industry
20 OGDC Oil & Gas Development
Company, Pakistan
Oil and gas producers industry
21 OTSU Otsuka Pakistan Limited Pharmaceutical industry
22 PAKT Pakistan Tobacco Company Ltd Tobacco company
23 PKGS Packages Limited Packing company
24 POL Pakistan Oilfields Limited Petroleum industry
25 RMPL Rafhan Maize Products Company
Limited
Food products industry
26 SEPCO Sukkur Electric Power Company
(SEPCO)
Power producers industry
27 SHEL Shell Pakistan Petroleum industry
28 SITC Sitara Chemical Industries Limited Chemical industry
29 TGL Tariq Glass Industries Limited Glass products company