Using Overlay Networks to Resist Denial-of-Service Attacks
Ju Wang and Andrew A. ChienDepartment of Computer Science and Engineering University of California, San Diego
{jwang,achien}@cs.ucsd.edu Abstract
Proxy-network based overlays have been proposed to protect Internet applications against Denial-of-Service (DoS) attacks by hiding an application’s location. We develop a formal framework which models attacks, defensive mechanisms, and proxy networks. We use the framework to analyze the general effectiveness of proxy network schemes to protect applications. Using our formal model, we analytically characterize how attacks, defensive schemes, and proxy network topology affect the secrecy of application location and general resource availability. Our results provide guidelines for the design of proxy networks; the formal framework provides a tool to study problems in this area.
Our analysis shows that proxy networks are a feasible approach to prevent infrastructure-level DoS attacks. Proxy network depth and system reconfiguration are the keys to achieving location hiding. Proxy network topology also has an important impact -- rich connectivity in the proxy network, a virtue in other circumstances, reduces effectiveness in location hiding. Finally, to avoid resource depletion, reactive resource recoveries are insufficient; proactive schemes are needed.
Keywords
security, availability, Denial-of-Service, overlay network
1 INTRODUCTION
Denial-of-service (DoS) attacks are a major security threat to Internet applications. Since 1998, there have been a series of large-scale distributed DoS attacks which effectively shut down popular sites such as Yahoo! and Amazon and the White House website was forced to move to a different location [1-5]. These attacks have serious economic impact and political repercussions, and may even threaten critical infrastructures and national security [6-8].
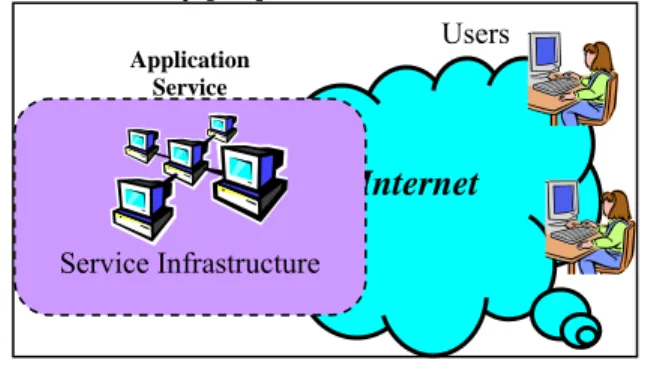
Figure 1 Example of Internet Application
In a Denial-of-Service attack, attackers can make the victim application unavailable to legitimate users by overloading the application with floods of network traffic or large amount of workload. DoS attacks can be categorized as infrastructure level or application level attacks. shows a typical Internet
application deployment. The application service runs on a set
of interconnected hosts, which is the service infrastructure; users access it via the Internet. Infrastructure-level attacks
overload the service infrastructure, for example, by sending packet floods to saturate the victim network. In this case, attackers can effectively DoS an application without any knowledge of it except for its IP address. Application-level attacks cause denial-of-service by requesting large amounts of
work at the application level or by exploiting weaknesses in the application.
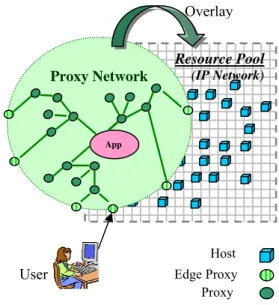
Many Internet applications are publicly accessible, so they are easy targets for infrastructure-level DoS attacks. We are exploring the use of overlay proxy networks to tolerate infrastructure-level attacks. The key idea is to hide the Internet applications behind a proxy network, which is an overlay network (Figure 2). All accesses to the applications are mediated through the proxy network. Since only application level traffic can pass through the proxy network, infrastructure level attacks are no longer possible as long as the IP address of the application can be securely hidden. Furthermore, the proxy network needs to run on a large resource pool and be highly distributed and fault tolerant, so it can by itself tolerate DoS attacks and shield applications. The essence of this approach is the following. It is hard to make general applications highly distributed and DoS resistant. Therefore we build proxy networks with such capabilities, which are easier to build and can be shared among applications. We use them to shield the applications. Mechanisms such as Network Address Translation (NAT) can also hide the application’s location. However, NAT boxes are vulnerable to DoS attacks, so they cannot shield applications; we will need networks of NATs to resist attacks. Current NAT technology does not scale up to support this. Our proxy networks provide a possible form of distributed NAT network. A key capability of proxy networks is location-hiding, which is a component of a complete solution to DoS attacks. It provides a “safety period”, during which an application’s location is kept secret, and infrastructure-level attacks are prevented. It can be combined with other mechanisms such as application reconfiguration, redeployment, or even mobility to effectively protect applications against infrastructure-level attacks. If applications can change their location within a safety period, they can avoid DoS attacks indefinitely. However, there is a high cost to reconfigure applications; therefore there is a strong benefit to have effective location-hiding schemes that can provide long safety periods, reducing overhead and frequency of application reconfigurations. This paper studies the capability of proxy networks to provide effective location-hiding.
Internet
Service Infrastructure Application Service UsersWe are not the only researchers exploring the use of proxy networks for enhancing application security. Others, such as Secure Overlay Services (SOS) [9] and Internet Indirection Infrastructure (i3) [10], use existing overlay networks such as Chord [16] to hide the IP addresses of important nodes. To date, we know of no modeling or effectiveness analysis of these approaches. Our analysis considers a general class of proxy networks for location-hiding (SOS [9] and i3 [10] are instances of the class), and provides an understanding of what capabilities are feasible, and the importance of different elements of proxy network design. We believe such analysis of proxy network capabilities can lead to better understanding and design guidelines for the whole class of location-hiding approaches.
In this paper, we build a formal model to characterize proxy networks, attacks, and defensive mechanisms including proxy network reconfiguration and resource recovery schemes. We use this model to study the effectiveness of the proxy network approach. Using the model, we characterize the difficulty for attackers to penetrate the proxy network and discover application location. We also characterize how quickly resources can be compromised and the effectiveness of resource recovery policies such as intrusion detection-based reactive schemes and proactive schemes that do not rely on detection. Our study leads to the following qualitative conclusions:
1. Proxy networks with random proxy migration can effectively hide applications’ IP addresses; thereby preventing infrastructure-level DoS attacks.
2. Proxy network depth and internal reconfiguration are critical to preventing attackers’ penetration.
3. The topology of proxy networks is important. Surprisingly, rich connectivity, a virtue in other circumstances, can reduce a proxy network’s ability to hide application location.
4. Reactive techniques for resource recovery are insufficient by themselves to avoid resource depletion. However, proactive schemes can successfully prevent resource depletion. The model and qualitative results provide insights into how proxy networks should be designed to effectively protect applications from DoS attacks – either by hiding their location or protecting against resource depletion. Our study intends to build a better understanding of overlay networks’ capability of location-hiding for DoS attack resistance, provide intuitions of how proxy networks should be designed, and build step stones for future studies based on more complex and realistic models in this area, rather than immediately and completely solve the DoS problem.
The remainder of the paper is structured as follows. Section 2 formulates the DoS problem and introduces our analytical models. Analytical results, insights and discussions are presented in Section 3. Section 4 discusses the implications of our analysis. Section 5 relates our work to the other studies, and then we conclude in Section 6 with a summary and a description of directions for future work.
2 ANALYTICAL MODEL
In this section, we develop an analytical model for the system. First, we give an overview of the proxy network scheme. Second, we describe the key components, including the resource pool, the proxy network, the attacks and the related defensive mechanisms. Third, we propose an analytical model to characterize these components. This model is used in Section 3 to study the DoS problem.
2.1 Proxy network scheme
Infrastructure-level DoS attacks target at the IP addresses of the victim applications. Today’s Internet applications publish their IP addresses (for example via DNS) for convenient user access via the Internet, but their published IP addresses become obvious targets in DoS attacks. We use a proxy network approach to address this problem. In our approach, applications do not publish their IP addresses, instead, they hide behind a proxy network, an overlay network that runs on a resource pool of Internet hosts. The proxy network hides the IP addresses of all the nodes inside (including internal proxies and applications); only proxies at the edge publish their IP addresses (see Figure 2). All accesses to the applications are mediated by the proxy network via edge proxies. No one can easily discover the applications’ location, thereby preventing infrastructure-level attacks.
Figure 2 Proxy Network Scheme
There are two key challenges in the proxy network scheme. First, the proxy network should hide applications’ IP addresses securely. Second, the proxy network itself should be resilient to DoS attacks, so it can shield the applications. The second challenge is more straightforward; proxies can be built as simple elements without persistent state. Without a need for strong consistency, replication schemes can be used to tolerate DoS attacks. In this paper, we focus on the first problem – location-hiding.
2.2 Resource Pool and Proxy Network
Before discussing the attacks and the defensive mechanisms, we formally describe the resource pool and the proxy network, and introduce a rigorous terminology. For simplicity, we
User Edge Proxy
Proxy Resource Pool (IP Network) Host Overlay Proxy Network App
study the case where there is only one application. We believe that our analysis can be extended to multiple applications sharing the same proxy network, but work is beyond the scope of this paper.
The resource pool consists of hosts in the Internet. We assume that the hosts can communicate directly if they have each other’s IP address, and each host is identified by a unique IP address. A node in the overlay network is either a proxy or
the application. When a node runs on a host, that host (or its IP address) is called the location of the node. We assume each
node has a unique location at any moment (an injective mapping from nodes to hosts). Two nodes are adjacent if and
only if they know each other’s location. Obviously, adjacent nodes can communicate directly through the underlying hosts at the IP level. We use a topology graph to represent the
overlay network. Vertices in the graph correspond to nodes in the overlay; edges correspond to the adjacency relationship. The minimum distance from edge proxies to the application in the topology graph is the depth of the proxy network. A
conceptual view of a proxy network with depth 3 is shown in Figure 2. The topology graph describes the connectivity of the overlay network; two nodes can communicate at the overlay level if there is a path between them in the topology graph. More importantly, the topology graph also describes how the location information is shared among the overlay nodes, a critical aspect of how securely the proxy network can hide the application’s location, because when attackers compromise a proxy node, they can locate all adjacent nodes.
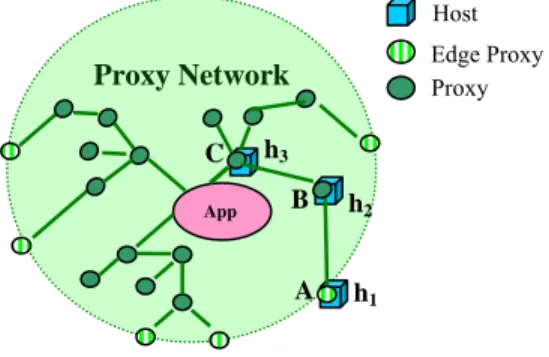
Figure 3 Proxy Network Penetration
2.3 Attacks
We focus on the use of proxy networks for location hiding. Therefore, the most important issue is host compromise
attacks, which can penetrate the proxy network and reveal an application’s location. Other attacks are considered in Section 4. In a successful host compromise attack, attackers can temporarily control the victim host and steal information from it. A host under such impact is considered compromised;
otherwise it is intact. We overload the term compromised – a
proxy is compromised if it runs on a compromised host.
At the overlay network level, host compromise attacks can reveal the location of overlay nodes. For example, in Figure 3, when proxy A is compromised, attackers expose the location
of proxy B. Repeating this process, attackers penetrate the proxy network and may eventually cause application exposure,
where the application is exposed to attackers.
At the resource pool level, host compromise attacks can cause resource loss. Unless those compromised hosts are recovered, they can no longer be used as intact resources. Host compromise attacks can eventually lead to resource depletion,
where intact hosts in the resource pool are insufficient for proxy networks to operate correctly.
Attackers can either act autonomously (uncoordinated attacks) or cooperate (coordinated attacks).
2.4 Defensive mechanisms
We have two defensive mechanisms, each of which corresponds to the key risks, application exposure and resource depletion. At the overlay network level, proxy network reconfiguration mechanisms disrupt attacker penetration, thereby helping to prevent application exposure; at the resource pool level, resource recovery/reset mechanisms convert compromised hosts to intact state, helping to avoid resource depletion.
Proxy Network Reconfiguration
Proxy network reconfiguration mechanisms dynamically change proxies’ location or structure of proxy networks, disrupting attacker penetration by invalidating location information exposed by attacks.
In this paper, we study random proxy migration, a simple form of proxy network reconfiguration. Proxies randomly change their location inside the resource pool, but do not change the topology of the proxy network. For example, in Figure 3, when proxy B migrates from h2 to another host, it will notify its neighbors A and C of its new location. With random proxy migration, proxies can move to new locations unknown to attackers, therefore disrupting attackers’ penetration. For example, suppose attackers exposed proxy B when B is on host h2. When B migrates to another host, attackers’ information about B becomes invalid (if both A and C are intact)1. Attackers cannot proceed unless they can discover B’s current location. In addition, proxy migration can move proxies from compromised hosts to intact hosts. We study the effectiveness of such schemes to prevent application exposure.
Resource Recovery/Reset
Resource recovery/reset mechanisms at the resource pool level convert compromised hosts to the intact state. There are two triggering policies, reactive recoveries and proactive resets2. In reactive recoveries, compromised hosts are only recovered after compromise is suspected or detected. Proactive resets do not depend on detection, and reset hosts into the intact state regardless of their current state. Examples of proactive resets include timer-triggered reloading of hosts with clean and up-to-date system images, updating and creating new credentials,
1 Migration of B is only effective when Proxy A and C are not compromised
at the moment. Both resource recovery/reset and proxy reconfiguration can get proxies out of compromised state by either recovering the compromised host or moving the proxy to an intact host. It is considered in our analysis.
2 “Reset” and “Recovery” here do not imply going back to a previous state.
They set the hosts into a known clean state with all the known security holes fixed. Therefore, future attackers cannot easily compromise them through the known security holes.
Proxy Network App Proxy Edge Proxy Host A B h1 h2 C h3
and so on. We study the effectiveness of both schemes to prevent resource depletion.
2.5 Stochastic Models Model of host compromise attack
We model occurrences of successful host compromises by one attacker as a Poisson process with rate λ; λ is the compromise speed and λ1 is the average time to compromise a host. To keep the model concise and simple, we assume hosts in the resource pool are widely distributed and do not have highly correlated vulnerabilities, so that one host compromise does not increase the speed of other compromises, even though the attackers are coordinated. Therefore we use the same compromise speed λ for all attacks. The probability of compromising a host within time t is given by (1− − )( ≥0).
t e λt
Model of proxy network reconfiguration
Proxies randomly migrate in the resource pool. Occurrences of migration events on any specific proxy are modeled as a Poisson process with rate µr. All proxies migrate independently at the same rate. Mathematically, the probability of a proxy migrating within time interval t is
. ) 0 ( 1− − ≥ t e µrt
Model of reactive recovery
Key attributes of reactive recoveries are true positive ratio and recovery delay. True positive ratio is the ratio of compromises that are eventually detected. Recovery delay is measured from the moment of compromise to the moment of recovery (if the compromise is eventually detected). In our model, the true positive ratio is ρ, and the expected recovery delay is .
d
µ1
Our model does not impose any specific distribution on the behavior of recovery. Any distribution capturing these two attributes (ρ and d µ1 ) 0 )( 1 ( −e−µdt t≥ ρ
) will converge to our result. In this paper, for the mathematical convenience, a scaled exponential distribution is used. The probability of a reactive recovery
within time t is given by .
Model of proactive reset
We model proactive reset events on a host as a Poisson process at rate µs. In other words, the average interval between two resets on a host is
s µ1 ) 0 )( 1 ( −e−µst t≥
, and the probability of a proactive reset within time t is given by .
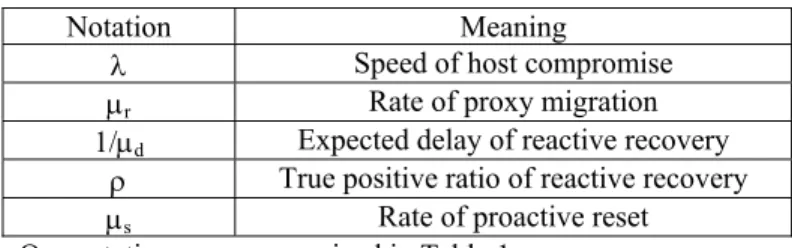
Table 1 Notations of Analytical Model
Our notations are summarized in Table 1.
Discussion
We use Poisson process to describe host compromises because it can concisely characterize the system with one parameter “speed of compromise (λ)”. The Poisson model is suitable for stochastic processes which are statistically independent of the past. When the hosts in our system are carefully maintained with all the known security holes fixed, Poisson model is a reasonable approximation. Earlier studies [11, 12] also showed that Poisson model can correctly characterize the behavior of software system with a small number of bugs. This further justifies of our model.
Because little is understood analytically about the behavior of systems under host compromise attacks, we have chosen to use simple models that enable analysis and can concisely characterize the key attributes of the system as well as build intuition. At present, complex models quickly become intractable and their results can be hard to interpret. As an initial step, we ignore many details of the system (for example correlated vulnerabilities among hosts) to make the analysis tractable. Even though this may be very different to reality, we believe our analysis still provides a fundamental understanding of the problem, which is essential to future study based on more complex and realistic models. Our study intends to build a step stone for better understanding of this problem, rather than completely solve the DoS problem.
3 ANALYTICAL RESULTS
Using the models defined in Section 2, we study the effectiveness of the proxy network scheme. We focus on the two forms of successful attacks described in Section 2.3: - Application Exposure: How much time will it take
attackers to penetrate the proxy network and expose the application? How do different parameters, such as speed of host compromise, speed of resource recovery, rate of proxy migration and topology of proxy networks, affect the effectiveness of the scheme?
- Resource Depletion: Under what circumstances it is
possible to keep the majority of the hosts intact, so that the proxy migration scheme makes sense? How effective are the resource recovery schemes against host compromise attacks?
3.1 Application Exposure
In this section, we prove that without proxy network reconfiguration, proxy networks cannot securely hide the location of the application. Then we prove that with random proxy migration, there exists a class of proxy networks that can provide effective location-hiding. Then we study how different parameters affect the effectiveness of our scheme (with a specific proxy network topology) and provide design guidelines. Finally, we discuss the impact of proxy network topology. In this section, we assume that there are sufficient intact hosts in the resource pool. The validity of this assumption is studied in Section 3.2.
Notation Meaning
λ Speed of host compromise
µr Rate of proxy migration
1/µd Expected delay of reactive recovery
ρ True positive ratio of reactive recovery
µs Rate of proactive reset
We define a proxy network to be effective if the expected time for attackers to expose the application grows exponentially with the depth of the proxy network. In other words, for
effective schemes, adding resources can significantly improve security.
3.1.1 Location hiding
Result I: Without reconfiguration, proxy networks cannot effectively hide the application’s location.
Proof of Result I:
Consider a path from an edge proxy to the application as shown in Figure 4. Let Tλ be the expected time of host compromises. Without reconfiguration, the location of proxies does not change, and the topology of the proxy network does not change. Attackers only need to compromise all the proxies on a path to the application. It is trivial that the expected time to penetrate a proxy network with depth d is dTλ; the expected time to application exposure grows linearly with d. Result I follows directly.▐
Figure 4 Path from edge proxy to application
Result II:If the majority of the hosts in the resource pool are intact, with random proxy migration, there exists a class of proxy networks that can effectively hide the location of the application.
Here is an intuitive explanation. Figure 4 shows a path from an edge proxy to the application; d is the length of that path. Initially only the edge proxy is exposed, and location of all the other proxies and the application is unknown to attackers. As described in Section 2.3, attackers can penetrate the proxy network starting from the edge proxy. If all the non-edge proxies (2 to d in the figure) can change their location periodically, then it can disrupt the penetration. For example, in Figure 4 if attackers managed to compromise proxy 2, then proxy 3 was exposed at that time. But this location information is only valid until proxy 3 migrates3, and if attackers cannot compromise proxy 3 before that time, they cannot go any further. Intuitively, if the rate of proxy migration is higher than the speed of host compromise, it is hard for attackers to penetrate the proxy network, because proxies can almost always run away before they get compromised.
To prove Result II, we need Lemma3.1.1 and Proposition3.1.2.
Lemma 3.1.1: d is the depth of a proxy network with an arbitrary topology. λ is the speed of host compromise, Tλ=λ-1 is the expected time of a host compromise. µr is the rate of
proxy migration (µr>2λ). When the majority of the hosts in
the resource pool are intact, the expected time for any
3 More precisely, if proxy 3 migrates after proxy 2 gets out of the
compromised state (proxy 2 migrated to an intact host or proxy 2’s host is recovered), attackers will lose track of proxy 3’s location.
uncoordinated attacker to expose the application is between
λ λ µ T d r) ) (( 2 2 − Θ µλ λ T d r) ) (( −1 Θ and .
Proof of Lemma 3.1.1 is in Appendix I.
Figure 5 N independent proxy chains
Proposition 3.1.2: Consider a proxy network with a topology graph shown in , where there are N paths from edge proxies to the applications, and all the N paths are independent (vertex-disjoint).When the majority of the hosts in the resource pool are intact, the expected time for coordinated attackers to expose the application is between N µλ d Tλ
r) ) ( ( 2 2 1 − Ω and λ λ µ T d N r) ) ( (1 −1 Ω
(the meaning of µr, λ, d and Tλ is the same as
in Lemma 3.1.1).
Proof of Proposition 3.1.2 is in Appendix II.
Proof of Result II:
Lemma 3.1.1 shows that the expected time for uncoordinated attackers to expose the application grows exponentially with the depth of a proxy network. Therefore, with random proxy migration, proxy networks can effectively resist uncoordinated attacks to hide the application’s location.
Proposition 3.1.2 shows that for a class of proxy networks shown in Figure 5, the expected time for coordinated attackers to expose the application grows exponentially with the depth of the proxy network. Therefore, there exist some proxy networks that can effectively resist coordinated attacks to hide the application’s location. Result II follows directly. ▐
To illustrate the effectiveness of the proxy network scheme, let us assume Tλ to be on the order of days4; namely, it may take attackers a few days to compromise a host. We consider a proxy network with depth 6. Without proxy network reconfiguration, we know from Result I that it will take about a few weeks to expose the application. With random proxy migration, if proxies migrate about once a few hours, then it will take attackers hundreds of years to expose the application.
4 We assume hosts in the resource pool are well maintained and they do not
have known bugs. Attackers will need significant amount of time to discover and study new vulnerabilities, rather than using existing automated attack tools or worms. In reality, it may take hackers more than a few days (sometimes even weeks or months) to break into remote systems.
Application N independent paths Proxy chain Length d 1 2 3 d Application Proxies Edge Proxy
3.1.2 Parametric Analysis
In this section, we study how different parameters affect the effectiveness of the proxy network scheme. First Result III qualitatively describes the impact of different parameters. Then an extensive parametric study illustrates the impact of each parameter.
Result III: Proxy migration rate and depth of proxy networks are the key factors to stop attackers’ penetration; linear increase in the depth of the proxy network exponentially increases the time to application exposure.
Proof of Result III:
Result III follows directly from Lemma 3.1.1 and Proposition 3.1.2. ▐ 0 20 40 60 80 100 100 102 104 106 108 1010
Proxy Migration Rate µr (unit: compromise speed λ)
E x pe c ted T im e t o A p p lic at io n E x p o s u re ( u n it : Tλ )
∞ attackers, Perfect Recovery one attacker, Perfect Recovery
∞ attackers, No Recovery one attacker, No Recovery
proxy chain depth d = 5
0 10 20 30 40 50 60 70 80 90 100 100 105 1010 1015 1020
Proxy Migration Rate µr (Unit: Speed of Compromise λ)
Ex pec te d T im e t o A ppl ic at io n E x pos u re ( u ni t: Tλ )
∞ attackers, Perfect Recovery one attacker, Perfect Recovery
∞ attackers, No Recovery one attacker, NoRecovery proxy chain depth d = 10
Figure 6 Impact of Proxy Migration Rate
To illustrate the impact of different parameters, such as proxy migration rate, proxy network depth, speed of resource recovery and number of coordinated attackers, we consider a proxy network with a linear chain topology, and plot the expected time to application exposure as a function of these parameters. To understand the impact of resource recovery schemes, we plot two boundary cases: no recovery and perfect recoveries, which immediately recover a host after its compromise. To understand the impact of coordinated attackers, we plot the two boundary cases “∞ attackers” and “one attacker”. “∞ attackers” corresponds to the highest penetration speed attackers can achieve on a linear chain with
sufficiently many coordinated attackers. “One attacker” corresponds to the case of a single attacker. Therefore the plots provide a set of envelopes for general cases (different resource recovery schemes and any coordinated attacks). Figure 6 shows how the proxy migration rate affects the expected time to application exposure (d=5 and d=10 respectively as shown in the two graphs; d is the depth of the proxy network). From Figure 6 we can clearly see the trend that the expected time to application exposure significantly increases as migration rate increases (note that Y-axis is log scale). In fact, it increases at a polynomial rate with d as the exponent. For example, when d = 10, by doubling the migration rate, the time to exposure becomes three orders of magnitude longer.
Figure 7 shows the impact of proxy network depth. Similar to Figure 6, the plots are the boundary cases. The expected time to application exposure increases exponentially as the depth increases. For attackers, it means that each step further into the proxy network becomes exponentially harder than all the work they did before; and will quickly become intractable when depth gets fairly large. To illustrate the speed of growth, suppose attackers can compromise a host in a day, and proxies migrate 10 times a day. To penetrate a proxy network with a depth of 4 may take a few years; a depth of 6 may take a few hundred years; a depth of 10 may take a few million years, which practically means it will never happen. Therefore, depth of the proxy network is an effective barrier to stop attackers’ penetration. 2 4 6 8 10 12 14 16 18 20 100 105 1010 1015 1020
Proxy Chain Length (d)
Expe ct e d T im e T o Ap pl ic a ti o n Expo sur e (u ni t: Tλ
) inf attackers, No Recovery inf attackers, Perfect Recovery one attacker, Perfect Recovery one attacker, No Recovery
µr/λ = 10
Figure 7 Impact of Proxy Chain Depth
From Figure 6 and Figure 7, we can see that both the proxy network depth and the proxy migration rate have significant impact on the effectiveness of the proxy network scheme. The depth of the proxy chain is the most dominant factor.
Resource recovery schemes and the number of coordinated attackers have limited impact on the overall security. By adjusting the proxy migration rate or the proxy chain depth, we can amortize the negative impact coming from those sources, as long as the majority of hosts are intact in the resource pool. However, this result does not imply good resource recovery schemes are unnecessary. Good recovery schemes are certainly favorable as shown in Figure 6 and
Figure 7. With better resource recoveries, we can use a smaller proxy network depth or a lower migration rate to achieve same level of security more efficiently. More importantly, as discussed in Section 3.2, the resource recovery schemes have unique impact at the resource pool level.
3.1.3 Impact of Proxy Network Topology
The topology of proxy networks is important. As discussed above, the depth of proxy networks is a dominant parameter. Besides that, the connectivity of proxy networks also has significant impacts on how much parallelism attackers can exploit to speed up application exposure. Previous discussion is based on a specific class of proxy network topology (Figure 5), where all paths from the edge proxies to the application are independent (Claim 3.1.3). For general topology, we have the following result.
Result IV: Rich connectivity increases the penetration probability for attackers and shortens time to application exposure. If the connectivity is sufficiently high, the proxy network can no longer effectively hide the location of the application.
Intuitively, in a richly connected topology, there are more paths leading to the application. Therefore, there is more parallelism attackers can exploit. Furthermore, vertex degree (number of edges that touch the vertex) is typically high in a richly connected topology. That favors attackers, because compromising one proxy can expose a large number of proxies.
Figure 8 A proxy network topology (R=3)
A complete formal proof involves deep mathematic theory. It is beyond the scope of this paper, and will be addressed in our future work. Here we give an informal proof for a special case. Consider a regular graph (Figure 8), where all vertices (except the edge proxy and the proxies adjacent to the application) have degree R. Attackers’ penetration can be considered as a series of retrials, with the edge proxy as the starting point. A trial succeeds if attackers reach depth d. The penetration probability depends on the probability of success in each trial. We study one such trial and show how vertex degree R affects this probability. For simplicity, we only consider the case with perfect resource recoveries.
Mathematically, this problem is a branching process [13]. Consider any pair of adjacent proxies, for example A and B in Figure 8. Let q be the conditional probability of B being eventually compromised if A is compromised. Without retrials, it is straightforward to prove that
r
µ λ+λ
=
q . Applying
results in [13], we can compute the penetration probability. Figure 9 plots how vertex degree affects the penetration probability. It shows that proxy networks with higher vertex degrees are easier to be penetrated.
2 4 6 8 10 12 14 16 18 20 0 0.05 0.1 0.15 0.2 0.25 0.3 0.35 0.4 0.45 0.5
Vertex Degree of Proxy Network Topology (R)
P ene tration P robabil ity µr=λ µr=2λ µr=4λ µr=8λ µr=16λ
Depth of proxy network is 10
Figure 9 Impact of Vertex Degree
Furthermore, from the properties of branching processes [13], we know that q(R-1) is a criticality metric. It is qualitatively different on each side of the critical points. In the sub-critical case (q(R-1)<1), the depth of the proxy network is a theoretical barrier to stop penetration; the probability to penetrate a large depth can be arbitrarily small. On the other hand, in the super-critical case (q(R-1)>1), the depth of the proxy network is no longer an effective barrier to stop attackers’ penetration; attackers can reach any depth with a non-trivial probability if given enough time. The topologies discussed in previous sections are in fact in the sub-critical case. When choosing a proxy network topology, the sub-critical case is more favorable.
To summarize Section 3.1, we first proved it necessary to have some form of reconfiguration mechanisms in the proxy network scheme. Then we proved that our proxy network scheme with random proxy migration can effectively prevent attackers’ penetration and securely hide the application’s location. With appropriate proxy network topologies, the depth of the proxy network is a dominant factor to the overall security, and the proxy migration rate have a significant impact. Choosing these parameters appropriately can effectively stop attackers’ penetration. Topology of the proxy network is also important. Rich connectivity can increase the penetration probability and can qualitatively reduce the effectiveness of the proxy network scheme.
3.2 Resource Depletion
All the previous discussions are based on the assumption that we can somehow keep the majority of the hosts intact. This section studies the validity of this assumption.
Application Proxy network depth d edge proxy A B
Result V:Reactive recoveries alone are insufficient to avoid resource depletion.
Result VI: When proactive resets, which do not rely on detection, are used, it is possible to keep the majority of hosts intact in the resource pool.
0 1000 2000 3000 4000 5000 6000 7000 8000 9000 10000 0 0.1 0.2 0.3 0.4 0.5 0.6 0.7 0.8 0.9 1
Time (unit: expected time to compromise one host)
P e rc en ta ge of i n ta c t hos ts i n r e s o ur c e po ol µ d=∞, ρ=0.99 µ d=∞, ρ=0.995 µ d=∞, ρ=0.999
Attackers can concurrently attack up to 10% of the hosts (m=0.1) 0 1000 2000 3000 4000 5000 6000 7000 8000 9000 10000 0 0.1 0.2 0.3 0.4 0.5 0.6 0.7 0.8 0.9 1
Time (unit: expected time to compromise one host)
P e rc en ta ge of i n ta c t hos ts i n r e s o ur c e po ol m=0.1 m=0.3 m=0.5 m=1.0 µ d=∞, ρ=0.999 ⎪⎩ ⎪ ⎨ ⎧ > = ≤ ≥ ∞ → 1 1 1 2 ) ( lim ) ( C m when C t f C m when C t f t
Figure 10 Resource depletion w/o proactive reset
Lemma 3.2.1: Assume initially all hosts are intact. Let m be the percentage of hosts attackers can concurrently attack, and f(t) be the expected percentage of intact hosts in the resource pool. We know where ⎪ ⎪ ⎩ ⎪⎪ ⎨ ⎧ − − + − = − + + + = − m m C C s s d s s d µ ρ λ µ µ λρ µ ρ λ µ µ λρ ) 1 ( 1 ) ) 1 ( 1 ( 2 1 1 0 ) ( = 1= 2 = ∞ → f t C C .
Proof of Lemma 3.2.1 is in Appendix III.
Proof of Result V:
From Lemma 3.2.1, we can see that when there are only reactive recoveries (µs=0), lim
t if ρ<1. In
practice, ρ is always less than 1; therefore all hosts will eventually be compromised in this case. Result V is proved.▐ Intuitively, because not all intrusions are detected (ρ<1), reactive recoveries cannot recover all the compromised hosts; the residues accumulate over time and eventually cause
resource depletion. Figure 10 shows that even if we have almost perfect detectors, which can detect almost all compromises (>99%) and instantaneously recover all the detected compromises, the percentage of intact hosts still drops fairly fast and eventually goes zero. It is worse when attackers can attack more hosts concurrently or the resource pool is smaller.
Proof of Result VI:
When the resource pool is sufficiently large such that m≤C1, from Lemma 3.2.1, we know that the percentage of intact hosts is always higher than C2. By appropriately choosing µs,
µd, ρ and the size of the resource pool, C2 can be arbitrarily close to 1. Namely, the majority of the hosts are intact in the resource pool. Therefore Result VI is proved.▐
0 1000 2000 3000 4000 5000 6000 7000 8000 9000 10000 0.988 0.99 0.992 0.994 0.996 0.998 1
Time (unit: time to compromise one host)
P e rc en tage of i n ta ct host i n resourc e pool µ d=∞, ρ=0.99 µd=∞, ρ=0.995 µd=∞, ρ=0.999 Attackers can concurrently attack 10% of the hosts (m=0.1) µ s=0.1λ 0 2000 4000 6000 8000 10000 0.99 0.992 0.994 0.996 0.998 1
Time (unit: expected time to compromise one host)
P e rc e n ta ge of i n tact ho s ts in re sou rc e po ol µd=∞, ρ=0.999, µs=0.1λ m=0.1 m=0.3 m=0.5 m=1.0
Figure 11 Resource availability with proactive reset
Figure 11 shows the impact of proactive reset. A proactive reset at a low rate (10 times slower than speed of compromise) is added to the cases in Figure 10. This small input fundamentally changed the system behavior. Now the percentage of intact hosts stabilizes at a number close to 1. Namely, the resource pool can keep almost all of the hosts intact over infinite time. This proves the need for proactive schemes that do not rely on detection.
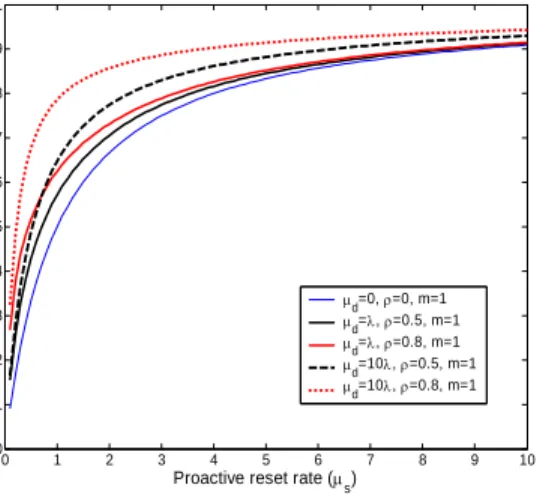
shows that it is possible to avoid resource depletion with proactive resets. The Y-axis is the percentage of intact hosts in a stabilized system. It plots the worst case where attackers can concurrently attack all the hosts in the resource pool (m=1). It shows that even if no reactive recoveries are used
(µd=0, ρ=0), proactive resets can still keep a significant percentage of hosts intact. With reactive recoveries, proactive resets at fairly low rates can keep most hosts intact. The reactive recoveries shown in are realistic. Results from [14, 15] show that state of art intrusion-detection systems can achieve better than this.
0 1 2 3 4 5 6 7 8 9 10 0 0.1 0.2 0.3 0.4 0.5 0.6 0.7 0.8 0.9 1
Proactive reset rate (µs)
P e rc ent a ge of i n ta c t hos ts i n r e s our c e pool µ d=0, ρ=0, m=1 µ d=λ, ρ=0.5, m=1 µ d=λ, ρ=0.8, m=1 µ d=10λ, ρ=0.5, m=1 µd=10λ, ρ=0.8, m=1
Figure 12 Proactive reset rate vs. intact host percentage
3.3 Summary
In this section, we studied the effectiveness of the proxy network scheme, and focused on two threats in particular: application exposure and resource depletion. We proved it necessary to have reconfiguration in the proxy network to hide application’s location. Then we proved that with random proxy migration, our proxy network scheme can securely and effectively hide the application’s location; we also proved that it is possible to keep most hosts in the resource pool intact. Combining these results, we have shown that our proxy network scheme is a feasible approach to securely hide application’s location, thereby preventing infrastructure-level DoS attacks.
In our study, we also derived following design guidelines. 1. Proxy network depth is a dominant factor to location-hiding; proxy migration rate also has significant impact. With appropriate proxy network topology, these two factors can effectively stop attackers’ penetration.
2. The topology of proxy networks is important. Surprisingly, rich connectivity, a virtue in other circumstances, may reduce the effectiveness of proxy networks.
3. Reactive resource recoveries are insufficient by themselves to avoid resource depletion. Proactive schemes that do not rely on detection are necessary.
4 DISCUSSION
We have proved that the proxy network scheme is a feasible approach to location-hiding. Our results have several implications to similar approaches that use overlay networks to hide the location of important nodes (secret nodes).
First, such overlay networks need to have some form of reconfiguration to prevent attackers’ penetration. Without it, the approach is fundamentally vulnerable to host compromise
attacks. Current approaches, such as SOS [9] and i3 [10], which do not have any active reconfiguration mechanisms in the overlay network, have this weakness.
Second, the secret nodes should be placed at the core of the overlay network, far away from the edge nodes in the topology graph. Caching the IP address of overlay nodes to shorten the route between overlay nodes, as suggested in i3 [10], can decrease the depth of the overlay network, therefore severely undermine the effectiveness of the scheme.
Third, the overlay network should have the least connectivity necessary to maintain good connection between the edge nodes and the secret nodes. General purpose overlays, such as Chord [16], that have high vertex degrees, may not be suitable. We have shown that rich connectivity is not favorable for security. But good connectivity is necessary to tolerate failures, keeping applications reachable from users. So there is a balance between security and failure tolerance. How to choose an optimal topology is part of our future work. This paper only brings up the point that more connectivity in the proxy network is not always good, and warns against careless use of existing overlays, such as Chord, that are designed for completely different purposes.
Last, to maintain a resource pool of hosts, intrusion detection-based reactive recoveries alone are insufficient. Routine maintenance and occasional resets are critical over a long period of time. Furthermore, all the hosts in the resource pool need to be carefully and independently administrated, and regularly updated with security patches, so that they are less likely to share vulnerabilities. Otherwise, when hosts have correlated vulnerabilities, attackers can easily compromise a large number of hosts in a short while; it can greatly undermine the effectiveness of the scheme. For this reason, collecting home PCs scattered in the Internet to construct a resource pool may not be appropriate.
We only studied host compromise attacks in this paper. Other attacks can also discover application’s location. But they are not major threats to the system. We briefly describe them below.
- Traffic analysis on the proxy network at Internet scale helps attackers to locate the application. But we do not consider it as a realistic threat, because it requires a prohibitive amount of resource and cooperation from major ISPs.
- Espionage on secret configuration and deployment information of the proxy network also helps attackers to locate the application. We resort to appropriate administrative policies and legislative means to prevent this type of attacks and punish the perpetrators.
5 RELATED WORK
Effectively resisting denial-of-service attacks is an important open problem. There are many ongoing studies, which can be categorized into two approaches: preventive and tolerant approaches. Preventive approaches try to stop or deter attacks from the source, which include Intrusion detection systems
[17-22], network ingress filtering [23] and IP trace-back schemes [24-27]. Tolerant approaches focus on mitigating the attack impact on the victim by means of system reconfiguration [28], resource isolation [28, 29] or load balance [30-33].
Many researchers are exploring the use of overlay networks to tolerate or avoid DoS attacks. The Secure Overlay Services (SOS) project [9] in Columbia University is one of them. They use Chord [16] in the overlay network to provide some amount of anonymity to hide the location of secret “servlets”. There are primitive analytical results about the system security under simple attack models such as DoS attack on individual hosts. However, the analysis is tied to their Chord-based SOS design and they did not consider host compromise attacks, which are the main threat to their scheme. Internet Indirection Infrastructure (i3) [10] also suggested the use of Chord overlay network to hide the location of the application. They did not consider host compromise attacks and they did not fully analyze the effectiveness of their scheme. To our knowledge, our work is the first attempt of a thorough analysis in this area.
Here we have studied how to hide application location. Interestingly a complementary problem, hiding user identity, has been well studied since the early eighties. The solutions range from the early mix email server [34], to distributed Onion Routing schemes [35], and to the more recent Peer-to-Peer schemes such as Tarzan [36] and Pasta [37]. A key difference between the two problems is that there are many users in the system while there are only a handful of applications. Most of the schemes are based on the idea of mixing all input from all users so that an outsider cannot associate a particular message to a particular user. Another key difference is that user initiates the communication. In some schemes, such as Onion Routing [35], senders need to construct a route to the receiver before hand. These key differences make the two problems incomparable, and solutions in that area do not apply directly.
6 SUMMARY AND FUTURE WORK
We built a formal framework to rigorously study the properties of the system. Based on our analytical models, we have the following results.
1. Proxy networks with random proxy migration can effectively hide applications’ IP addresses; thereby preventing infrastructure-level DoS attacks.
2. Proxy network depth and internal reconfiguration are critical to preventing attackers’ penetration.
3. The topology of proxy networks is important. Surprisingly, rich connectivity, a virtue in other circumstances, can reduce a proxy network’s ability to hide application location.
4. Reactive techniques for resource recovery are insufficient by themselves to avoid resource depletion. However, proactive schemes can successfully prevent resource depletion. Future work includes the following.
1. More extensive study on the relationship between proxy
network topology and security (hiding application’s location) and failure resilience (maintaining connectivity) with the objective of guiding the design of an optimal proxy network topology.
2. Study of other forms of proxy network reconfigurations which achieve comparable levels of security at lower performance overheads.
3. Study of how (DoS or host compromise) attacks on one host affect other hosts in the resource pool, when hosts do share vulnerabilities (a new compromise model).
REFERENCE
1. CERT, "Code Red II:" Another Worm Exploiting Buffer Overflow In IIS Indexing Service DLL. 2001. http://www.cert.org/incident_notes/IN-2001-09.html
2. CERT, "Code Red" Worm Exploiting Buffer Overflow In IIS Indexing Service DLL. 2001. http://www.cert.org/incident_notes/IN-2001-08.html
3. CERT, CERT® Advisory CA-2003-04 MS-SQL Server Worm. 2003. http://www.cert.org/advisories/CA-2003-04.html
4. Williams, M., EBay, Amazon, Buy.com hit by attacks. 2000.
http://www.nwfusion.com/news/2000/0209attack.html
5. Fonseca, B., Yahoo outage raises Web concerns.
2000.http://www.nwfusion.com/news/2000/0209yahoo2.html
6. Miller, J., 2004 IT budget request focuses on homeland defense, cybersecurity, in Government Computer News. 2003.
http://www.gcn.com/vol1_no1/homeland/20903-1.html
7. Frank, D., Cybersecurity called key to homeland defense. 2001,FCW.COM.
http://www.fcw.com/fcw/articles/2001/1001/news-cyber-10-01-01.asp
8. Schneider, F.B., Trust in Cyberspace. 1999: National Academy Press. 331.
9. Keromytis, A.D., V. Misra, and D. Rubenstein. SOS: Secure Overlay Services. in ACM SIGCOMM'02. 2002. Pittsburgh, PA: ACM.
10. Stoica, I., et al. Internet Indirection Infrastructure. in SIGCOMM. 2002.
Pittsburge, Pennsylvania USA.
11. Littlewood, B., Predicting software reliability. Phil. Trans. R. Soc., 1989.
327: p. 513-527.
12. Adams, E.N., Optimizing preventive service of software products. IBM Journal of Research and Development, 1984. 28(1): p. 2-14.
13. Harris, T.E., The Theory of Branching Processes. 1963: Prentice-Hall Inc.
14. Lippmann, R.P., et al. Evaluating Intrusion Detection Systems: the 1998 DARPA Off-Line Intrusion Detection Evaluation. in Proceedings of the 2000 DARPA Information Survivability Conference and Exposition. 2000.
15. Lippmann, R., et al., The 1999 DARPA Off-Line Intrusion Detection Evaluation. 2000, MIT Lincoln Lab
16. Stoica, I., et al. Chord: A Scalable Peer-to-peer Lookup Service for Internet Applications. in ACM SIGCOMM'01. 2001.
17. Vigna, G. and R.A. Kemmerer, NetSTAT: a network-based intrusion detection system. Journal of Computer Security, 1999. 7(1): p. 37-71. 18. Axelsson, S., Intrusion Detection Systems: A Survey and Taxonomy. 2000,
Chalmers University of Technology: Goteborg, Sweden
19. Cowan, C., et al. Automatic Detection and Prevention of Buffer-Overflow Attacks. in the 7th USENIX Security Symposium. 1998. San Antonio, TX. 20. Kim, G.H. and E.H. Spafford, Experiences with Tripwire: Using Integrity Checkers for Intrusion Detection. 1995, Purdue University
21. Kumar, S. and E.H. Spafford. A Pattern Matching Model For Misuse Intrusion Detection. in Proceedings of the 17th National Computer Security Conference. 1994.
22. Wagner, D. and D. Dean. Intrusion detection via static analysis. in 2001 IEEE Symposium on Security and Privacy. 2001. Oakland, CA, United States: Proceedings of the IEEE Computer Society Symposium on Research in Security and Privacy 2001..
23. Ferguson, P. and D. Senie, Network Ingress Filtering: Defeating Denial of Service Attacks which employ IP Source Address Spoofing. The Internet Society, 1998.
24. Snoeren, A.C., et al. Hash-based IP traceback. in ACM SIGCOMM 2001- Applications, Technologies, Architectures, and Protocols for Computers Communications-. 2001. San Diego, CA, United States: Computer Communication Review. v 31 n 4 2001.
25. Song, D.X. and A. Perrig. Advanced and authenticated marking schemes for IP traceback. in 20th Annual Joint Conference of the IEEE Computer and Communications Societies. 2001. Anchorage, AK, United States: Proceedings - IEEE INFOCOM. v 2 2001.
26. Stone, R. An IP Overlay Network for Tracking DoS Floods. in the 2000 USENIX Security Symposium. 2000. Denver, CO.
27. Savage, S., et al., Practical network support for IP traceback. Computer
Communication Review, 2000. 30(4): p. 295-306.
28. Mutable Services, New York University.
http://www.cs.nyu.edu/pdsg/projects/mutable-services/mutable-services.htm
29. Spascheck, O. and L.L. Peterson. Defending Against Denial of Service Attacks in Scout. in The 3rd symposium on operating systems design and implementation. 1999.
30. Welsh, M., D. Culler, and E. Brewer. SEDA: An Architecture for Well-Conditioned, Scalable Internet Services. in The 18th symposium on Operating Systems Principles. 2001.
31. Robust Networks, Princeton University.
http://www.cs.princeton.edu/nsg/robust/
32. Websphere Edge Services Architecture, IBM.
http://www-3.ibm.com/software/webservers/edgeserver/doc/esarchitecture.pdf
33. Network Load Balancing Technical Overview -- Microsoft Application Center, Microsoft Corporation.
http://www.microsoft.com/technet/treeview/default.asp?url=/technet/prodtech nol/acs/Default.asp
34. Chaum, D.L., Untraceable Electronic Mail, Return Addresses, and Digital Pseudonyms. Communications of the ACM, 1981. 24(2): p. 84-90.
35. Reed, M.G., P.F. Syverson, and D.M. Goldschlag, Anonymous Connections and Onion Routing. IEEE Journal on Selected Areas in Communication Special Issue on Copyright and Privacy Protection, 1998.
36. Freedman, M.J., et al. Introducing Tarzan, a Peer-to-Peer Anonymizing Network Layer. in 1st International Workshop in Peer-to-Peer Systems (IPTPS'02). 2002. Cambridge, Massachusetts.
37. Elnikety, S., et al., Pasta: Anonymous Peer-to-Peer Email System. 2002,
Rice University
APPENDIX I. PROOF OF LEMMA 3.1.1
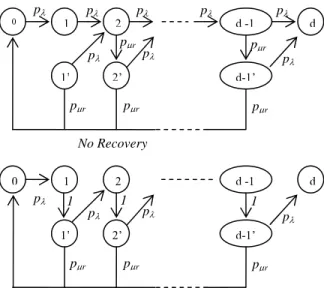
In this case, we consider a single attacker who attacks one host at a time. Since no proxies run on same hosts at the same time, at most one proxy can be under attack at any moment in this scenario. We consider a path from an edge proxy to the application as shown in Figure 4. The Markov state transition graph is shown in Figure 13.
Figure 13 Markov State Transition (One Attacker)
pλ is the probability of compromising one host within unit time ∆t (pλ-1 is the
expected time of compromising a host); pµr is the probability of a proxy
migration within unit time. In state 0, only the edge proxy is exposed. In state k (1≤k≤d), the kth proxy is compromised. In state k’ (1≤k<d), the kth proxy is not compromised, but the (k+1)th proxy is exposed. We study the expected time from state 0 to reach state n in two boundary scenarios: no recovery and perfect recovery. When there is no recovery, a proxy will stay compromised until it migrates. With perfect recovery, hosts are instantaneously recovered (in the state transition graph, state k goes to state k’ with probability 1).
(A) No Recovery
Tk denotes the expected time to reach state n from state k (k≤d). Obviously,
Td = 0 and we want T0. It is straightforward to get a set of linear equations:
⎪ ⎪ ⎪ ⎩ ⎪⎪ ⎪ ⎨ ⎧ − − + + + = − − + + + = − − + + + = − + + = − + + = + + ' 0 1 ' ' 1 ' 1 0 2 ' 1 1 2 1 0 1 0 ) 1 ( 1 ) 1 ( 1 ) 1 ( 1 ) 1 ( 1 ) 1 ( 1 k r r k k k r k r k k r r T p p T p T p T T p p T p T p T T p p T p T p T T p T p T T p T p T µ λ µ λ µ λ µ λ µ λ µ λ λ λ λ λ (I) (1<k<d).
From (I), we get
⎪ ⎪ ⎪ ⎪ ⎩ ⎪ ⎪ ⎪ ⎪ ⎨ ⎧ = ⎪⎩ ⎪ ⎨ ⎧ < < + + = = < − + + = + λ µ λ p p x n k x x k b d k T b T b b p T r k k k k k k ) 0 ( ) 1 ( 2 11 ( 0) ) ( ) 1 ( 1 2 0 1 (II).
Solve (II), we have
) 1 ( 1 2 1 1 2 0 − − − = − − y y y p d d λ T , where x x y 2 1 ) 1 ( 2 + + = . (B) Perfect Recovery
Similar analysis can lead us to a set of linear equations in the same form as
(II), but in this case
x
bk . Solving it, we get
+ = 1 1 x x p T d 1 ) 1 ( 1 0 − + = λ . 0 1 2 d -1 d 1’ 2’ d-1’ pλ pλ pλ pλ pλ pλ pλ pλ pµr pµr pµr pµr pµr No Recovery 0 1 2 d -1 d 1’ 2’ d-1’ pλ pλ pλ pλ 1 1 pµr pµr pµr Perfect Recovery 1
Results from (A) and (B) holds for any unit time ∆t. Therefore, we have λ µ λ µ r t p p x= r = → ∆lim0 and t pλ λ Tλ = = → ∆ 1 1 lim 0 . So λ µ p p x= r λ λ µ T T (( r)d 1)
0 =Θ − for perfect recovery and T0=Θ((2µλr)d−2)Tλ for
no recovery. Lemma 3.1.1 is proved▐
APPENDIX II. PROOF OF PROPOSITION 3.1.2
First we prove the following Lemma.
Lemma II.1: Consider a proxy network with a linear chain topology as shown
in Figure 4. Let d be the length of the chain. λ is the speed of host compromise, and Tλ=λ-1 is the expected time of a host compromise. µ
r is the
rate of proxy migration (µr>2λ). When the majority of the hosts in the
resource pool are intact, the expected time for coordinated attackers to expose the application is between ((µλr)d 2)Tλ
2 − Θ and ((µλr)d−1)Tλ ⎪ ⎪ ⎪ ⎩ ⎪⎪ ⎪ ⎨ ⎧ − − + + + + = > − − + + + = − − + + + + = − + + = − + + = − + + ' ' 1 1 ' ' 1 ' 1 0 1 2 ' 1 1 2 1 0 1 0 ) 2 1 ( ) ( 1 ) 1 ( ) 1 ( 1 ) 2 1 ( ) ( 1 ) 1 ( 1 ) 1 ( 1 k r k r k k k k r k r k k r r T p p T p T T p T k T p p T p T p T T p p T p T T p T T p T p T T p T p T µ λ µ λ µ λ µ λ µ λ µ λ λ λ λ λ Θ .
Proof of Lemma II.1:
In this case, we assume attackers can concurrently attack all the exposed proxies and the proxy network is a linear chain of proxies as shown in Figure 4. Markov state transition graph is shown in Figure 14. We use the same set of notation as in Appendix I.
Figure 14 Markov State Transition (Multiple Attackers) (A) No Recovery
From the state transition graph, we can get
Solve it, we get ) 1 ) ( 1 1 1 ) ( 1 1 ) ( ) 1 ) (( 1 ) ( 1 ) ( 1 ) ( 1 ( 1 2 2 2 2 2 1 2 2 1 2 0 − − + + − + + − − + − − + = − − x x x x d x x d x d x x p T λ where λ µ p p x= r . (B) Perfect Recovery
With similar analysis, we get
) 1 1 ) 1 ( )( 1 2 ( ) 1 )( 1 1 ( 1 2 0 − − − − − + + − − + + = x d x x x p x x x p p T d d λ λ λ , where
. With the same method used in Appendix I, we can get
λ λ µ
T T (( r)d 1)
0=Θ − for perfect recovery and T0 =Θ((2µλr)d−2)Tλ for
no recovery. ▐ 100 101 102 103 104 102 103 104 105 106 107 108 Number of Paths Ex p e c ted T im e * N u m b er of P a ths Depth = 3 Depth = 4 Depth = 5 Depth = 6 Depth = 7 Depth = 8 µ r/λ = 10, perfect recovery 100 101 102 103 104 101 102 103 104 105 Number of Paths E x pec ted T im e * N u m ber of P a th s Depth = 3 Depth = 4 Depth = 5 Depth = 6 Depth = 7 Depth = 8 µ r/λ=10, No Recovery
Figure 15 Impact of Independent Paths
Now we study a proxy network with topology shown in . A general proof is beyond this paper. Here we present a set of numerical results in Figure 15 to validate Proposition 3.1.2. From the Markov state transition graphs in Figure 14, we can obtain the transition matrix. Using this matrix, we numerically compute the expected time of application exposure. T0 and T are respectively
the expected time to application exposure when attackers penetrate from one path and when attackers penetrate from N independent paths. In Figure 15, the X-axis is number of paths N, and the Y-axis is N*T. From the figure we know that N*T≥T0 for both boundary cases. We claim (without proof) that
N*T≥T0 is true for any general case within the boundary. Using Lemma II.1,
we know that T0 is between Θ((µ2λr)d−2)Tλ and Θ((µλr)d−1)Tλ .
Therefore, Proposition 3.1.2 follows. ▐
APPENDIX III. PROOF OF LEMMA 3.2.1
Figure 16 shows the state transition graph of hosts in the resource pool. f(t) denotes the expected percentage of intact hosts in the resource pool; g(t) denotes the expected percentage of the compromised hosts that can eventually be detected; and h(t) denotes the expected percentage of compromised hosts that can never be detected. m is the percentage of hosts concurrently attacked.
There are two cases: m>f(t), denoted as world Φ1 and f(t) in this case is
denoted by fΦ1(t); m≤f(t), denoted as world Φ2 and f(t) in this case is denoted
by fΦ2(t). In world Φ1, attackers can concurrently attack all intact hosts; in
world Φ2, m bounds attackers’ capability.
0 1 2 d -1 d 1’ 2’ d-1’ pλ pλ pλ pλ pλ pλ pλ pλ pµr pµr pµr pµr No Recovery 0 1 2 d -1 d 1’ 2’ d-1’ pλ pλ pλ pλ 1 1 pµr pµr pµr Perfect Recovery 1 pλ pλ pλ pλ pµr
Figure 16 State Transition Graph
We first prove lemma III.1 and lemma III.2.
Lemma III.1: 1 ) ( lim 1 t C f t→∞ Φ = when f(0)+g(0)+h(0)=1, where 1 (1 −1 + + = s s d C µ µ µ λρ ) ) 1 ( − +λ ρ .
Proof: From Figure 16, we can get the following differential equations:
⎪ ⎪ ⎩ ⎪⎪ ⎨ ⎧ − − = + − = + + + − = ) ( ) ( 1 ) ( ) ( ) ( ) ( ) ( ) ( ) ( ) ( ) ( ) ( t g t f t h t g t f t h t g t f s d dt t dg s s d dt t df µ µ ρλ µ µ µ λ 1 1 1 1 2 1(t) Ae Be C fΦ = ϕt+ ϕt+
Solve them, and we can get the following result:
, where ϕ1<0 and ϕ2<0 and 1 (1 + (1− ))−1 + + = s s d C µ ρ λ µ µ λρ
. This result holds when
f(0)+g(0)+h(0)=1. C1, ϕ1, ϕ2, A1, B1 are all constants, then Lemma III.1
follows.▐ Lemma III.2: m m C t f s s d t µ ρ λ µ µ λρ (1 ) 1 ) ( lim 2 2 − − + − = = Φ →∞ . Furthermore, if
fΦ2(0)=1, g(0)=h(0)=0, then for any t>0, fΦ2(t)≥C2.
Proof: From Figure 16, we can get the following equations:
⎪ ⎪ ⎩ ⎪ ⎨ − − = + − = ) ( ) ( 1 ) ( ) ( ) ( ) ( t g t f t h t g m d s dt t dg ρλ µ µ ⎪ ⎧ () =− +( + ) ()+ () t h t g m d s s dt t df λ µ µ µ 2 ) ( 2 2 ) ( 2 t Ae B e C f = − st+ − d+ st+ Φ µ µ µ
Solve them, we have
where ⎪ ⎪ ⎪ ⎩ ⎪ ⎪ ⎨ + − − − = − + = m m C g m B s d s s d s ) ( ) 1 ( 1 ) 0 ( ) ( 2 2 µ µ ρλ µ λ ρ µ µ ρλ ⎪ ⎧ − − = m h A2 (1 ) (0) µ λ ρ
If g(0)=h(0)=0, then A2>0 and B2>0; therefore, for any t>0, fΦ2(t)>C2. ▐
Proof of Lemma 3.2.1: Let s s d µ ρ λ µ µ λρ ( + = ϖ (1 ) ) − + , so ϖ + = 1 1 C 1 ) ( 1 t C f t and C2=1-ϖm.
1) When 0≤m≤C1, with some algebra we can get C2≥C1. Because m<1 and
f(0)=1, f(t) starts in world 2 and stays there as long as f(t)≥m. From Lemma
III.2, ∀t>0 f(t)≥C2≥C1≥m, therefore it stays in Φ2. The first part of Lemma
3.2.1 is proved.
2) When m>C1, similarly we can get m>C1>C2. From Lemma III.1 and III.2
we know that ∃t* such that ∀t>t* f(t)=f
Φ1(t). Therefore 1 lim ) ( lim f t t = = Φ ∞ → ∞
→ . The second part of Lemma 3.2.1 is
proved.▐ f(t) g(t) h(t) µd+µs µs (1-ρ)λ ρλ