summary
youth barometer 2012
Youth barometer 2012
SamI mYLLYNIemI
Sami Myllyniemi Youth Barometer 2012 Summary
Ministry of Education and Culture Youth Research Network
Advisory Council for Youth Affairs Layout design: Sole Lätti
Cover: Amanda Vähämäki Layout: Ari Korhonen
© Ministry of Education and Culture, Youth Research Network, Advisory Council for Youth Affairs, and authors
ISBN 978-952-5994-54-4 ISBN 978-952-5994-55-1 (PDF)
Publications of the National Advisory Council for Youth Affairs ISSN 1455-268X, No. 51
Internet Publications of the National Advisory Council for Youth Affairs ISSN 2341-5568, No. 51
Publications (Finnish Youth Research Society) ISSN 1799-9219, No. 148
Internet publications (Finnish Youth Research Society) ISSN 1799-9227, No. 73
CoNteNtS
INtroDuCtIoN ... 5
ImPLemeNtatIoN oF the SurVeY aND baCKGrouND VarIabLeS ... 8
Part I VoLuNteer aCtIVItIeS aND PoLItICS ... 9
VoLuNteer aCtIVItIeS ... 9
PartICIPatIoN IN VoLuNteer aCtIVItIeS ... 9
PartICIPatIoN aND wILLINGNeSS to PartICIPate ... 10
FormS aND aCCumuLatIoN oF VoLuNteer aCtIVItIeS ... 11
motIVatIoN For VoLuNteer aCtIVItIeS ... 11
obStaCLeS to PartICIPatIoN IN VoLuNteer aCtIVItIeS ... 12
PoLItICS ... 13
INtereSt IN PoLItICS ... 13
Left wing – Right wing ... 15
PoLItICaL VIewS oF YouNG PeoPLe aND theIr PareNtS ... 17
Part II SeNSe oF CommuNItY aND truSt ... 19
beLoNGING ... 19
meetING FrIeNDS aND reLatIVeS ... 21
temPoraL ChaNGe IN meetING FrequeNCY ... 21
truSt IN INStItutIoNS ... 22
SoCIaL truSt aND DIStruSt ... 24
temPoraL ChaNGe ... 26
truSt aND SatISFaCtIoN wIth LIFe ... 26
PARt iii CROSS-geneRAtiOnAL weLL-Being ... 29
LeGaCY From the ChILDhooD home ... 29
weLL-Being, hABitS, heALth ... 29
Age-ReStRiCtiOn tO ChiLdhOOd hOme ... 30
eXCerCISe ... 32
FItNeSS traINING aND eVerYDaY PhYSICaL aCtIVItY ... 32
ComPetItIVe SPortS ... 33
baCKGrouND oF the ChILDhooD home reGarDING SPortS aND eXerCISe .... 34
VeGetarIaNISm ... 35
rare VeGetarIaNS ... 36
reaSoNS For FaVourING VeGetabLeS ... 37
aLCohoL aND DruGS ... 38
uSe oF aLCohoL aND DruGS ... 38
dRugS And ALCOhOL uSe, ChiLdhOOd hOme And PARentS ... 40
attItuDeS towarDS the uSe oF DruGS aND aLCohoL ... 41
atmoSPhere IN ChILDhooD home ... 42
DaILY LIFe IN the ChILDhooD home ... 44
ChiLd-ReARing PRACtiCeS in the ChiLdhOOd hOme ... 47
Part IV SatISFaCtIoN ... 49
INtroDuCtIoN
Youth Barometer is an annual telephone
survey focusing on young people aged 15 to 29 living in Finland. The survey has been conducted since 1994. The sample for the Youth Barometer is 1900, and it is obtained by random sam-pling with quotas for gender, age and native language. The Youth Barometer’s analysis of the statistical data has now been translated into English for the first time.
In addition to their traditional monitoring task, the Youth Barometers have, since the beginning, collected in-formation on a specific issue that has been deemed topical or important for some other reason. The theme of the 2012 Youth Barometer is intergenera-tional relationships. For this purpose, the most recent Youth Barometer was implemented in a new way: in addition to young people, 600 parents and other custodians of young people were also interviewed. In the data, the responses from young people and their parents have been combined. This offers a new method of exploring the social or cul-tural inheritance of values and ways of life, thus opening up an opportunity to examine intergenerational relation-ships through family relationrelation-ships, in
particular. Also, the construction of well-being can be observed from a cross-generational viewpoint.
The data gathered aims to shed light to issues related to interaction between generations by focusing to the links between background from childhood home and young people’s daily lives and ways of life. The perspectives of both research and society have a strong pres-ence in the cross-generational approach that overlaps with the areas of multi-disciplinary youth research as well as youth, family and social policy.
From the perspective of content, the 2012 Youth Barometer has several different focus points. In addition to themes associated with the upbringing of children and the daily life of fami lies, the barometer explores the habits fami-lies from the viewpoint of health be-haviour. In this respect, the barometer incorporates variables both promot-ing and hinderpromot-ing the maintenance of health, such as smoking, use of alcohol and/or drugs, exercise, and eating habits. Moreover, the barometer also observes well-being and health from a broader perspective by including the concept of satisfaction with life and its different areas. Even though the
concept of social capital is not empha-sised in the present study, topics such as voluntary work and other participation, social trust, trust in institutions, social networks and a sense of belonging, all covered by the survey, can, loosely in-terpreted, be deemed to fit under it.
Thematically, the barometer tackles the formation of well-being and the values and attitudes related to this from the perspective of intergenerational relationships. The barometer provides important, even controversial, informa-tion regarding the cross-generainforma-tional transfer of values and experiences and/ or breaks in intergenerational dialogue and continuums.
In Helsinki on 10 September 13 Sami Myllyniemi
Statistical Researcher
Finnish Youth Research Network Leena Suurpää
Research Director
Finnish Youth Research Network Satu Tuomikorpi
Secretary General
Advisory Council for Youth Affairs
Finnish Youth research Network
The Finnish Youth Research Network is a community of researchers that en-gages in cooperation with universities and polytechnics and with profession-als operating in research institutes and in the field of youth work. The network aims both to produce high-quality aca-demic research and to use the research conducted by it to impact the develop-ment of youth policy and youth work.
The youth research network tackles phenomena related to youth and young people and introduces new knowledge and perspectives to public debate. The following topics are emphasised in the research projects of the network: research on youth cultures, questions related to an individual’s life course and becoming an adult, and the themes of exclusion, ethnic relations, education and youth work.
The Youth Research Network or-ganises seminars and training. Many of the researchers in the network act as experts in different education and train-ing events and development projects of youth work and youth policy.
The main financier of the Finnish Youth Research Network is the Youth Policy Division of the Ministry of Edu-cation and Culture.
Advisory Council for Youth Affairs
The national Advisory Council for Youth Affairs (Nuora) is a consultative body in child and youth policy appoint-ed by the government. The members of the council are individuals well-versed in the growing and living conditions of children and young people especially called to the task by the government. The secretariat of the council operates in connection with the Ministry of Ed-ucation and Culture.
Under the Youth Act, the tasks of Nuora include:
• annual assessment of the implementation of the government’s child and youth policy programme;
• preparing proposals for
programmes and measures concerning young people, and
• generating new, up-to-date information on young people and their living conditions.
The Advisory Council for Youth Affairs implements its statutory tasks for example by issuing statements and producing the annual Youth Barometer, which measures the values and attitudes of young people in cooperation with the Finnish Youth Research Network.
Facts about Finland
A parliamentary republic in Northern Finland
Population (2012): 5,426,674 Area: 338,432.07 km²
Population density: 17.9 / km² Age distribution of population:
age
group Number Percentage
0–14 891,392 16.4 15–29* 1,001,766 18.5 30–44 1,002,071 18.5 45–59 1,123,664 20.7 60–74 954,915 17.6 75– 452,866 8.3
ImplementatIon of the Survey and Background varIaBleS
The Youth Barometer is based on sur-vey material collected in spring 2012. The universe for the study consists of 15 to 29-year-olds in Finland as a whole with the exception of Åland. For the study, 1,902 young people were inter-viewed out of whom 1,792 were Finn-ish-speaking, 105 Swedish-speaking and 5 had a native language other than Finn-ish or SwedFinn-ish. The average duration of the interviews was 34 minutes.
At the end of the interview, the young people were asked for permis-sion to interview one or both of their parents. A total of 597 parents were in-terviewed. With 387 young people, only one parent was interviewed, whereas the number of young persons with both parents interviewed was 105. The aver-age duration of an interview with a par-ent was 30 minutes.
Apart from age, native language and municipality of residence, information for the background variables of the Youth Barometer was obtained from the respondents themselves. In other words, the information was not extract-ed from a register but is basextract-ed on the young interviewees’ own understanding of the matter. As a result of this, for example, an individual’s main type of activity may not match the one stated in official documents. A young person who both works and studies may state either one as his or her main type of activity. The fact that, as a general rule, the background information for the Youth Barometer has been obtained from the respondents does not have to be perceived as a source for errors, but it is good to bear in mind that this infor-mation primarily reflects the young per-son’s own experience of the situation.
volunteer actIvItIeS
Volunteer activities are part of the social relationships of day-to-day life and the construction of a sense of community; at the same time, a central element in volunteer work is social impact. The ob-servations of the Youth Barometer as concerns volunteer work – both as or-ganised activities within NGOs or more independent activities – can be viewed in relation to the dynamics of volunteer activities and paid labour currently in transformation in Finland. Barometers from previous years have found that, like the labour market, the attitudes of young people towards education, train-ing and work are in transition.
Participation in volunteer activities
The format and formulations for the interview were borrowed from the 2002 study, which enables the monitoring of changes in participation in volunteer ac-tivities. Figure 1 indicates that in slightly more than a decade, participation has increased from 33 per cent to 37 per cent. The growth has been more rapid among young women, with more young
women (39 per cent) than men (35 per cent) stating they have taken part in some volunteer activities on the year of the survey or the previous year. The changes by age group have been rela-tively large. Increase in participation has taken place particularly among the over 20-year-olds. However, participation in volunteer activities among the under 20s is declining. Participation in volun-teer activities seems to have increased, particularly in Southern and Eastern Finland.
On the whole, young people’s par-ticipation in volunteer activities would seem to be increasing. Compared to others, people who take part in volun-teer activities are more satisfied with both their relationships and their life in general. When asked about motiva-tion for volunteer activities, friends and doing things together were highlighted alongside with the willingness to help others (see figure 3). In many ways, social reinforcement is at the heart of Finnish youth policy, and from this per-spective, too, an increase in participa-tion in volunteer activities among young people and meanings attributed to it by young people constitute significant re-sults.
Participation and willingness to participate
In addition to the 37 per cent who take part in volunteer activities, 27 per cent of young people would like to take part in volunteer activities if asked to do so. In a very rough categorisation, young people can thus be divided into three segments: slightly more than a third are involved in volunteer activities, slightly less than a third would like to be in-volved and slightly more than a third do not take part and are not interested in taking part in volunteer activities. Com-pared to the 2001 survey, the share of young people interested in taking part in volunteer activities has declined, as the number of those taking part has
increased. In a way, supply and demand are meeting better than before, when the amount of unused potential is re-duced.
Taking part in volunteer activities is more common among girls, and their interest in taking part is also greater than with boys. In participation itself, no great changes take place with age, but the willingness to take part increas-es. In Finland, the population in rural areas is sparse, and regional differences in the provision of services are typically large. Scarcity of opportunities is high-lighted as an obstacle of participation in volunteer activities in rural areas (22 per cent) compared to towns and cities (16 per cent) and particularly the Capital region (9 per cent).
15–29-year-olds 2012 (n=1902) 15–29-year-olds 2001 (n=601) Female (n=930) Male (n=972) 15–19 years (n=639) 20–24 years (n=631) 25–29 years (n=632) Native language Finnish (n=1797) Native language Swedish (n=105) Student (n=1011) Wage earner (n=394) Unemployed or laid off (n=81) Completed or completing a university degree (n=297) Completed or completing a degree from a polytechnic (n=388) Has passed matriculation exam. or attends general upper sec. school (n=383) Vocational upper secondary qualification or studying for it (n=662) No degree, not studying (n=60) Mother has a university degree (n=100) Mother has a polytechnic degree (n=47) Mother has passed matricul. exam. or obtained post-sec. level qualification (n=97) Mother has vocational upper secondary qualification (n=142) Mother has no degree (n=36)
Participated this year or last year Would like to participate if asked
37 27 33 40 39 31 35 24 37 24 37 28 36 31 36 28 50 26 39 25 35 30 28 35 46 30 38 29 39 24 31 27 13 25 45 35 40 28 52 30 41 28 22 31
forms and accumulation of volunteer activities
When examining the most popular volunteer activities, three forms of volunteer activity stand apart from the rest: upbringing of children and young people, sports and exercise, and stu-dent union and tutoring activities. More than ten per cent of young people are involved in each of these activities whereas the proportions of other ac-tivities mentioned in Figure 2 are clearly smaller.
motivation for volunteer activities
Young people who have been involved in volunteer activities were requested to answer further questions on the impor-tance of the different motives for their involvement. Some of the reasons cited were more instrumental in nature, such as benefit for studies or work, while
others were directly linked to the will-ingness to help others and the value base related to that.
Willingness to help others and so-ciability were highlighted in young peo-ple’s reasons to take part in volunteer activities. The willingness to help others remains the number one reason, but en-joyment of the activities, spending time with friends and doing things together and meeting new people constitute al-most equally strong reasons for taking part (Figure 3).
In international comparison, a fea-ture characteristic of Finland has been that most have defined willingness to help as a strong motivation. Recently, reasons of a different kind, such as friends, learning new things and having fun have emerged alongside willingness to help others. At first glimpse, these can be perceived as less altruistic, even selfish or hedonistic motives. Altruism FIGure 2. “whICh oF the FoLLowING areaS oF VoLuNteer aCtIVItY haVe You taKeN Part
in?“ (% Of YeS AnSweRS.)
Upbringing of children and young people Sports and exercise Student union and student tutor activities at the school Culture and art International activities Religious activities Activities in the residential area Health and social services (e.g. services for the elderly and the disabled) Political and social activities Nature conservation Human rights Environmental protection Animal protection National defence Rescue services Multiculturalism, immigrant activities and ethnic associations
Trade union activities
19 18 14 9 9 9 8 8 8 6 6 6 5 5 4 4 4
and egoism are often perceived as the opposite ends of a continuum, but al-truistic activities may increase the well-being and happiness of both the giver and the recipient, and personal benefit may act as a motivation for altruism.
In other words, outside of pure al-truism, there are other explanations for what makes people act in an unselfish manner and donate their time and other resources for the good of others.
Based on results from the Barom-eter, it is not an exaggeration to claim that irrespective of the possible gain to the volunteers themselves, a strong notion of helping others and altruism is present in volunteer activities. This is also highlighted in the conceptions regarding the contents of volunteer activities put forward by young people in their responses to open-ended ques-tions.
Obstacles to participation in volunteer activities
Young people who themselves have not taken part in volunteer activities this year or last year were asked to state reasons for their non-participation (Fig-ure 4). Out of all young people, 38 per cent cited lack of time an obstacle for participation in volunteer activities. Not having been asked to take part was con-sidered as an obstacle by 24 per cent. These two were the most commonly cited obstacles for participation in the 2001 survey. In addition, not having got around to it and not having thought about it, both indicating lack of inter-est, are relatively popular explanations, with 20 per cent of respondents opting for each.
Willingness to help others Volunteer activities are fun Friends and doing things together Gaining life experience Learning new things Activities bring meaning to life Meeting new people I get to implement my values through action Desire to influence the world around us Sense of obligation Volunteering is a part of my way of life Flexibility of activities I have extra time that I like to spend on something useful Others in my circle of friends take part in volunteer activities Benefit for studies or for work Taking part in volunteer activities is or was common in my childhood home It is something that's mine and does not involve those in my immediate circle Religious conviction Political conviction Pressure inflicted by someone
47 45 6 1 0 0 44 42 9 2 2 1 43 41 8 4 4 0 37 49 8 2 3 1 31 49 11 3 6 0 30 47 13 6 4 1 31 45 11 7 5 0 28 49 12 5 6 1 24 46 14 8 7 1 15 43 24 11 6 1 21 36 20 12 10 1 12 37 24 13 12 2 12 35 23 13 15 1 13 34 22 14 15 3 14 35 17 11 22 1 13 21 19 18 27 3 6 16 23 22 32 2 8 11 13 15 52 1 3 11 18 20 46 1 1 3 7 14 72 2 Don’t know Very important Not important but not unimportant Fairly important
Fairly unimportant Completely unimportant
In addition to actual participation in volunteer activities, the survey explored willingness to participate if asked to do so (Figure 1). With young people who possessed this willingness, the reason for non-participation is lack of oppor-tunities (supply of activities), funds, the right company or the fact that they do not know how to get involved. These appear as rather credible obstacles for individuals who, in principle, have a positive attitude towards volunteering. With the young people who would not like to take part even if asked, lack of faith in volunteering as a whole, not perceiving the appeal of the activities and not benefiting from the activities themselves are highlighted as reasons for non-participation. The reserved approach is not necessarily based on a negative attitude towards volunteering from the offset, as, for the majority,
prior negative experiences seem to have affected the desire to take part even if asked to do so.
polItIcS
interest in politics
When asked about their interest in poli-tics, the majority (61 per cent) of the young people are at least somewhat in-terested, less than a third have only little interest, and one in ten have no inter-est at all. By international comparison, young people in Finland remain at the bottom. However, by a temporal com-parison, the interest of young people in politics is on the up (Figure 5).
Based on prior studies, interest in politics goes largely hand in hand with active voting, which can be interpreted
Lack of time I have not been invited to join I haven't got around to it It has not occurred to me Lack of suitable company or group Lack of supply in my municipality of residence The activities are not attractive to me Lack of funds I don't know how to get involved No specific reason I don't believe in such activities The activities do not benefit me in any way I don't feel like I have anything to give Political or ideological reasons Health reasons Previous bad experiences Some other reason, what?
38 24 20 20 19 16 15 12 12 12 6 6 4 3 2 2 2
FIGure 4. ”whICh oF the FoLLowING reaSoNS haVe ImPaCteD You Not taKING Part IN
as the majority holding a traditional conception of politics. On the other hand, young people interested in poli-tics who also vote are more active than others – also in the area of extra-parlia-mentary activism. An interest in politics can thus be interpreted as an indicator of not only attitude but also being ac-tive and doing things.
Young men are slightly more inter-ested in politics than young women. The interest shown increases somewhat with age. With reference to regional variables, young people living in rural areas appear to have lower level of in-terest in politics compared to those liv-ing in towns and cities and particularly to those living in the Capital region. The correlation to education level is very strong, and it is evident not only in degrees and study places but also in educational achievement in comprehen-sive school.
The background of the child-hood home is significant, as discussing politics in childhood home has a very
strong correlation with young people’s interest in politics. Often, as many as two out of three of young people who had discussed politics frequently in their childhood home were very interested in politics. The interest in politics was also greater among young people who had discussed news and other current events in their childhood home. Social inheritance is also strong when com-paring the level of interest in politics among young people and their parents.
Figure 5 indicates a relatively clear shift: young people’s interest in politics increased from the 1990s until the early 2000s and, after a small slump, has again turned to a relatively powerful growth. In the 2012 survey, young people were more interested in politics than ever be-fore in the entire period of monitoring. The shift in the interest in politics in recent years can be interpreted against the backdrop of exceptional turbulence in the fields of both domestic and for-eign policy. It is possible to detect phe-nomena that on the one hand function
2012 2008 2006 2003 1999 1996 15 47 28 10 0 8 37 35 19 1 6 37 41 13 3 9 45 37 9 0 6 45 38 11 0 7 37 38 18 0
Very interested Somewhat interested Only little interested Don’t know
Not interested at all
Sources: Borg 1996; Nurmela 1999; Nurmela & Pehkonen2003; Paakkunainen & Myllyniemi 2006; Youth Barometers 2008 and 2012 .
figuRe 5. “hOw inteReSted ARe YOu in POLitiCS?” COmPARiSOn 1996–2012. (18–29-YeAR-OLdS, %)
to increase interest in politics, but on the other hand may also have the effect of getting more and more people to turn their backs on it. Finland has witnessed a party-funding scandal that shook the party political system, in addition to the largest upheaval in decades as concerns support for political parties. An even more significant explanation for the heightening of interest can be found in the presidential election, the campaign for which was at its most heated as the interviews were being conducted. The turmoil of global economy that began in 2008 and the crisis of the Euro area have also been reflected in Finland. Questions related to the contents of politics and the personalities involved have been exceptionally colourful. However, the question regarding the ex-tent that day-to-day events in the world of politics are reflected in the shifts of young people’s interest in politics re-mains unanswered. In fact, changes in interest in politics would appear to be too even and trend-like to be affected by day-to-day events and would, rather, seem to constitute a symptom of some-thing deeper.
Many indicators describing young people’s attachment to the political sys-tem would seem to point at a strength-ening trend: opportunities to influence planning and services in one’s own residential area are increasing, more and more people would like to be involved in politics, faith in the functioning of democracy in Finland is increasing, and
trust in political institutions, such as parties and the parliament, is growing (Figure 10 in this publication). Over-simplified assessments of a crisis of legitimacy and a decrease in regard for politics do not thus seem credible in the light of information from the Youth Barometer. It is interesting, however, that young people’s interest in politics is not channelled primarily to voting or acting in political organisations, but something else.
Left wing – Right wing
Since 1996, young people taking part in the survey have been asked to place themselves on the traditional left–right political axis. On a scale of 1=left wing, 10=right wing, in a completely sym-metrical distribution, the mean would be 5.5. Here it is 5.3, i.e. slightly tilted to the left. In Figure 6, the original 10-point scale has been compressed to 5 points for clarity.
Girls are located slightly more to the left than boys. Age-related shifts on the left–right scale are not one directional in the age groups of 15-29-year-olds. On average, associating oneself towards the left is more common around the age of 20, and to the right around the age of 25. A more significant change taking place with age is a clear reduction in the proportion of I don’t know answers. 14 per cent of 20-year-olds but only 6 per cent of 25-29-year-olds are not able to or do not want to place themselves on
the left–right dimension. In a regional comparison, young people in towns and cities, particularly those living in the Capital region, are more leftist than their counterparts in rural areas.
Young people’s left-wing/right-wing thinking displays a rather clear trend towards the left. Voter turnout among young people, which is lower compared to other age groups, naturally has an im-pact on how much this emphasis on the left is visible in the actual support for parties. Moreover, identification on the political dimension may involve aspects
that are not directly linked to party poli-tics. The Greens of Finland and anoth-er party popular among young people, the Finns, are not easily positioned on the left–right dimension.
Political views of young people
and their parents
Young people were asked to estimate both their father and mother’s posi-tion on the left–right axis. The same question was posed to the interviewed parents themselves. This allowed a figuRe 6. “On A SCALe Of One tO ten, whiCh numBeR BeSt deSCRiBeS YOuR POLitiCAL POSitiOn?” (%)
All young people (n=1902) Parents (n=597) Girls (n=930) Boys (n=972) 15–19 years (n=639) 20–24 years (n=631) 25–29 years (n=632) Native language Finnish (n=1792) Native language Swedish (n=105) Capital Region (n=526) Other urban municipalities (n=984) Densely populated municipalities (n=202) Rural municipalities (n=190) Childhood home of low income (n=235) Childhood home of average income (n=1442) Childhood home of good financial status (n=217) Parents’ views represent left wing (n=56) In between (n=304) Parents’ views represent right wing (n=107)
6 21 38 21 5 9 5 15 41 28 6 5 7 22 39 18 3 12 5 21 37 23 7 7 6 16 41 20 5 14 6 26 37 18 4 9 6 23 36 24 5 6 6 21 39 20 5 9 3 22 26 28 8 14 8 28 31 22 6 6 6 22 39 20 4 10 5 12 42 24 5 12 2 12 46 17 6 17 9 26 39 17 2 7 6 22 38 21 5 9 5 13 41 21 8 13 18 27 25 16 2 13 6 23 44 17 3 8 3 21 38 25 8 6 Left wing (1–2) 3–4 5–6 Don’t know Right wing (9–10) 7–8
comparison between the young peo-ple’s assessments and the actual political views of the parents as well as the cor-relation between the political views of young people and their parents.
The young people’s assessments of the political views of their mothers and fathers were close to each other (corre-lation coefficient 0.68). Young people’s assessments of their parents’ position-ing on the political map also correlated strongly with the parents’ own views (with mothers, the correlation efficient was 0.48, with fathers 0.43). Overall, knowledge of the political thinking of the older generation seems relatively good. These findings also provide grounds for the interpretation that the concepts of left and right remain sig-nificant in Finnish politics, and the
differences between meanings attached to them by different generations do not seem excessive.
The assessments of a young person and his or her parent regarding their own political positioning are often close to each another, which reflects the social inheritance of values. In roughly one in four cases, the young person and his or her parent are in exactly the same spot on the 10-point left–right axis, with one in four displaying a difference of one point, one in four a difference of two points, and one in four a difference of at least three points. The correlation can be seen in Figure 6, where the political position of the parent is presented as the background variable for the posi-tioning of the young person.
FIGure 7. “how FIrmLY wouLD You SaY You beLoNG to the FoLLowING?” ComParISoN
2004, 2008 And 2012. (%)
Immediate family
Circle of friends
Extended family
School or work community
Finnish society
Online community most frequented by you
An association, club or non-governmental organisation
Congregation / religious community
66 26 5 2 0 0 68 24 6 1 1 0 71 22 5 1 1 0 59 34 5 2 1 0 48 41 9 2 0 0 59 33 6 2 0 0 35 39 12 12 2 0 32 36 23 8 2 0 34 44 11 6 2 3 20 42 25 8 5 1 20 47 20 9 4 0 26 50 15 6 1 1 17 36 29 12 5 0 29 40 21 6 3 0 14 37 21 16 7 6 5 14 30 24 21 6 12 19 16 18 23 13 5 13 25 18 35 4 12 25 29 14 17 3 6 12 12 25 40 6 4 7 17 23 49 0 5 12 19 28 35 1
Very firmly Fairly firmly Neither firmly nor loosely Don’t know Very loosely Fairly loosely 2012 2008 2004 2012 2008 2004 2012 2008 2012 2008 2004 2012 2008 2004 2012 2008 2012 2008 2004 2012 2008 2004
* 2004 and 2008 the question was worded as "a sense of belongingto a free-time association other than a club for sports or other leisure activities."
BelongIng
Figure 7 reveals a shift in a sense of be-longing among young people, and indi-cates variation in the pace of the change between different social units. In 2008, when the topic was last measured, the sense of belonging was found to be rapidly weakening. Now, the weaken-ing has, for the most part, turned to-wards a firmer sense of belonging. The strengthening in the sense of belonging to the online community most com-monly frequented by the respondent has been particularly strong. Just three years ago, the sense of belonging to an online community was experienced as firm by one in five, now almost half of the young people. The change is ex-plained through the rapid development of social media, in particular. Facebook, Twitter and other community sites have increased their popularity at an aston-ishing rate and have rapidly integrated themselves as part of the daily lives of people. At least until recently, the time spent on the Internet by young people has increased, but the concrete quanti-tative limits in the use of time will soon be reached.
Family remains number one in the measurements, and even though the
sense of community has been reduced somewhat, it is still by no means loose, as more than 90 experience their sense of belonging to their family at least as fairly solid. When comparing the sense of belonging to descriptions given by young people regarding the atmosphere of their childhood home (cf. Figure 21), young people with the most solid sense of belonging appear to have grown in encouraging, peaceful and loving homes. The other extreme consists of those who describe their childhood home as quarrelsome or indifferent.
Doing things together as a family is strongly associated with the intensity of the sense of belonging (see Figure 22). Doing household chores together appears particularly significant from this perspective. Out of the child rear-ing practices of the childhood home, positive feedback received as a child is particularly strongly linked to the inten-sity of the sense of belonging: the fact that the parents let the child know how loved and important he or she is. Simi-larly, those who discussed their joys and sorrows with their parents experience a strong sense of belonging with their family.
figuRe 8. meeting fRiendS And fAmiLY. COmPARiSOn BY Age And gendeR. (%) Meeting friends Meeting mother* Meeting father* Meeting siblings** Meeting grandparents 78 18 4 0 0 0 0 54 38 7 0 0 0 0 36 50 11 3 0 0 0 85 12 3 1 0 0 0 65 29 4 1 1 0 0 46 44 7 3 0 0 0 15 44 33 6 3 0 0 9 44 37 9 0 0 0 8 36 38 17 1 0 0 19 60 17 4 0 0 0 7 48 34 10 1 1 0 10 36 36 15 1 1 0 8 42 34 8 2 4 1 3 39 39 13 3 3 0 4 29 39 22 5 2 0 16 64 9 9 2 0 0 9 42 34 13 1 2 0 12 31 34 17 2 3 0 17 33 36 13 1 0 0 9 37 43 9 1 1 0 5 25 45 23 1 1 0 8 65 19 6 2 0 0 9 38 39 13 1 0 0 8 32 39 20 1 0 0 3 28 41 25 1 2 0 2 15 41 34 7 2 0 1 10 37 42 7 3 1 8 29 38 21 3 1 0 1 19 39 33 4 3 0 2 12 34 38 7 7 0 Almost daily
Approximately once a month
Approximately once a week Don’t know Less than once a year
Approximately once a year
15–19 years 20–24 years 25–29 years 15–19 years 20–24 years 25–29 years 15–19 years 20–24 years 25–29 years 15–19 years 20–24 years 25–29 years 15–19 years 20–24 years 25–29 years 15–19 years 20–24 years 25–29 years 15–19 years 20–24 years 25–29 years 15–19 years 20–24 years 25–29 years 15–19 years 20–24 years 25–29 years 15–19 years 20–24 years 25–29 years girls boys girls boys girls boys girls boys girls boys Never
* Only those who have moved out of childhood home.
meetIng frIendS and relatIveS
Young people’s level of social activity was determined by asking how often they get together with their friends and relatives. The frequency of meetings with father, mother and sibling was determined only for those who had already moved out of the childhood home.
Two out of three young people meet their friends on a daily basis, whereas almost everyone meet their friends at least once a week. Meetings with parents are more irregular, as about one in ten young people who have moved out of their childhood home meet their mother daily, approximately half at least weekly. Meetings with the father are more infrequent, with seven per cent getting together with their father daily and 40 per cent weekly. The frequency of meetings with siblings is on the same level as those with the father. Getting together with grandparents is notably less frequent, with approximately one in five meeting their grandparents on a weekly basis and about half every month.
Figure 8 shows that the frequency of meetings with both friends and relatives undergoes a steep decline with age. The drop in the frequency of meeting friends is explained by attendance in comprehensive school and upper secondary-level studies that entail regular social life. In a gender comparison, boys meet both their
friends and relatives slightly more often than girls. An exception to this is the frequency of meetings with mother, where no difference exists between boys and girls According to a free-time study on young people, when facing difficulties, girls are more likely to turn to their boyfriends and siblings, whereas boys will more often speak to people they know online or friends from free-time activities. When the target of observation was changed from the frequency of meetings to the number of friends, no differences were detected between girls and boys.
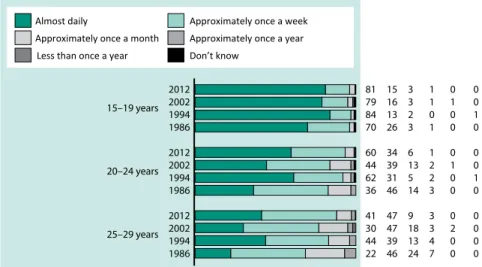
temporal change in meeting frequency
In the surveys from 1986, 1994 and 2002, the same method was used to de-termine the frequency of meetings with friends, which provides an opportunity to examine changes in the frequency of meetings. The comparison between age groups in Figure 9 reveals a cer-tain wave-like movement in the course of decades. Daily meetings between friends were less common in the 1980s and in the first decade of the new mil-lennium and more so in the 1990s and 2010s. The changes were great, particu-larly in the age group of over 20s, which can be explained by the fact that peo-ple younger than this are meeting their friends regularly at school.
The increase in meetings between friends in the last decade has coincided
with the breakthrough of the Internet and social media particularly in the age groups of young people. Actual, deeper reasons for the change lie beyond the reach of surveys, but an interesting de-tail detected in the young people’s free time study in 2009 was that people who are in active contact with their friends through the Internet also meet up with their friends more often than others.
truSt In InStItutIonS
Young peoples’ confidence in institu-tions has been measured since 1996. Based on measurements compiled in Figure 10, trust in social institutions as a whole is increasing. Trust in the Police, public servants, the municipal council, the parliament and political parties has
undergone the most notable increase. A clearly declining trend was not identi-fied for any institution.
Considering the different nature of the institutions, direct comparisons re-garding changes in the trust placed in them are not necessarily the best way to interpret the results. Focusing on changes in the order of individual stitutions as presented in the trend in-formation in Figure 10 does not yield a great deal of useful information, but the most rational way to view the data might be to examine the development of the reliability of each institution in relation to itself.
Factors associated with the time at which the survey was conducted im-pact the trust placed in different insti-tutions in different ways. For example, figuRe 9. “hOw Often dO YOu meet YOuR fRiendS?” COmPARiSOn BY Age gROuP 1986, 1994, 2002 And 2012. (%) 81 15 3 1 0 0 79 16 3 1 1 0 84 13 2 0 0 1 70 26 3 1 0 0 60 34 6 1 0 0 44 39 13 2 1 0 62 31 5 2 0 1 36 46 14 3 0 0 41 47 9 3 0 0 30 47 18 3 2 0 44 39 13 4 0 0 22 46 24 7 0 0 2012 2002 1994 1986 2012 2002 1994 1986 2012 2002 1994 1986 15–19 years 20–24 years 25–29 years Almost daily
Approximately once a month
Approximately once a week Don’t know
Less than once a year
FIGure 10. “how muCh Do You truSt the aCtIVItIeS oF the FoLLowING INStItutIoNS?” COmPARiSOn 1996, 2006 And 2012. (%) 67 27 4 2 0 57 34 6 2 0 57 36 5 1 1 43 44 10 2 2 37 49 10 2 1 39 49 9 2 2 42 43 10 3 3 39 41 14 6 1 46 41 8 3 2 36 48 11 4 2 32 47 17 4 1 25 50 18 6 1 32 50 15 3 1 33 51 13 2 0 17 48 26 8 1 26 50 12 2 11 23 57 15 4 2 17 52 17 6 9 23 57 13 3 4 15 57 21 5 1 16 61 16 4 4 8 56 28 6 2 18 58 17 5 3 21 58 16 3 2 12 60 17 4 8 8 55 29 6 2 5 54 29 6 6 14 56 22 7 2 13 52 27 7 1 7 49 33 9 3 7 63 22 5 3 3 50 35 10 2 1 45 37 13 4 12 52 27 7 3 11 50 30 9 1 19 58 15 4 4 20 39 21 17 3 15 39 28 17 1 21 46 19 13 2 11 46 30 11 3 10 39 36 14 2 11 46 28 12 4 6 33 34 18 10 4 30 40 23 3 Don’t know A lot A little Somewhat Not at all Police Court System
Finnish Defence Forces
President of the Republic
Banks Trade unions Government authorities Local authorities Government of Finland Municipal council Parliament Political parties Big corporations Evangelical Lutheran Church of Finland European Union NATO 2012 2006 1996 2012 2006 1996 2012 2006 1996 2012 2006 1996 2012 2006 1996 2012 2006 1996 2012 2006 2012 2006 2012 2006 2012 2006 1996 2012 2006 1996 2012 2006 1996 2012 2006 1996 2012 2006 1996 2012 2006 1996 2012 2006
the low level of trust placed in banks in the 1990s is likely to have had a strong connection to the banking crisis dur-ing the recession. Another example of situational influence is that trust in the Evangelical Lutheran Church or the Po-lice are not likely to be personified in individuals in the same manner as con-fidence in the president of the republic or the government. It is impossible to know with certainty, however, to what extent the confidence reflected in the answers is founded upon the institu-tions of president or government and to what extent it is based on the cur-rently acting prime minister or presi-dent.
However this may be, the strength-ening of confidence in political institu-tions remains a noteworthy trend yield-ed by the most recent survey. Trust in the president of the republic, the parlia-ment, political parties as well as the mu-nicipal council are all on the up. Also, young people’s trust in public servants in both central and local government is increasing survey by survey.
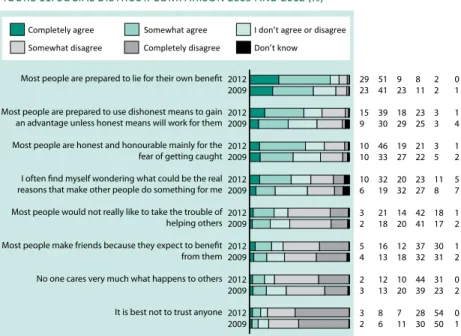
SocIal truSt and dIStruSt
Trust is important for the coping of an individual, and the functioning of socie-ty as a whole is based on the confidence we place in others. In the context of figuRe 11. SOCiAL diStRuSt. COmPARiSOn 2009 And 2012 (%)
29 51 9 8 2 0 23 41 23 11 2 1 15 39 18 23 3 1 9 30 29 25 3 4 10 46 19 21 3 1 10 33 27 22 5 2 10 32 20 23 11 5 6 19 32 27 8 7 3 21 14 42 18 1 2 18 20 41 17 2 5 16 12 37 30 1 4 13 18 32 31 2 2 12 10 44 31 0 3 13 20 39 23 2 3 8 7 28 54 0 2 6 11 30 50 1 Most people are prepared to lie for their own benefit
Most people are prepared to use dishonest means to gain an advantage unless honest means will work for them Most people are honest and honourable mainly for the fear of getting caught I often find myself wondering what could be the real reasons that make other people do something for me Most people would not really like to take the trouble of helping others Most people make friends because they expect to benefit
from them No one cares very much what happens to others
It is best not to trust anyone 2012 2009 2012 2009 2012 2009 2012 2009 2012 2009 2012 2009 2012 2009 2012 2009
Completely agree I don’t agree or disagree
Completely disagree
Somewhat disagree Don’t know
this study, social trust means confidence in people unknown to us. This variable, also known as generalised trust, has been measured in attitude surveys in the United States as early as the 1950s. The series of eight questions used in
the survey is a widely-spread attempt to measure social trust through quantita-tive means and has proved functional in different contexts. Based on vast empir-ical research data, it has been found that individuals who no longer possess trust figuRe 12. SAtiSfACtiOn with diffeRent AReAS Of Life BY SOCiAL tRuSt* (SCALe 4 tO 10, AveRAgeS)
How satisfied are you with your life in general?
How satisfied are you with the way you look?
How satisfied are you with your physical condition?
How satisfied are you with your health right now?
How satisfied are you with your relationships?
How satisfied are you with your free time?
How satisfied are you with your own financial situation at the moment?
Strong social trust (over 32) Average (23–28) Weak social trust (below 18)
Fairly weak (18–22) 8,7 8,5 8,4 8,3 8,1 8,4 8,2 8,0 8,0 7,6 8,0 7,9 7,8 7,7 7,5 8,8 8,5 8,4 8,2 7,9 8,7 8,5 8,4 8,3 8,1 8,0 8,1 8,0 7,8 7,5 8,0 8,1 8,0 7,8 7,2
* The classes have been formed based on a variable created on the basis of the eight questions in Figure 11.
Fairly strong (29–32)
in others are in many ways more fragile and vulnerable than others, particularly in the face of adversity.
By international comparisons, trust in fellow citizens has been found to be the strongest in the Nordic countries. The link between a strong welfare state and high social capital prompts the question of whether the welfare state is more the reason or consequence of this trust, or are the two unrelated. In international comparisons, causal re-lationships between phenomena have been found to produce circular for-mations: social capital increases gen-eral well-being, causing citizens to offer their support to the welfare state. The investment in well-being thus reduces inequalities, and the reduction in in-equalities strengthens social capital.
Adopting Finnish youth as its target, the Youth Barometer sheds new light on this vast area of study. Fresh com-parative information on the trends in confidence shown by young people in Finland is not available elsewhere. The survey also provides information on the impact of the conditions in the child-hood home. A research design where, in addition to the young people them-selves, their parents are also interviewed is, as far as we know, globally unique and allows for the study of the social inheritance of social trust.
temporal change
Social distrust among young people was measured in the Youth Barometer for the first time in 2009. Consequently, the new survey is the first one to yield information on development trends in the area. The current trend is towards the weakening of trust (Figure 11). When three years previously 64 per cent of young people accepted the statement that most people are willing to lie for their own benefit, in 2012 as many as 81 per cent shared this opinion. The statement that most people are honest only for the fear of getting caught was supported by 43 per cent in 2009 and 56 per cent in 2012. The weakening of trust is thus relatively fast, as three years is a short time as concerns questions that are not directly related to topical issues.
trust and satisfaction with life
Figure 12 shows that the more confi-dence the young person has in strangers, the more satisfied he or she is with his/ her life and its different aspects. The link between trust and relationships and health is particularly strong and straight-forward. Even though in Figure 12, trust appears as a background variable, the impact may well two-directional: trust improves relationships, and good relationships increase trust. In any case, social trust is connected to the different dimensions of the young person’s well-being in a very comprehensive manner.
trust and the legacy of the
childhood home
Observing background information compiled in Figure 13 enables us to detect connections that are in line with what might perhaps be expected. The atmosphere and child-rearing and other practices of the childhood home have
a clear impact on the amount of trust experienced by young people. Young people who grew up to trust others had received more positive feedback in their childhood and had experienced their childhood home as more encouraging and loving. The trusting respondents were more often from families that had FIGure 13. SoCIaL DIStruSt bY baCKGrouND VarIabLeS reLateD to PareNtS aND
ChiLdhOOd hOme.* (%)
All young people (n=1752) Parents’ own social trust weak* (n=148) In between* (n=147) Parents’ own social trust strong* (n=127) Lived with both parents in childhood home (n=1292) Took turns living with both parents (n=81) With father only (n=55) With mother only (n=296) Childhood home very encouraging (n=706) Fairly encouraging (n=988) Only little encouragement offered (n=54) Eating together was common in the childhood home (n=841) Sometimes (n=883) Seldom or never (n=74) Parents gave positive feedback (n=1530) Positive feedback was not given (n=217) Physical discipline implemented (n=183) No (n=1552) Excessive consumption of alcohol in the childhood home No excessive consumption of alcohol (n=1173) Childhood home of low income (n=223) Average income (n=1327) Good financial status (n=199) Mother has a university degree (n=309) Mother has a polytechnic degree (n=208) Mother has passed matricul. exam. or obtained post-sec. level qualif. (n=320) Mother has vocational upper secondary qualification (n=481) Mother has no degree (n=110)
6 20 46 22 7 5 24 43 23 4 3 24 42 29 3 5 13 41 27 14 5 19 46 23 7 6 27 40 19 9 7 24 42 20 7 9 20 49 17 5 4 17 45 26 9 6 21 48 19 6 15 39 32 11 4 4 18 45 24 9 7 21 48 19 5 7 37 39 16 1 5 19 46 23 8 11 25 50 12 2 11 26 40 19 4 5 19 47 22 7 9 18 50 18 6 5 20 47 22 7 9 22 40 21 8 5 20 47 22 7 7 19 52 16 7 3 18 42 24 12 2 14 55 21 8 4 19 48 23 7 8 20 46 21 5 6 30 44 16 5
* The classes have been formed based on a variable created on the basis of the eight questions in Figure 11
Strong social trust (over 32)
Average (23–28) Weak social trust (below 18) Fairly weak (18–22)
discussed politics and other current events as well as the joys and sorrows of family members. Almost all activi-ties performed as a family (see Figure 22) have a positive correlation with trust. In Figure 13, this connection is represented by eating together as a fam-ily. The social inheritance of trust is also evident in how parents with strong social confidence also produced more trusting offspring.
Young people who in their childhood lived with both their parents
have slightly higher level of social trust in their fellow citizens than others. The link between excessive use of alcohol in the childhood home and lower level of social trust is statistically significant but not very strong. Also, the link between the financial status of the childhood home and social trust experienced by young people is relatively weak. Out of socioeconomic background factors, the educational level of parents was clearly more important that the financial status of the family.
legacy from the chIldhood home
well-being, habits, health
The survey explored the child-rearing practices and daily life of the childhood home as well as family dynamics and influences and encouragement gained from the home. The new research de-sign, interviewing parents on the same topics, also allows for the introduction of another perspective to the same question – a double exposure, so to speak. This allows for exploring not only the links between family back-ground and the habits of young people but also similarities between the views of parents and their children concern-ing these topics. Through conductconcern-ing interviews with both parents and chil-dren, the analysis is provided with a certain temporal depth. The objects of interest are thus cross-generational rela-tionships and the social inheritance of health behaviour.
Traditionally, attempts to meas-ure well-being have been dominated
by indicators aiming at objectivity. Well- being, in particular, has been ap-proached from the viewpoint of mate-rial and other resources related to living conditions. Recently, there has been a greater understanding of the fact that living conditions alone do not guarantee well-being, and that transforming liv-ing conditions into well-beliv-ing requires different type of resources, the under-standing of which also requires differ-ent indicators. The inadequacy of tra-ditional indicators is visible in the work of measuring not only individual well-being but also the well-well-being of society.
The added value that the Youth Barometer may introduce to this vast field of research is partly to do with the survey design in which the responses from young people are linked to the responses of their parents. Moreover, the aim is to shed new light to areas of research that until now have constituted its blind spots, such as the perceptions and possible contrasting views of young people and their parents regarding the atmosphere, child-rearing practices and habits that prevailed in the childhood home.
Age-restriction to childhood home
The questions on the child-rearing prac-tices, interaction and other influences of the childhood home were formulat-ed to concern the period during which the young people were in comprehen-sive school, i.e. ages seven to sixteen. The focus on comprehensive school years in questions related to family
dynamics and child-rearing practices is also based on an interest in the special features of Finnish families. According to data collected in the Unequal Child-hood project implemented in the Nor-dic countries project in 2002, Finnish children begin to distance themselves from their parents as early as the age of 11. At this age, children no longer feel they receive as much support from figuRe 14. “hOw Often dO YOu engAge in eveRYdAY PhYSiCAL ACtivitY, SuCh AS
waLKING or CYCLING to worK or SChooL or GarDeNING or other outDoor
mAintenAnCe wORk?” (%)
All young people (n=1902) All parents (n=596) Girls (n=930) Boys (n=972) 15–19 years (n=639) 20–24 years (n=631) 25–29 years (n=632) Capital Region (n=526) Other urban municipalities (n=984) Densely populated municipalities (n=202) Rural municipalities (n=190) Childhood home has good financial status (n=217) Average income (n=1442) Low income (n=235) Sports and exercise activ. together as a family in the childhood home (n=154) Sometimes (n=1337) Rarely or not at all (n=408) Parents suggested or organised activities involving sports or exercise (n=1239) Did not suggest or organise (n=653) Had a regular activ. involving sports or exercise in compr. school age (n=1633) No regular activ. involving sports or exercise in compr. school age (n=269) Keep-fit physical activity at least 5 times a week (n=444) 2 to 4 times a week (n=1045) Less than once a week (n=410) Parents’ everyday physical activity at least 5 times / week (n=232) Parents’ everyday physical activity 2 to 4 times / week (n=204) Parents’ everyday physical activity max once per week (n=54)
Daily 5 to 6 times a week 2 to 4 times a week Don’t know Once a week or less
34 26 30 8 2 0 29 18 42 9 1 1 34 27 30 8 2 0 33 25 31 9 2 1 38 29 26 6 1 1 34 27 30 8 2 0 30 21 35 12 2 0 29 23 34 12 2 0 35 29 28 7 1 0 38 17 31 11 3 1 36 24 31 7 2 1 39 26 28 5 3 0 33 26 30 9 1 0 34 22 32 10 3 0 43 27 24 7 0 0 33 27 30 8 1 0 32 21 32 11 3 1 32 26 32 9 2 0 38 24 28 8 2 0 35 25 30 8 2 0 27 28 31 11 2 1 54 27 12 5 2 0 30 27 36 5 1 0 21 19 35 22 3 0 41 22 29 6 1 0 29 19 37 13 2 1 37 15 32 9 4 4 Never
their parents, and they are not trusted in the same way as they were before. The results from a six-year follow-up study support these findings: both girls and boys experienced a decline in parental support as they moved from childhood to youth. The older they become, the less Finnish children share the joys and sorrows in their lives with their parents. Finnish children also report that they stop playing at the average age of 11. Significantly, such development does
not occur as dramatically, if at all, with Norwegian and Swedish children. Inter-national comparisons performed within a WHO study on school children also indicate that physical activity among Finnish children is reduced between the ages of 11 and 15 clearly more than is the case in other countries.
From the perspective of the service system, it is possible to ask whether demand and supply of services meet as concerns this age group. Youngsters FIGure 15. “how oFteN Do You eNGaGe IN PhYSICaL aCtIVItY that LaStS at LeaSt 30
minuteS And CAuSeS mOdeRAte BReAthLeSSneSS And SweAting” (%)
All young people (n=1902) All parents (n=596) Girls (n=930) Boys (n=972) 15-19 years (n=639) 20-24 years (n=631) 25-29 years (n=632) Capital Region (n=526) Other urban municipalities (n=984) Densely populated municipalities (n=202) Rural municipalities (n=190) Childhood home has good financial status (n=217) Average income (n=1442) Low income (n=235) Exercise together as a family in the childhood home common (n=154) Sometimes (n=1337) Seldom or not at all (n=408) Parents suggested or organised activities involving sports or exercise (n=1239) Did not suggest or organise (n=653) Had a regular activity involving sports or exercise in compr. school age (n=1633) No regular activity involving sports or exercise in compr. school age (n=269) Parents’ fitness training at least 5 times / week (n=97) Parents’ fitness training 2 to 4 times / week (n=253) Parents’ fitness training max once per week (n=141)
9 14 55 18 4 0 9 11 52 22 6 0 8 13 56 19 4 0 10 15 54 17 3 0 11 13 57 17 3 1 9 16 54 17 4 0 8 14 54 20 4 0 7 13 61 17 3 0 10 15 54 18 4 0 12 8 51 25 4 1 9 21 52 15 3 1 18 18 49 12 3 0 8 14 57 18 3 0 7 14 52 20 7 0 21 21 47 10 1 1 9 14 57 17 3 0 6 13 50 24 7 0 9 14 57 17 3 0 9 16 51 19 5 0 10 16 56 15 3 0 6 7 46 33 8 0 13 10 43 28 5 0 8 16 55 18 3 0 7 9 57 23 4 0
Daily 5 to 6 times a week 2 to 4 times a week Don’t know Once a week or less Never
aged 10 to 14 are for the most part too young to use the services offered by municipal youth services, whereas a 13-year-old is already too old to begin some activities – at least if the goal is to produce top performers in the field. On the whole, under 15-year-olds are less likely to take part in any organised or free-form leisure activity than older teenagers. The age group of under-15s was also the most critical of organ-ised youth activities in their area of residence. In Finland, it is possible for early teens to fall into a kind of vacuum where they do not feel supported by their parents and have yet to begin their youth as such. Many indicators would seem to point to the existence of an age group between childhood and teenage whose needs in terms of free-time ac-tivities fail to be met.
excercISe
keep-fit exercise and everyday physical activity
In the survey, the different areas of fit-ness and physical activity were struc-tured by making a distinction between everyday physical activity (Figure 14), fitness training (Figure 15) and compet-itive sports (Figure 16). In addition, the respondents were asked to assess their own health and physical condition. The same questions were also posed to the parents, as were questions on physical
activity together with family members in the young person’s childhood, and encouragement and support provided by parents as concerns free-time activi-ties involving sports and exercise.
Examples of everyday physical ac-tivity presented to the interviewees were walking or cycling to school or work, gardening and other maintenance work performed outdoors. The actual term ‘keep-fit exercise’ was not used. Instead, the questions concerned the frequency of exercise that lasts at least 30 minutes and causes light breathless-ness and sweating. The respondents were given the opportunity to decide the categories into which the forms of exercise in their own life fell, as it would be impossible to determine, through the means of a survey, when activities such as dancing, skateboarding, snowboard-ing, breakdancing and parkour would fulfil the criteria for fitness training or competitive sports, for example.
Nine out of ten young people re-port engaging in everyday physical ac-tivity at least twice a week, the majority at least five times a week, and one in three daily. Even though concerns are being raised regarding the diminution of fitness training and everyday physical activity among young people, according to the survey it is still slightly more reg-ular than with parents.
Fitness training is clearly less regu-lar than everyday physical activity. Yet, at least four out of five young people stated exercising at least twice a week,
slightly less than one in four at least five times a week, and one in ten daily. The regularity of fitness training was on roughly the same level among both par-ents and young people.
Young boys are more active in fit-ness training, but no gender differences were detected in everyday physical activ-ity. Everyday physical activity becomes slightly less frequent with age, but age-related differences in fitness training are clearly smaller. People in their twenties and older are going through the busiest years of their lives involving changes in the place or residence, starting a family and other demands on their time, which may explain the decline in everyday physical activity and an active interest in sports. The interviews of the Youth Ba-rometer support the interpretation that among young people with their own families and children, both non-exercise physical activity and keep-fit exercise are at a lower level compared to their single peers.
Compared to young people in the rest of the country, the habits of young people in the Capital region are less reg-ular as concerns both everyday physi-cal activity and fitness training. Fitness training is more common among young people in rural municipalities compared to their counterparts in towns and cities. From a geographical standpoint, every-day physical activity is the most regular in Northern Finland.
Competitive sports
In the Youth Barometer survey 12 per cent of young people reported engag-ing in competitive sports. The differ-ence between the genders was great, as the percentage for boys was 16 and for girls 8. The proportion of young people engaging in competitive sports dimin-ishes rapidly before the age of 20.
With individuals engaging in com-petitive sports, the amount of fitness training is naturally greater than with figuRe 16. PRACtiSing COmPetitive SPORtS. (%)
Everyone (n=1902) Women (n=930) Men (n=972) 15–19 (n=639) 20–24 (n=631) 25–29 (n=632) Childhood home had good financial status (n=217) Average income (n=1442) Low income (n=235) 12 8 16 18 9 9 20 11 6
others, and everyday physical activity was somewhat more common among them. In addition to more active exer-cise, individuals engaging in competitive sports set themselves apart through a healthier lifestyle as concerns the num-ber of smokers (13% smoke regularly, cf. 24% in others). No differences were detected between young people engag-ing in competitive sports and others in vegetarianism and binge drinking.
When the frequency of competitive sports is viewed in the light of what the survey reveals about the model given by the childhood home, it is found that as many as 23 per cent of young people who report having exercised often as a family in their childhood home engage in competitive sports. Out of those to whom parents have organised or sug-gested activities involving sports or ex-ercise, 16 per cent engage in competi-tive sports. Out of young people whose parents have supported their participa-tion in sports and exercise activities for example by paying for them or driving the children to them, 14 per cent engage in competitive sports. Whether the par-ents themselves have engaged in com-petitive sports has little or no impact on the young people’s participation in such activities. The question on competitive sports yields the same result as was ap-parent in the more general question on participation in sports and exercise: do-ing thdo-ings together has a greater impact than encouragement or even example provided by the parent (cf. Figure 15).
Out of other background factors re-lated to the childhood home, the signifi-cant impact of financial situation is evi-dent. Out of the offspring of families in a good financial situation, 20 per cent engaged in competitive sports, whereas the figure for children from families with a poor financial situation the fig-ure was only 6 per cent. The inequality may result from models provided by the childhood home but also directly from the significant costs incurred by license fees, equipment, travelling to competi-tions, etc.
Background of the childhood
home regarding sports and
exercise
Information on the sports and exercise activities of young people have been compiled in Figures 14 and 15, with a particular focus on information ob-tained through the survey concerning the background of the childhood home and parents’ activity in the area of sports and exercise. At least three in four had engaged in some sport or exercise ac-tivity on a regular basis at least at some point during comprehensive school. With two out of three young people, parents organised or suggested sports or exercise activities. Out of young peo-ple who regularly engaged in sports or exercise at comprehensive school age, 80 per cent state their parents support-ed their activity by covering the costs or by driving them to the activities. Not
all sports and exercise activities neces-sarily cost money or require parents to drive children to the locations, but the importance of the role of the parents is highlighted as the point of emphasis in young people’s sports and exercise activities shifts increasingly from non-exercise physical activity to active par-ticipation in a chosen sport in the con-text of sports clubs. The results of the Youth Barometer indicate that young people who estimate the financial sta-tus of their childhood home as higher are more active and engage in a greater variety of sports and exercise activities than those from families with a lower financial status.
Based on the results of the Youth Barometer, the children of active par-ents are themselves more active in the area of sports and exercise. A similar correlation was not found between the level of activity among young peo-ple and the level of encouragement to sports and exercise provided in the childhood home. Instead, sports and exercise activities together with the childhood family are strong predictors of subsequent activity by the young per-son. The situation is particularly clear in the case of non-exercise physical activ-ity: young people coming from families with a history of engaging in sports and exercise activities together as a family are still clearly more active than oth-ers (Figure 15). The example provided by the parents is more significant than the encouragement provided by them,
particularly if the family has engaged in sports and exercise activities together. In other words: sports and exercise ac-tivities as a family have a greater impact on subsequent activity than the sports and exercise activities that the parent engages in on his or her own.
The results thus offer strong sup-port for encouraging a culture of physical exercise as an activity shared between family members. Figure 22 shows that the rate of young people who feel that physical activity as a fam-ily was very common is fewer than one in ten. Half stated that playing sports or exercising together was rare, and in ten per cent of the cases sports and ex-ercise between family members never took place. Finland would not seem to have a strong culture of exercising as a family. The background from the child-hood home would, however, seem to have rather wide-reaching and vast im-plications for health behaviour among young people and, as a consequence, for the health and well-being of the popula-tion as a whole.
vegetarIanISm
The frequency of vegetarianism among young people was explored by request-ing the interviewees to choose, out of five alternatives, the option that best characterises the role of vegetables in the person’s diet (Figure 17). The al-ternatives presented form a type of continuum with vegans, who do not
consume any animal products, at one end, and those who do not eat any veg-etables at the other.
rare vegetarians
Vegan diet proved to be very rare, as young people avoiding animal products completely only amounted to eight in-dividuals or half a per cent of the
re-spondents. The share of vegetarians who, in addition to vegetables, also con-sume dairy products was also relatively low: only four per cent of the young people. On the whole, a diet with an emphasis on vegetables appears to be surprisingly rare, as 17 per cent chose the option ”I eat meat, too, but I prefer vegetables”. As many as 77 per cent of young people only eat vegetables as an FIGure 17. “whICh oF the FoLLowING oPtIoNS beSt DeSCrIbeS the roLe oF VeGetabLeS IN
YOuR diet?” (%)
All young people (n=1891) Parents (n=594) Female (n=921) Male (n=970) 15–19 years (n=638) 20–24 years (n=626) 25–29 years (n=628) Capital Region (n=523) Other urban municipalities (n=977) Densely populated municipalities (n=201) Rural municipalities (n=247) GPA from comprehensive school 4–7 (n=163) 7.1–8 (n=625) 8.1–9 (n=797) 9.1–10 (n=266) Completed or completing a university degree (n=368) Completed or completing a polytechnic degree (n=371) Has passed matricul. exam. or attends general upper sec. school (n=447) Vocational upper secondary qualification or studying for it (n=558) No degree, not studying (n=602) Parent favours vegetables (n=135) Parent does not favour vegetables (n=355) Mother has a university degree (n=329) Mother has a polytechnic degree (n=216) Mother has passed matricul. exam or obtained post-sec. level qualif. (n=340) Mother has vocational upper secondary qualification (n=508) Mother has no degree (n=126))
I don't eat or drink any animal products, vegan I eat meat, too, but favour vegetables
I am a vegetarian but I also eat dairy products
I don't eat vegetables at all
I eat vegetables as an accompaniment to meat or fish dishes 0 4 17 77 2 0 2 25 73 0 1 7 23 69 1 0 1 11 85 3 1 4 14 78 4 0 4 18 77 1 1 4 19 76 1 0 7 18 74 1 0 3 17 78 2 0 3 16 78 4 1 2 13 81 3 0 3 10 81 6 0 2 15 80 2 1 5 18 75 1 0 6 22 71 1 1 7 21 71 0 0 4 18 77 1 1 5 14 78 2 0 2 15 80 3 1 3 11 80 5 3 9 20 67 2 1 3 20 76 2 0 6 20 72 2 1 3 17 78 1 1 5 17 75 1 0 3 14 81 2 1 4 18 75 2