Research Article
Open Access
Introduction
Figure 1: S)-2-((R)-5-chloro-8-hydroxy-3-methyl-1-oxoi-sochroman-7-carboxamido)-3-phenylpropanoic acid.
Mycotoxins are the secondary metabolites, which are produced by the several fungal species belonging to the family of Aspergillus, Fusarium, Penicillum [1,2]. Among them, the Aspergillus ochraceus and Penicillium citrinum are the main producers of ochratoxin A (OTA), which is the most widely occurring fungal toxin. Biosynthetically, OTA is the pentaketide derived from the dihydrocoumarins coupled to β-phenylalanine i.e. (S)-2-((R)-5-chloro-8-hydroxy-3-methyl-1-oxoisochroman-7-carboxamido)-3 phenylpropanoic acid (Figure 1) and as contaminant, present in the varieties of foodstuffs and beverages such as cereals, spices, wine grapes [3,4]. The presence of OTA in animal tissue, human blood
Evaluation of Various Factors Affecting Fluorescence
Emission Behavior of Ochratoxin A: Effect of pH,
Solvent and Salt Composition
Atul Sharma*
1,3, Diana Bueno*
2,3, Sunil Bhand
1, Jean Louis Marty
3and Roberto Muñoz
41Biosensor Lab, Department of Chemistry, BITS, Pilani- K K Birla Goa Campus, Zuarinagar 403726, Goa, India
2Bioprocess Department, Biotechnology Interdisciplinary Professional Unit, National Polytechnic Institute, México
3BAE Laboratoire, Université de Perpignan Via Domitia, 52 Avenue Paul Alduy, 66860 Perpignan, Cedex, France
4Bioelectronics Section, Department of Electrical Engineering, CINVESTAV, Mexico
Received: : October 15, 2018; Published: : October 30, 2018
*Corresponding author: Atul Sharma, Biosensor Lab, Department of Chemistry BITS Pilani K K Birla Goa Campus, Zuarinagar- 403726, Goa, India
Diana Bueno, Bioprocess Department, Biotechnology Interdisciplinary Professional Unit, National Polytechnic Institute, México
Abstract
In the present work, a design of customized portable fluorescence imaging system was developed (in-house) to quantify the change in fluorescence emission of fungal toxin ochratoxin A (OTA). OTA is naturally fluorescent, and the fluorescence properties of OTA solutions depend on the pH, solvent polarity and the presence of ligand molecule. In this work, the influence of solvent, pH and salt concentration on OTA fluorescence emission was investigated. The fluorescence properties of OTA in aqueous solutions have been investigated by means of steady-state fluorescence at different pH (range 6.8-8.4), Na+ salt ranges from 10 120mM, buffer solutions and in organic solvents. All the fluorescence measurements were performed through the fluorescence imaging system consists of an ultraviolet light at 365nm and a CMOS sensor controlled by an executable interface designed in MATLAB. The obtained image is decomposed into its red, green and blue component (RGB components) and analyzed.
For each solution, spiked at a concentration of 20 µg L-1 OTA with different conditions (pH, solvent and salt composition), the red, green and blue (RGB) coordinates were obtained and plotted to quantify the effect of the fluorescence emitted by the OTA. The higher fluorescence yielding conditions were identified and results were compared with the commonly used fluoroskan microplate reader. The developed design of fluorescence instrument was successfully employed to study of fluorescence behavior of OTA in different environments. As a potential, the proposed design instrument could be employed to quantify the fluorescence behavior of fluorescence exhibiting target molecules.
Keywords: Fluorescence; pH; Salt Concentration; Fluorescence Imaging; Ochratoxin A
Abbreviations: IARC: International Agency for Research on Cancer; MRL: Maximum Residue Limit; PBS: Phosphate Buffered Saline; UV: Ultraviolet; PMMA: Polymethylmethacrylate; RGB: Red, Green and Blue; OTA: ochratoxin A; MgCl2: Magnesium Chloride; NaCl: Sodium Chloride; Na2HPO4: Di
teratogenicity [5,6]. Recently, the International Agency for Research on Cancer (IARC) has been classified the OTA in group 2B (possible carcinogenic agent in human). The maximum residue limit (MRL) for OTA has been set by the European Community in several foodstuffs such as the MRL of OTA in wine is 2µg kg -1 or 5µg kg-1 in
unprocessed cereal (European Commission 2006 [7]).
Moreover, due to the chronic cases and occurrence of OTA incidences and exposure from contaminated food, there is a need to develop a faster, sensitive, robust and portable method for quantification of OTA. Chromatographic methods, such as high-performance liquid chromatography [8] and thin-layer chromatography [9], are the mainly used for OTA determination. Recently, the advancement in OTA detection methods is based on electropolymerization [10], surface plasmon resonance [11] aptasensors [12,13] utilizing electrochemical and fluorescence-based signal generating principle. Among all, the fluorescence based detection methods gained significant attention due to the ease of reaction, label free detection, diverse measurement methods [14]. The intrinsic fluorescence emission behavior, intensity and sensitivity of the analytical method strongly depends on solution composition, such as concentration and buffer ions, pH of solvent, aqueous-organic phase ratio, temperature etc [14]. Based on the above assumption, in the present work the focus of study was to quantify the effect of pH, solvent composition and temperature variables on the fluorescence emission behavior of OTA by exploration of designing a field portable fluorescence measuring platform. The present results strongly suggested the potential of designed instrument as a portable and affordable cost-effective system for rapid screening and quantification of OTA in real samples. Based on our results, as a generalized fluorescence measuring platform, the proposed platform can be further employed for other target analyte poses fluorescence behavior or in fluorescence-based sensing platforms.
Material and Methods
Chemicals and Reagents
Spectrophotometric cuvettes for fluorescence measurement were procured from Ratiolab (Germany). HEPES (4-(2-hydroxyeth-yl)-1-piperazineethanesulfonic acid) buffer was purchased from Fisher Scientific (USA). All other chemicals and reagents di-sodium hydrogen phosphate (Na2HPO4), potassium di-hydrogen phosphate (KH2PO4), magnesium chloride (MgCl2), potassium chloride (KCl) and sodium chloride (NaCl), acetic acid, ethanol, methanol and acetonitrile of analytical grade were procured from Sigma-Aldrich (France). Ochratoxin A (OTA) derived from Aspergillus ochraceus was purchased from Sigma Aldrich (France).
Solutions Preparation
Phosphate buffered saline (PBS) was prepared be dissolving appropriate amount of 1.44g Na2HPO4, 0.24g KH2PO4 containing 8g NaCl, 0.2g KCl in deionized Milli-Q water. The pH of the buffer was adjusted to 7.4. Similarly, the HEPES binding buffer (HBB, 50mM) was prepared by dissolving appropriate amount of HEPES salt containing 5mM MgCl2, 120mM NaCl and 5mM KCl. The pH
of the buffer was adjusted from 6.8 to 8.2. For HPLC, a mixture of acetonitrile/water/acetic acid (48/51/1) sonicated for 20 minutes was used. A stock standard stock solution of OTA was prepared by dissolving 1 mg of pure crystalline OTA in methanol at a concentration of 1 mg L-1. For working solution, the OTA
stock was further diluted in different solvent before fluorescence measurements.
Instrumentation
A lab based customized (in-house designed) fluorescence image capturing device consist of an Ultraviolet emitter to 360-370nm (NICHIA Corporation) was supplied by Power light systems (Germany). Electronic components were procured from Farnell Element14 and Mouser Electronics (France). Arduino UNO board and a serial port color camera module with CMOS sensor with TTL interface was purchased from Sparkfun (Spain). For image capturing and measurement, a graphical user interface was created in MATLAB R2011a. A fluorescence instrument, Fluoroskan Ascent FL 2.6 (Thermo Scientific, Finland) equipped with Ascent software version 2.6 was used for fluorescence measurements.
Design of Developed System
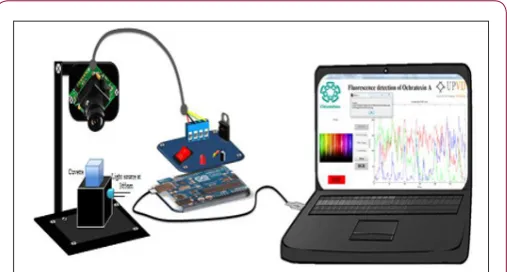
The developed device based on a bracket designed to allocate the sensing module, the serial port camera module and the cuvette into the chamber was used in the proposed work. Polymethylmethacrylate (PMMA) cuvette holder was used for holding cuvette for photometric measurements in the ultraviolet (UV) range. The cuvette outer dimensions are 12.5×12.5×45mm; one hole for the light emitter was drilled into black poly methyl methacrylate cuvette holder at 900 from the serial port camera
module as illustrated in the (Figure 2) The developed system comprises:
Figure 2: Sensing module connected to the final device and
its control with the computer.
Sensing Module
power light with an emission peak at 365nm with 2.7 mW of radiant power. The concentration of the ochratoxin A was determined by exciting UV light. LED voltage regulator (LM317) that is powered by a constant current through the USB port of Arduino UNO was used as power source. The circuit was designed and placed in an electrolytic plate with dimensions of 30×20 mm.
Software
A graphical interface was created in MATLAB R2011a. The developed platform facilitates the acquisition of the data generated by the emission of light and allows a first analysis of data with a choice for automatic file saving for further processing and comparison studies.
Processing
The user does not need to install MATLAB since the interface is an executable file, hence the user need to install the executable file generate in its computer. The developer interface is easy to use, automation of file processing (text file, images, figures, names of files) allowing us to use a portable system.
Recording
The fluorescence emission from the excited sample passes through a lens, to a serial port camera module controlled by the computer. Fluorescence image data from the serial port camera module are analyzed by application software. Images with two dimensions such as photograph captured by optical devices like cameras are considered digital images, which are a numeric representation of a two-dimensional image. The digital image contains a fixed number of rows and columns of pixels. Each pixel is specified by three values for the red, blue and green components of the pixel array. The position of the pixel is described by a pair of coordinates (xi,xj), which indicate the intensity of the pixel (x,y) in the red, green and blue (RGB) component.
Fluorescence Measurements
Effect of Porogen (Solvent) on Fluorescence Intensity: To study the effect of solvent on the fluorescence behavior of OTA, a 20 µg L-1 OTA concentration was prepared in different solvent
such as methanol, ethanol, PBS buffer, acetonitrile, distilled water (Millipore filtered), mobile phase (for HPLC), tap water and HEPES buffer. Similarly, blank was prepared without spiking OTA in the different solvents. Then, 1 mL of volume from each composition was transferred into cuvette and inserted in the chamber for fluorescence measurement. The ultraviolet led excited the sample and the serial port camera module captures the image when the interface design was executed. With the option multiples images, its RGB values, the image to JPEG format and the mean of the RGB components in a text file were obtained automatically and the results were saved.
Effect of pH on Fluorescence Intensity: Under optimized condition, a 20 µg L-1 OTA concentration was prepared in different
buffer ranging pH from 6.8-8.4. All fluorescence measurements were performed in triplicate. Similarly, the blank was prepared without spiking OTA and considered for fluorescence measurements.
All fluorescence measurements were performed by designing a fluorescence measuring instrument and compare with the fluorescence intensity measured through Fluoroskan Multiplate reader.
Effect of Salt Concentration Intensity: To study the salt effect, different concentrations of saline salt (sodium chloride) range from 0-120mM NaCl was studied. The effect of HEPES buffer containing a different salt concentration was studied against concentration of 20 µg L-1 OTA. The fluorescence measurements were performed using
the developer portable system and compare against the result obtained from Fluoroskan measurements. Then, measurements were repeated after 1h. Control measurements were performed without the addition of OTA in buffer under same optimized conditions.
Results and Discussion
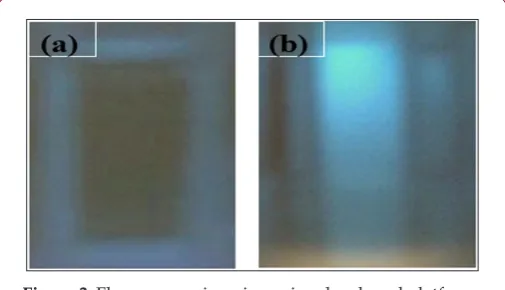
Principle Design: In the proposed work, a design of proposed fluorescence imaging platform was used for the fluorescence measurements as shown in Figure 2. Based on the concept of fluorescence imaging and the RGB color model, the developer interface built a RBG diagram using the recorded fluorescence image. Further, the recorded fluorescence image is decomposed into its red, green and blue component (RGB components) and analyzed by computer. In the present platform, the blue component of RGB diagram was considered because OTA exhibit strong fluorescence in the ultraviolet light Bueno [15]. When the solution containing OTA is excited using UV light, the solution illuminates a blue fluorescence due to the presence of OTA and blank (no fluorescence) respectively as depicted in the Figure 3. For qualitative analysis, the blue component of RGB diagram was taken into consideration. The reason could be attributed to the presence of the high blue component, establishing a direct relation between the blue component and OTA concentration. Control measurements showed the lower value of blue component comparing to sample.
Figure 3: Fluorescence imaging using developed platform.
a. Blank
b. With 20 μg L-1 OTA
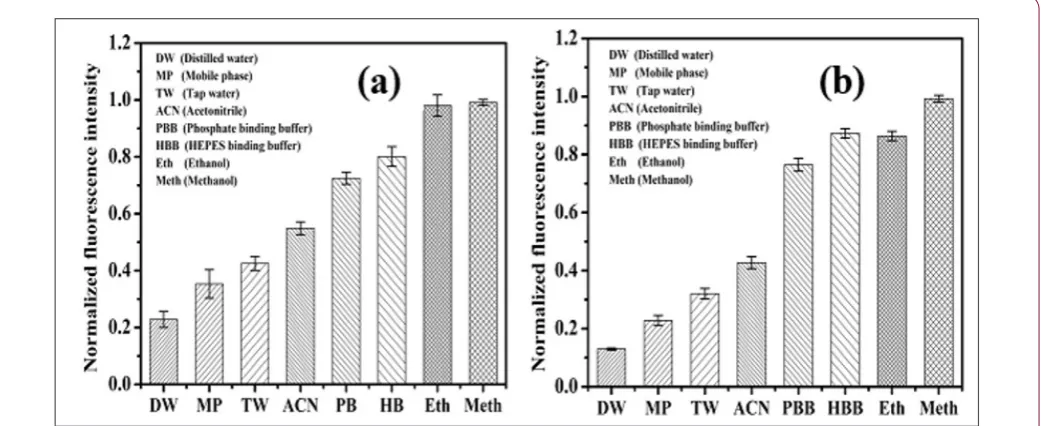
used [16,17]. Fluorescence intensity of OTA obtained in different solvent system at 20µg L-1 OTA using the developed platform as
shown in the Figure 4. The buffer solutions (PBS, HEPES) and the alcohols (Methanol, Ethanol) show the best results with the greatest fluorescence intensity for the OTA. As depicted in the Figure 4a, the OTA showed less fluorescence in distilled water which is due to the opening of the lactone ring of OTA molecule causing
slow decomposition of OTA in water Brow [18]. The significantly higher fluorescence was observed in the buffer and methanol in comparison to the acetonitrile Turner [19]. The obtained results further compared with the fluorescence intensity response recorded using the fluoroskan microplate reader at 360nm. It was observed that the design fluorescence imaging platform has similar type of results as depicted in the Figure 4a & 4b.
Figure 4: Fluorescence intensity response 20 µg L-1 OTA obtained in different solvent.
a. From developed imaging platform. b. From fluoroskan microplate reader (n=3).
Effect of PH on Fluorescence Intensity of OTA: In solution, the OTA shows a pH dependent fluorescence behavior due to the presence of acidic and basic functional entities in OTA structure, which greatly influence by its protonation state [3]. It was observed in the Figure 5a, that fluorescence intensity increase with increase pHof HEPES buffer from 6.8 to 7.2 and equilibrated. No further in
-crease in fluorescence intensity was observed with further in-crease in pH. The maximum fluorescence response was recorded at pH 7.2. Indeed, the increase in pH shifts the environment from acidic to al-kaline, which results in the hydrolysis of lactone ring causing ring opening [16,2]. Thus, the obtained result limits the analysis of OTA at high pHthat will lead to negative analysis [20].
Figure 5: Fluorescence intensity response 20 µg L-1 OTA obtained in HEPES buffer ranging pH from 6-8.4 .
Effect of Salt Composition of Fluorescence Intensity of OTA: The presence of salt concentration is an important parameter, which significantly affects the fluorescence emission of the fluoro -phore. To study the phenomenon of fluorescence emission of OTA, the effect of different salt concentration of buffer was tested [5]. As demonstrated in Figure 6a, the fluorescence emission intensity of OTA increases with increase in concentration of Na+ salt ranges
from 10-120m [11]. Thus, obtained result strongly suggested that the salt concentration has a significant effect on the fluorescence emission of OTA. Further, since, the concentration of optimized salt is optimal for binding interaction of OTA, thus to avoid the effect of excess salt concentration, higher concentrations were not tested [21].
Figure 6: Fluorescence intensity response 20 μg L-1 OTA obtained in HEPES at pH 7.2 with different concentration of NaCl.
a. From developed imaging platform b. From fluoroskan microplate reader (n=3).
Comparative Study With Fluoroskan Microplate Reader: Under optimized conditions, the result obtained from the developing fluorescence imaging system was compared against the results from commonly used fluoroskan microplate reader. As shown in the Figures 4b, 5b & 6b, the developed system showed the similar type of results comparing to the microplate reader. The obtained results strongly suggested that the developed system has significant potential in fluorescence imaging. The proposed system can be further employed in analysis of the target molecule on the basis of fluorescence intensity calculation considering the blue component of RGB diagram [22,23].
Conclusion
In conclusion, the present work reported a universal fluorescence imaging system based on analysis of red, green and blue (RGB diagram) component recorded from fluorescence imaging of samples. The present platform was successfully employed for quantification of OTA based on analysis of fluorescence emission. The influence of solvent, pH and ionic strength of fluorescence emission of OTA was investigated. The maximum fluorescence intensity response was observed in the buffer and alcoholic solvent. The pH studies suggested the structure dependent fluorescence emission pattern. The presence
of salt concentration in measurement solution has significant effects on fluorescence emission i.e. the high salt concentration reveal the high fluorescence. The developed method was evaluated with the fluorescence intensity recorded on the existing Fluoroskan platform. The obtained result suggests that the developed imaging platform could be successfully employed for fluorescence imaging and can be applied for the sensitive determination of OTA. As a generalized fluorescence imaging platform, the present design could be further employed for fluorescence imaging of the analyte of interest based on their fluorescence behavior.
Acknowledgments
Atul Sharma would like to thank EUPHRATES program for ERASMUS Mundus doctoral fellowship. Diana Bueno would like to thanks to CONACYT and PCP Mexico-France for the doctoral fellowship.
Conflict of Interest
Authors declare no conflict of interest.
References
2. Bazin I, Faucet Marquis V, Monje MC, El Khoury M, Marty JL, et al. (2013) Impact of pH on the Stability and the Cross-Reactivity of Ochratoxin A and Citrinin. Toxins (Basel) 5(12): 2324-2346.
3. Il’ichev YV, Perry JL, Manderville RA (2001) The pH dependent primary
photoreactions of Ochratoxin A. J Phys Chem B 105(45): 11369-11376. 4. Duarte SC, Pena A, Lino CM (2010) A review on ochratoxin A occurrence
and effects of processing of cereal and cereal derived food products. Food Microbiol 27(2): 187-198.
5. Pfohl Leszkowicz A, Manderville RA (2007) Ochratoxin A: An overview on toxicity and carcinogenicity in animals and humans. Mol Nutr Food Res 51(1): 61-99.
6. Duarte SC, Lino CM, Pena A (2011) Ochratoxin A in feed of food-producing animals: An undesirable mycotoxin with health and performance effects. Vet Microbiol 154(1): 1-13.
7. European Commission (2006) European Commission. Commission Regulation (EC) No. 1881/2006 of 19 December 2006 setting maximum levels for certain contaminants in foodstuffs. J Eur Union 364(5): 11-14. 8. Toscani T, Moseriti A, Dossena A (2007) Determination of ochratoxin
A in dry-cured meat products by a HPLC-FLD quantitative method. J Chromatogr B Anal Technol Biomed Life Sci 855(2): 242-248.
9. Sforza S, Dall Asta C, Marchelli R (2006) Recent advances in mycotoxin determination in food and feed by hyphenated chromatographic techniques/mass spectrometry. Mass Spectrom Rev 25(1): 54-76. 10. Zhang J, Chen J, Zhang X (2012) An electrochemical biosensor based on
hairpin-DNA aptamer probe and restriction endonuclease for ochratoxin A detection. Electrochem commun 25: 5-7.
11. Yu JCC, Lai EPC (2004) Polypyrrole film on miniaturized surface plasmon resonance sensor for ochratoxin A detection. Synth Met 143(3): 253-258.
12. Liu WT, Wu JH, Li EY, Selamat E (2005) Emission Characteristics of Fluorescent Labels with Respect to Temperature Changes and Subsequent Effects on DNA Microchip Studies. Appl Environ Microbiol 71(10): 6453-6457.
13. Sharma A, Hayat A, Mishra RK (2015) Titanium dioxide nanoparticles (TiO<inf>2</inf>) quenching based aptasensing platform: Application to ochratoxin a detection. Toxins (Basel) 7(9): 3771-3784.
14. Sharma A, Hayat A, Mishra RM, Catanante G, Shahid SA, et al. (2016) Design of a fluorescence aptaswitch based on the aptamer modulated nano-surface impact on the fluorescence particles. RSC Adv 65579-65587.
15. Bueno D, Muñoz R, Marty JL (2016) Fluorescence analyzer based on smartphone camera and wireless for detection of Ochratoxin A. Sensors Actuators B Chem 232: 462-468.
16. Frenette C, Paugh RJ, Tozlovanu M, Juzio M, Pfohl Leszkowicz A, et al. (2008) Structure-activity relationships for the fluorescence of ochratoxin A: insight for detection of ochratoxin A metabolites. Anal Chim Acta 617(1): 153-161.
17. Steinbrück D, Rasch C, Kumke MU (2008) Photophysics of Ochratoxin A in aqueous solution. Zeitschrift für Naturforsch 63(11): 1321-1326. 18. Brow MEM, JD, Wright MMW, Gillman IG, Manderville RA (2002)
Photochemically catalyzed reaction of ochratoxin A with D- and L-cysteine. Photochem Photobiol 76(6): 649-656.
19. Turner N, Piletska E, Karim K (2004) Effect of the solvent on recognition properties of molecularly imprinted polymer specific for ochratoxin A. Biosens Bioelectron 20(6): 1060-1067.
20. Chauhan R, Singh J, Sachdev T (2016) Recent Advances in Mycotoxins Detection. Biosens Bioelectron 81: 532-545.
21. Cruz Aguado JAJ, Penner G (2008) Determination of Ochratoxin A with a DNA Aptamer. J Agric Food Chem 56(22): 10456-10461.
22. Hayat A, Sassolas A, Marty JL, Radi AE (2013) Highly sensitive ochratoxin A impedimetric aptasensor based on the immobilization of azido-aptamer onto electrografted binary film via click chemistry. Talanta 103: 14-19.
23. Wu J, Chu H, Mei Z (2012) Ultrasensitive one-step rapid detection of ochratoxin A by the folding-based electrochemical aptasensor. Anal Chim Acta 753(13): 27-31.
Submission Link: https://biomedres.us/submit-manuscript.php
Assets of Publishing with us • Global archiving of articles
• Immediate, unrestricted online access • Rigorous Peer Review Process • Authors Retain Copyrights • Unique DOI for all articles
https://biomedres.us/
This work is licensed under Creative Commons Attribution 4.0 License
ISSN: 2574-1241