A Simulation Model for the Spiral Software
Development Life Cycle
Sonia Thind
1, Karambir
2M.Tech Student, Dept. of CSE., UIET, Kurukshetra University, Kurukshetra, India1
Assistant Professor, Dept. of CSE., UIET, Kurukshetra University, Kurukshetra, India2
ABSTRACT: Software engineering provides methodologies, concepts and practices, which are used for analysing, designing, building and maintaining the information in a software industry. Software Development Life Cycle (SDLC) model is an approach used in the software industry for the development of various size projects: small scale projects, medium scale projects and large scale projects. A software project of any size is developed with the co-ordination of development team. Therefore it is important to assign resources intelligently to the different phases of the software project by the project manager. This study proposes a model for the spiral development process with the use of a simulator (Simphony.NET), which helps the project manager in determining how to increase the productivity of a software firm with the use of minimum resources (expert team members). This model increase the utilization of different development processes by keeping all development team members busy all the time, which helps in decrease idle and waste time. As future work, many other SDLC models like incremental, prototype etc. will be simulated, in order to find which simulation model is best for the software firm.
KEYWORDS: Simulation & Modelling, Spiral Model, SDLC model, Software engineering, Simphony.NET
I. INTRODUCTION
In a software industry software projects of various sizes are developed by using many development principles and approaches. Similarly, SDLC models are such type of methodologies which are used for the development of software project with their different development phases like analysis phase, designing phase, programming phase, testing phase and maintenance phase [1]. In effect, many SDLC models are deeply investigated and studied by many practitioners in the world. The waterfall model, spiral model, incremental model, rapid prototyping model and agile model are few most successful SDLC models.Many software development industries adopted Spiral model as their prime development approach for the maintaining, designing, planning and programming of the software projects [2]. Spiral model’s each phase is handled by the team of expert employees, for example, business analysis department; software coding and programming department; software maintenance department. However, assigning the appropriate and exact number of expert team members (resources) for each phase of the spiral model is a very confusing work for the project manager of a software firm. In order to increase or maximize the productivity it is very important to find the optimal number of resources that should be assigned to each phase of the spiral model and completes a particular phase or task. That’s why, simulation for the SDLC model is required in order to determine the appropriate number of expert team members which are necessary to fulfil a certain project of a certain scale.Relatedly, a simulation [3] of a system is the operation of a model of the system. The model can be reconfigured, studied, experimented and analysed properly. Simulation is used before an existing system is altered or a new system built to reduce the chances of failure, to eliminate unforeseen bottlenecks, to prevent over-utilization of resources, and to optimize the performance.
II. THE SPIRAL SDLC MODEL
risk-driven behaviour of the spiral process model helps in directing the stakeholders in the development of the project. The software developed with the use of Spiral model is produced in a series of evolutionary iterations. The initial release of the software product might be a prototype model or paper model.As shown in the fig.1 Spiral model is divided into many framework activities. These activities represent segments of the Spiral path. The software team performs their tasks around the Spiral model in a clock-wise direction. Every pass through the Spiral process model is made up of requirement analysis phase, designing phase, coding phase, testing phase and maintenance phase.
Fig.1 Boehm’s Spiral model
III. RELATED WORK
In [5] author proposed and evaluated a SDLC model and by the use of communication and collaboration among stakeholder, improved system implementation can be successfully achieved. In [6] author focused on the productivity measurements of software development team and provides techniques and models to measure the productivity. In [7] author provided guidelines for conducting a successful simulation study. The guidelines provided for the complete life cycle of a simulation study are composed of 10 phases, 13 credibility assessment stages and 10 processes. In [8] author introduced the Software Engineering Process Simulation (SEPS) model for the dynamic simulation of the software project development process. SEPS is a planning tool to inspect agenda, trade-offs of cost, functionality and to test the implications of different managerial strategies on a project’s outcome. In [9] author made a simulation model for the Waterfall development process. This model is built using the Simphony.NET [10] simulation tool. In this paper author’s part is to help project managers in determining how to attain the maximum productivity with the minimum number of hours, expenses and workers. In [11] author made a comparative study between iterative waterfall and incremental software development life cycle model for improving the resources using the Simphony.NET simulation tool. All the phases consisted in the iterative waterfall and incremental model are simulated.
IV. MOTIVATION AND PROBLEM DEFINITION
customer. The main reason behind this is the assignment of expert team members unintelligently to the various phases of the SDLC models. For this reason, some phases of the process model may be stay idle, while other may be delayed, due to the insufficient number of resources.The proposed simulation model for Spiral SDLC helps the project manager in determining how to increase the productivity of a software firm with the use of minimum resources. This model increase the utilization of different processes by keeping all development team members busy all the time, which help in decrease idle and waste time.
Table1. Factors affecting the software industry
S.no Notation used Name of Factor
1 F1 Type of project
2 F2 Size of project
3 F3 Duration of project
4 F4 Complexity of project
5 F5 Type and level of Expected risk
6 F6 Understanding level of user requirements
7 F7 Understanding level of application areas
8 F8 Involvement of customer
9 F9 Developer’s experience
10 F10 Team size
11 F11 Man machine interaction
12 F12 Availability of technology and tools
13 F13 Software product versions
14 F14 Required level of reliability
V. ASSUMPTIONS AND SPECIFICATION
For the simulation of Spiral SDLC model, following assumptions are made:
As we have discussed, the Spiral model which moves in clock-wise direction and the final product is delivered in many incremental iterations. That’s why in this simulation model a feedback loop is used in order to include the probability of failure concept. We can use the Symphony.NET tool with the spiral model to determine the optimized expert team members. For this purpose, we can assume that, we can deliver the complete software product in 5 increments of the spiral simulation model. And for each increment of the simulation model, necessary and optimal resources can be determined.We can assume that the software projects arrive randomly in a software firm. We divide the projects into three types:Small Scale Projects, Medium Scale Projects and Large Scale Projects
Let us assume that 60% projects are small scale projects, 30% projects are medium scale projects and 10% projects are large scale projects. The projects arrive randomly and the inter-arrival time of software project is fixed by using triangular distribution function. The minimum arrival time of a software project is 20 days, maximum time is 40 days and the average time is 30 days.
Mathematically, as in eq. (1)
eq. (1)
The Spiral model uses five SDLC phases and let us assumes that the number of available expert team member for each phase, at the software firm are:15 business analyst, 20 business designer, 30 business programmer, 35 business tester, 15 business maintenance men.
small-scale software projects require 1 business analyst, 2 business designer, 3 business programmer, 4 business tester and 2 business maintenance.
Medium scale software projects require 7 business analyst, 10 business designers, 15 business programmers, 25 business testers and 10 business maintenance.
Large scale software projects require 15 business analysts, 20 business designer, 30 business programmers, 35 business testers and 15 business maintenance men.
The time duration of each phase of the model to be completed is defined as follows:
A. For small scale projects
The lower limit of 2 days, upper limits of 3 days with uniform distribution are assumed for business analysis phase as in eq. (2):
eq. (2)
The time duration for designing phase is simulated by using exponential distribution, with mean = 2. The time duration for programming phase is simulated by using exponential distribution, with mean = 4. The lower limit of 6 days and an upper limit of 10 days with uniform distribution are assumed for business
testing phase as in eq. (3):
eq. (3)
The lower limit of 2 days and an upper limit of 3 days with uniform distribution are assumed for business maintenance phase. The equation is same as equation (2).
B. For medium scale projects
The lower limit of 5 days, upper limit of 10 days with uniform distribution are assumed for business analysis phase as in eq. (4):
eq. (4)
The duration (time) for designing phase is simulated by using exponential distribution, with mean = 8. The duration (time) for programming phase is simulated by using exponential distribution, with mean = 15. The lower limit of 10 days and an upper limit of 20 days with uniform distribution are assumed for business
testing phase as in eq. (5):
eq. (5)
The lower limit of 7 days and an upper limit of 10 days with uniform distribution are assumed for business maintenance phase as in eq. (6):
eq. (6)
C. For large scale projects
The lower limit of 10 days and an upper limit of 20 days with uniform distribution are assumed for business analysis phase. The equation is same as equation (5).
The time duration for designing phase is simulated by using exponential distribution, with mean = 25. The time duration for programming phase is simulated by using exponential distribution, with mean = 35. The lower limit of 30 days and an upper limit of 35 days with uniform distribution are assumed for business
eq. (7)
The lower limit of 15 days and an upper limit of 20 days with uniform distribution are assumed for business maintenance phase as in (8):
eq. (8)
We can also assume that each phase of the model, for different size projects upon completion may show the following probability of having an error: for small scale project = 5%, for medium scale project = 10% and for large scale project = 35%.
VI. THE SIMULATION MODEL FOR SPIRAL SDLC
The proposed model consists of many modelling elements like capture, release, task, file, counter and resource. For this model resources are the expert team members assigned on different phases of the spiral model. The simulation model for different phases of Spiral model is shown in the figure.2 below.
Fig.2 Simulation model for small scale projects
and a release element. The capture element links a specific resource to a specific task and the release modelling element releases the resources (expert team members) from the task element when it is completed
VII. SIMULATION RESULTS & ANALYSIS
A. Statistics obtained for simulating the spiral model
Using the symphony.NET environment, we can execute the simulation model 5 times, for 368.67 milliseconds with 60 incoming projects. Following table.1 and table.2 shows the statistics obtained after running the model including average mean of the number projects delivered and the average utilization for each phase, for each increment of different scale projects.
Table.2 Average Mean for the simulation model
Type of projects delivered
Number of projects
Average Mean
Small scale project 36 52.765
Medium scale project 18 50.765
Large scale project 6 46.765
Table.3 Average utilization for different scale projects
Resource name
Average utilization for:
Small scale projects Medium scale projects Large scale projects Business
Analyst
35.8% 18.4% 26.0%
Business designer
34.7% 18.1% 26.1%
Business programmer
33.6% 16.2% 26.3%
Business tester
34.7% 18.1% 25.7%
Business maintenance
34.2% 15.6% 25.6%
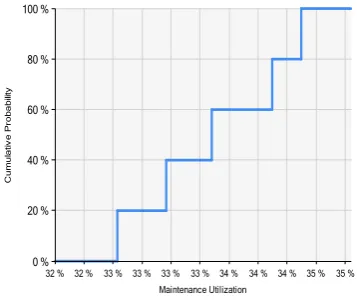
B. Graphical representation of resource utilization for small scale projects
After successfully running the simulation model 5 times, for small scale projects, different- different graphs for each type of resource utilization is generated by using the simulator symphony.NET 4.0. with the Spiral model phases. The cumulative probability on y-axis relative to the utilization of various resources on x-axis is used to present maximum utilization of resources (analysts, designer, programmer, tester and maintenance) for small scale projects.
Fig. 3 Utilization of the analyst resourceFig. 4 Utilization of the designer resource
Fig. 5 Utilization of the programmer resource Fig. 6 Utilization of the tester resource
Fig. 7 Utilization of the Maintenance resource 0 % 20 % 40 % 60 % 80 % 100 % C u m u la tiv e P ro b a b ili ty
34 % 35 % 35 % 36 % 36 % 37 %
Analyst Utilization 0 % 20 % 40 % 60 % 80 % 100 % C u m u la tiv e P ro b a b ili ty
33 % 34 % 34 % 35 % 35 % 36 %
Designer Utilization 0 % 20 % 40 % 60 % 80 % 100 % C u m u la tiv e P ro b a b ili ty
33 % 34 % 34 % 35 % 35 % 36 %
Programmer Utilization 0 % 20 % 40 % 60 % 80 % 100 % C u m u la tiv e P ro b a b ili ty
33 % 34 % 34 % 35 % 35 % 36 % 36 %
Tester Utilization 0 % 20 % 40 % 60 % 80 % 100 % C u m u la tiv e P ro b a b ili ty
VIII. CONCLUSION AND FUTURE WORK
This paper proposes a model for the spiral development process with the use of a simulating tool (Simphony.NET). This model helps the software project manager in determining how to increase the productivity of a software firm with the use of minimum resources. We can assume three size projects: small scale projects, medium scale projects and large scale projects. A software project of any size is developed with the co-ordination of development team. Therefore it is important to assign team members intelligently to the different phases of the software project by the project manager. This model increase the utilization of different development processes by keeping all development team members busy all the time, which helps in decrease idle and waste time.
As future work, many other SDLC models like incremental model, prototype model etc. will be simulated, in order to determine the best simulation model for a software firm.
REFERENCES
[1] Ian Sommerville, “Software Engineering,” Addison Wesley. 9thed.,2010.
[2] N. Munassar and A. Govardhan, “A Comparison between five Models of Software Engineering,” IJCSI International Journal of Computer Science Issues, Vol. 7, no. 5,2010.
[3] Osman Balci, Richard E. Nance, E. Joseph Demck, Emest H. Page and John L. Bishop, "Model Generation Issues in a Simulation Support Environment," in Proceedings of the I990 Winter Simulation Conference.
[4] Roger S.Pressman, “Software engineering: A practitioner approach”, ISBN 0-07-365578-3,5th ed., TMH, 2001.
[5] S.Cohen, D.Dori, U.de Haan, “A Software System Development Life Cycle Model for Improved Stakeholders Communication and Collaboration,” International journal of Computers, Communications & Control, ISSN 1841-9836, E-ISSN 1841-9844, pp.20-41, 2010.
[6]Goparaju Purna Sudhakara, Ayesha Farooq, Sanghamitra Patnaik, “Measuring Productivity of Software Development teams,”Serbian Journal of Management, pp. 65 – 75, 2012.
[7] Balci, O.,“Guidelines for successful simulation studies,”Proceedings of the Winter Simulation Conference, pp. 25-32, 1990.
[8] Chi Y. Lin, Tarek Abdel-Hamid, Joseph S. Sherif,“Software-Engineering Process Simulation Model (SEPS),” Journal of Systems and Software,Vol.38, issue no. 3, pp.263-277, 1997.
[9] Youssef Bassil, “A Simulation Model for the Waterfall Software Development Life cycle”, International Journal of Engineering&Technology, ISSN: 2049-3444, vol.2, no.5, 2012.
[10] Simphony.NET (4.0), University of Alberta, [Online], Available: http://irc.construction.ualberta.ca/html/research/software/simphony.net.html
[11] Prakriti Trivedi, Ashwani Sharma, "A Comparative Study between Iterative Waterfall and Incremental Software Development Life Cycle Model for Optimizing the Resources using Computer Simulation,”Information Management in the Knowledge Economy (IMKE), pp. 188-194, IEEE, 2013. [12] Rupa Mahanti, M.S. Neogi and Vandana Bhattacherjee, “Factors Affecting the Choice of Software Life Cycle Models in the Software Industry-An Empirical Study,”Journal of Computer Science (Science Publications), pp.1253-1262,ISSN 1549-3636, 2012.