www.ijiset.com
PSO Based MPPT of PV System under Partial Shading Condition
Saurabh Tripathi
#, Vinay Kumar Tripathi
*#Electrical Engineering, Sam Higginbottom University of Agriculture Technology and Sciences Allahabad, Uttar Pradesh India.
*Assistant Professor, Dept. of Electrical Engineering, SIET, SHUATS, Allahabad, Uttar Pradesh, India
Abstract
—
The execution of a photovoltaic (PV) cluster is influenced by temperature, sunlight based insolation, shading, and exhibit setup. Regularly, the PV exhibits get shadowed, totally or halfway, by the passing mists, neighboring structures and towers, trees, and utility and utility poles. The circumstance is exceptionally compelling in the event of extensive PV establishments, for example, those utilized as a part of conveyed control age plans. Under somewhat shaded conditions, the PV qualities get more mind boggling with different pinnacles. However, it is essential to comprehend and foresee them keeping in mind the end goal to remove the greatest conceivable power. This paper introduces a MATLAB-based displaying and recreation plot reasonable for concentrate the I– V and P– V attributes of a PV cluster under a no uniform insolation because of incomplete shading. It can likewise be utilized for creating and assessing new most extreme power point following systems, particularly for somewhat shaded conditions. The proposed models helpfully interface with the models of energy electronic converters, which is an exceptionally valuable element. It can likewise be utilized as an instrument to consider the impacts of shading designs on PV boards having diverse setups. It is watched that, for a given number of PV modules, the exhibit setup (what number of modules in arrangement and what number of in parallel) essentially influences the most extreme accessible power under somewhat shaded conditions. In addition, by far most of the present designs can't expel most outrageous power from the PV show under these conditions. This paper proposes a novel count to track the overall power peak under fairly shaded conditions. The meaning of the computation relies upon a couple of essential recognitions made out of an expansive examination of the PV properties and the lead of the worldwide and close-by peaks under deficiently shaded conditions. The proposed count works in conjunction with a dc– dc converter to track the GP. With a particular ultimate objective to animate the accompanying speed, a feedforward control plot for working the dc– dc converter is moreover proposed, which uses the reference voltage information from the accompanying figuring to push the operation toward the MPP.1. INTRODUCTION
The regularly expanding interest for ease vitality and developing worry about ecological issues has produced colossal enthusiasm for the use of nonconventional vitality sources, for example, the sunlight based vitality. The unreservedly and plentifully accessible sun oriented vitality can be effectively changed over into electrical vitality utilizing photovoltaic (PV) cells. A PV source has the upside of low upkeep cost, nonattendance of moving/turning parts, and contamination free vitality change process. Nonetheless, a noteworthy disadvantage of the PV source is its inadequacy amid the evenings or low insolation periods or amid mostly
shaded conditions. High beginning capital cost has been another impediment in the notoriety of PV frameworks [1]. These downsides in any case, the PV frameworks have risen as a standout amongst the most famous other options to traditional vitality, because of the progression in innovation and positive government arrangements in a few nations. A noteworthy test in the utilization of PV is postured by its nonlinear current– voltage (I– V) attributes, which result in a one of a kind greatest power point (MPP) on its power– voltage (P– V) bend. The issue is additionally confounded because of the reliance of these qualities on sun based insolation and temperature. As these parameters change consistently, MPP additionally differs. Considering the high beginning capital cost of a PV source and its low vitality change proficiency, it is basic to work the PV source at MPP with the goal that greatest power can be removed. As a rule, a PV source is worked in conjunction with a dc– dc control converter, whose obligation cycle is adjusted so as to track the prompt MPP of the PV source. A few following plans have been proposed [2]– [12]. Among the prevalent following plans are the irritate and watch (P&O) or slope climbing [4], [5], incremental conductance [8], cut off [2], open-circuit voltage [7], and swell relationship approaches [6]. Some changed strategies have likewise been proposed, with the goal of limiting the equipment or enhancing the execution [7], [9]– [12]. The following plans specified above are successful and time tried under uniform sun based insolation, where the P– V bend of a PV module displays just a single MPP for a given temperature and insolation. Bruendlinger et al. have tried different monetarily accessible inverters in incompletely shaded conditions and have discovered that the power misfortune because of shading can be as high as 70% [13]. Under mostly shaded conditions, when the whole cluster does not get uniform insolation, the P– V qualities get more mind boggling, showing numerous pinnacles [only one of which is the worldwide pinnacle (GP); the rest are neighbourhood peaks] [14]. An explanatory model, in view of Lambert capacity and its properties, has been exhibited [15]. It is equipped for mimicking the nearness of numerous crests under different conditions like diverse insolation and temperature levels, shading designs, befuddle, and so forth. The computational time and the memory required by this model is less. The nearness of various pinnacles diminishes the adequacy of the current MPP following (MPPT) plans, which accept a solitary pinnacle control point on the P– V trademark. The event of mostly shaded conditions being very normal (e.g., because of mists, trees, and so on.), there is a
www.ijiset.com
need to create exceptional MPPT plans that can track the GP under these conditions. The other choice is to utilize clever PV modules [16] or substituting current modules.
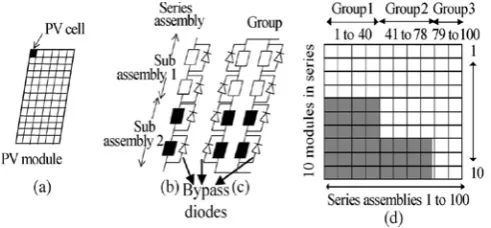
Fig. 1. Terminology used for the various components of a partially shaded PV array. (a) PV module. (b) Series assembly with two
subassemblies. (c) Group. (d) Array with three groups.
A few specialists [17]– [19] have taken a shot at GP following plans for PV clusters working under no uniform insolation conditions. Miyatake et al. [17] have revealed a MPPT conspire that utilizations Fibonacci arrangement to track the GP under mostly shaded conditions. In any case, the technique does not ensure GP following under all conditions. Kobayashi et al. [18] have proposed a two-arrange strategy to track the GP. In the main stage, the working point moves into the region of the GP on the heap line Rpm = Vpm/Ipm, and in the second stage, it focalizes to the genuine GP. Vpm and Ipm are roughly equivalent to 80% and 90% of the open-circuit voltage VOC and short out current ISC of the PV exhibit, individually. Be that as it may, in this strategy, if the GP lies on the left half of the heap line (Rpm), i.e., Rpm > Ractual (where Ractual = Vactual/Iactual), the working point is briefly moved to 90% of VOC, along these lines missing the GP. Solodovnik et al. [19] have recommended a state space-based way to deal with look through the GP. This technique is quick and precise yet is framework particular, is mind boggling, and requires more sensors.
2 CRITICAL OBSERVATIONS UNDER PARTIALLY SHADED CONDITIONS
Utilizing a recreation demonstrate created in the MATLAB/SIMULINK programming [20], the creators have led a complete investigation of the I– V and P– V attributes of the somewhat shaded PV exhibit. This model uses an extraordinary phrasing to portray the in part shaded exhibit, as delineated in Fig. 1. The wording helps in rearranging the unpredictable shading example of the vast PV cluster and, thus, to examine the qualities of the huge halfway shaded PV exhibit. A PV module [Fig. 1(a)] is thought to be shaded if at least three of its cells are accepting lower than typical insolation. Arrangement associated PV modules, accepting comparable insolation, frame a "subassembly" [Fig. 1(b)]. A few arrangement associated subassemblies, each with an alternate level of insolation, shape a "arrangement get
together" [Fig. 1(b)]. A "gathering" is comprised of a few comparative arrangement gatherings (having indistinguishable P– V attributes) associated in parallel [Fig. 1(c)]. Different parallel-associated gatherings, with various shading designs constitute a PV exhibit [Fig. 1(d)]. Fig. 2 demonstrates the P– V bends, got utilizing the created display, for a PV cluster having 900 modules (10 in arrangement × 90 in parallel) with a mind boggling shading design (having a few gatherings).
Fig.2. PV Curve
Fig. 2 shows the P–V curves for the array at different insolation levels. For further discussion, the simpler example of the shaded PV array shown in Fig. 1(d), having only three distinct groups, is considered. It is observed that the peaks
PS1, PS2, and PS3 occur at V1 = 65 V, V2 = 114 V, and V3 = 163 V, respectively. It is important to note that since four modules are unshaded in each series assembly of group 1, the peak PS1 occurs nearly at voltage V1 = 4× 16.3 = 65 V, where 16.3 V is 80% of the open-circuit voltage of the module (VOC_module) considered. A similar reasoning can be applied to PS2 and PS3, which occur at nearly V2 (= 7 × 16.3 = 114 V) and V3 (= 10 × 16.3 = 163 V), respectively. Hence, the peaks PAmax1, PAmax2, and PAmax3 occur nearly at the voltages V1, V2, and V3, respectively. A significant outcome of this observation is that the array power peaks are displaced from each other by an integral multiple of 80% of
VOC_module (n × 0.8 × VOC_module), where “n” is an integer. As the minimum integral difference in the number of shaded modules between the series assemblies of two groups is one, the minimum possible displacement between two consecutive peaks is 0.8 × VOC_module. In Figs. 1(d) and 2, the number of shaded modules in the series assemblies decreases as one moves from the first series assembly to the last one (i.e., from left to right).
3 DUTY CYCLE COMPUTATION FOR DC–DC CONVERTER CONTROL
Fig. 3(a) shows the circuit schematic of a boost-type dc–dc power converter whose duty cycle is modulated as per the algorithm used for electrical tracking of the MPP. In a conventional controller working with the P&O method, duty cycle (D∗) is generated as follows [22]:
www.ijiset.com
D* = 1− (Vref/Vo) (1)
where Vref is the reference voltage obtained using the MPPT algorithm described in Section 3, and Vo is the output voltage of the dc–dc converter. It is observed that such a controller is slow to respond. The proposed controller overcomes this drawback. Here, the control signal for dc–dc converter is obtained in a feedforward manner, as shown in Fig. 3(b). The controller is fast to respond and can quickly track the MPP. The principle involved in this controller can be mathematically explained as under. If ΔD is the perturbation in the actual duty cycle D, then
D+ΔD = 1− (Vpv +ΔVpv)/(Vo +ΔVo) (2)
where Vpv is the PV array voltage, while ΔVpv and ΔVo are changes in PV array and output voltages of the dc–dc converter, respectively.
If ΔVo _ Vo, then (2) leads to (3) as follows:
ΔD = −ΔVpv/Vo. (3)
Fig. 3. (a) Circuit schematic for boost converter used for tracking MPP. (b) Proposed control scheme for the dc–dc converter. (LB = 5 mH, Cp = 2000 μH, Cf = 1000 μH, and Lf
= 0.1 mH).
Fig. 4. P–V characteristic for the array of Fig. 1(d), with solar insolation of 1000 W/m2.
This additional disturbance ΔD, when subtracted from the actual duty cycle D, amplifies the disturbance toward the MPP, and therefore, the MPP is attained quickly. The above mathematical analysis is explained with the help of Fig. 4, which shows the P–V curve of the array represented by Fig. 1(d). Point A indicates the initial operating point for which the PV array output voltage is Vin. To reach the MPP, the conventional controller sets the reference voltage Vref by giving a perturbation (here, reduction in the operating voltage) in such a way that the movement is toward the MPP. Vref is then used to calculate the new duty cycle D∗. As Vref < Vin, the new duty cycle, D∗= 1− (Vref/Vo), increases. As a result, the same output voltage Vo can be obtained by having a smaller PV array voltage. Thus, the operating point moves toward the MPP. In the proposed controller, an additional disturbance ΔD = k × (Vref − Vin) is introduced in the duty cycle computation, where “k” is a positive constant.
At Vref <Vin, ΔD is negative. The duty cycle for the next switching cycle is determined by two terms, namely
1) 1 − (Vref/Vo) and
2) ΔD, as given in the following:
D* = 1− Vref/Vo − ΔD. (4)
Similar to a conventional controller, the first term’s effect is an increase in the duty cycle for the next switching cycle. In addition, as ΔD is negative, the second term also increases the duty cycle. Hence, for the same output voltage Vo, the decrease in PV array voltage is much more than the previous case, which restores the MPP much faster than the conventional method.
4 SIMULATION RESULTS
This section presents the simulation results with the proposed algorithm. Fig. 5 shows the PV output current
Fig.5. PV Output Current
Figure 6 shows the PV output power.
www.ijiset.com
Fig.6. PV output Power
Fig.7. Power PSO
Fig.8. PSO Current
Fig.9. PV curve
Fig.10. Voltage PSO
5 CONCLUSIONS
A strategy to acquire the I– V and P– V qualities of a PV cluster, having countless and additionally parallel-associated modules, under somewhat shaded conditions is portrayed. The PV bends demonstrate numerous crests under halfway shaded conditions. The current MPPT plans, which accept an extraordinary most extreme power point, in this way, stay lacking. The greatness of the worldwide pinnacle is reliant on the PV exhibit setup and shading design other than the generally known components, i.e., insolation level and temperature. It is shown that, if the presumable shading design on the PV cluster is known, the recreation display is convenient to plan the most ideal arrangement of the PV exhibit to extricate the greatest power. The outcomes acquired with this model can be successfully utilized with disconnected capacities of MATLAB/SIMULINK to research the adequacy of MPPT techniques working under no uniform insolation conditions.
REFERENCES
[1] J. H. R. Enslin, M. S. Wolf, D. B. Snyman, and W. Swiegers, “Integrated photovoltaic maximum power point tracking converter,” IEEE Trans. Ind.
Electron., vol. 44, no. 6, pp. 769–773, Dec. 1997. [2] T. Noguchi, S. Togashi, and R. Nakamoto,
“Short-current pulse-based maximum-power-point tracking method for multiple photovoltaic and converter module system,” IEEE Trans. Ind. Electron., vol. 49, no. 1, pp. 217–223, Feb. 2002.
[3] V. Salas, E. Olias, A. Barrado, and A. Lazaro, “Review of the maximum power point tracking algorithms for stand-alone photovoltaic systems,”
Sol. Energy Mater. Sol. Cells, vol. 90, no. 11, pp. 1555–1578, Jul. 2006.
[4] C. Hua, J. Lin, and C. Chen, “Implementation of a DSP-controlled photovoltaic system with peak power tracking,” IEEE Trans. Ind. Electron., vol. 45, no. 1, pp. 99–107, Feb. 1998.
[5] N. Fernia, G. Petrone, G. Spagnuolo, andM. Vitelli, “Optimization of perturb and observe maximum power point tracking method,” IEEE Trans. Power Electron., vol. 20, no. 4, pp. 963–973, Jul. 2005.
www.ijiset.com
[6] T. Esram, J. W. Kimball, P. T. Krein, P. L. Chapman, and P. Midya, “Dynamic maximum power point tracking of photovoltaic arrays using ripple correlation control,” IEEE Trans. Power Electron., vol. 21, no. 5, pp. 1282–1291, Sep. 2006.
[7] C. Dorofte, U. Borup, and F. Blaabjerg, “A combined two-method MPPT control scheme for grid-connected photovoltaic systems,” in Proc. Eur.Conf. Power Electron. Appl., Sep. 11–14, 2005, pp. 1–10. [8] K. H. Hussein and I. Muta, “Maximum photovoltaic
power tracking: An algorithm for rapidly changing atmospheric conditions,” Proc. Inst. Electr. Eng.— Generation, Transmission Distribution, vol. 142, no. 1, pp. 59–64, Jan. 1995.
[9] D. Sera, T. Kerekes, R. Teodorescu, and F. Blaabjerg, “Improved MPPT method for rapidly changing environmental conditions,” in Proc. IEEE Int. Ind. Electron. Symp., Jul. 2006, vol. 2, pp. 1420– 1425.
[10] N. Kasa, T. Iida, and H. Iwamoto, “Maximum power point tracking with capacitor identifier for photovoltaic power system,” Proc. Inst. Electr. Eng.—Electr. Power Appl., vol. 147, no. 6, pp. 497– 502, Nov. 2000.
[11] N. Kasa, T. Iida, and L. Chen, “Flyback inverter controlled by sensorless current MPPT for photovoltaic power system,” IEEE Trans. Ind. Electron., vol. 52, no. 4, pp. 1145–1152, Aug. 2005. [12] M. Veerachary, T. Senjyu, and K. Uezato,
“Maximum power point tracking control of IDB converter supplied PV system,” Proc. Inst. Electr. Eng.—Electr. Power Appl., vol. 148, no. 6, pp. 494– 502, Nov. 2001.
[13] R. Bruendlinger, B. Bletterie, M. Milde, and H. Oldenkamp, “Maximum power point tracking performance under partially shaded PV array conditions,” in Proc. 21st EUPVSEC, Dresden, Germany, Sept. 2006, pp. 2157–2160.
[14] W. Xiao, N. Ozog, and W. G. Dunford, “Topology study of photovoltaic interface for maximum power point tracking,” IEEE Trans. Ind. Electron., vol. 54, no. 3, pp. 1696–1704, Jun. 2007.
[15] G. Petrone, G. Spagnuolo, and M. Vitelli, “Analytical model of mismatched photovoltaic fields by means of Lambert W-function,” Sol. Energy Mater. Sol. Cells, vol. 91, no. 18, pp. 1652–1657, Nov. 2007.
[16] E. Roman, R. Alonso, P. Ibanez, S. Elorduizapatarietxe, and D. Goitia, “Intelligent PV module for grid-connected PV systems,” IEEE Trans. Ind.Electron., vol. 53, no. 4, pp. 1066–1073, Jun. 2006.
[17] M. Miyatake, T. Inada, I. Hiratsuka, H. Zhao, H. Otsuka, and M. Nakano, “Control characteristics of a Fibonacci-search-based maximum power point
tracker when a photovoltaic array is partially shaded,” in Proc. IEEE IPEMC, 2004, vol. 2, pp. 816–821.
[18] K. Kobayashi, I. Takano, and Y. Sawada, “A study of a two stage maximum power point tracking control of a photovoltaic system under partially shaded insolation conditions,” Sol. Energy Mater. Sol. Cells, vol. 90, no. 18/19, pp. 2975–2988, Nov. 2006.
[19] E. V. Solodovnik, S. Liu, and R. A. Dougal, “Power controller design for maximum power tracking in solar installations,” IEEE Trans. Power Electron., vol. 19, no. 5, pp. 1295–1304, Sep. 2004.
[20] G. Walker, “Evaluating MPPT converter topologies using a MATLAB PV model,” J. Elect. Electron. Eng., Australia, IE Aust., vol. 21, no. 1, pp. 49–56, 2001.
[21] B. Bletterie and R. Bruendlinger, “Quantifying dynamic MPPT performance under realistic conditions—First test results: The way forward,” in
Proc. 21st Eur. Photovoltaic Solar Energy Conf. Exhib., Dresden, Germany, Sep. 2006, pp. 2347– 2351.
[22] H. Patel and V. Agarwal, “PV based distributed generation with compensation feature under unbalanced and non-linear load conditions for a 3-φ, 4 wire system,” in Proc. IEEE Int. Conf. Ind. Technol., Mumbai, India, Dec. 2006, pp. 322–327.