Open Access
Proceedings
Association testing by haplotype-sharing methods applicable to
whole-genome analysis
Ilja M Nolte
†1, André R de Vries
†2, Geert T Spijker
3, Ritsert C Jansen
4,
Dumitru Brinza
5, Alexander Zelikovsky
5and Gerard J te Meerman*
2Address: 1Department of Epidemiology, University Medical Center Groningen, University of Groningen, Hanzeplein 1, 9713 GZ Groningen, the
Netherlands, 2Department of Genetics, University Medical Center Groningen, University of Groningen, Hanzeplein 1, 9713 GZ Groningen, the
Netherlands, 3Deparment of Dermatology, University Medical Center Groningen, University of Groningen, Hanzeplein 1, 9713 GZ Groningen,
the Netherlands, 4Groningen Bioinformatics Center, Groningen Biomolecular Sciences and Biotechnology Institute, University of Groningen,
Kerklaan 30, 9751 NN Haren, the Netherlands and 5Department of Computer Science, Georgia State University, 34 Peachtree Street, Atlanta,
Georgia 30303-3086, USA
Email: Ilja M Nolte - [email protected]; André R de Vries - [email protected]; Geert T Spijker - [email protected]; Ritsert C Jansen - [email protected]; Dumitru Brinza - [email protected]; Alexander Zelikovsky - [email protected]; Gerard J te
Meerman* - [email protected] * Corresponding author †Equal contributors
Abstract
We propose two new haplotype-sharing methods for identifying disease loci: the haplotype sharing statistic (HSS), which compares length of shared haplotypes between cases and controls, and the CROSS test, which tests whether a case and a control haplotype show less sharing than two random haplotypes. The significance of the HSS is determined using a variance estimate from the theory of U-statistics, whereas the significance of the CROSS test is estimated from a sequential randomization procedure. Both methods are fast and hence practical, even for whole-genome screens with high marker densities. We analyzed data sets of Problems 2 and 3 of Genetic Analysis Workshop 15 and compared HSS and CROSS to conventional association methods. Problem 2 provided a data set of 2300 single-nucleotide polymorphisms (SNPs) in a 10-Mb region of chromosome 18q, which had shown linkage evidence for rheumatoid arthritis. The CROSS test detected a significant association at approximately position 4407 kb. This was supported by single-marker association and HSS. The CROSS test outperformed them both with respect to significance level and signal-to-noise ratio. A 20-kb candidate region could be identified. Problem 3 provided a simulated 10 k SNP data set covering the whole genome. Three known candidate regions for rheumatoid arthritis were detected. Again, the CROSS test gave the most significant results. Furthermore, both the HSS and the CROSS showed better fine-mapping accuracy than straightforward haplotype association. In conclusion, haplotype sharing methods, particularly the CROSS test, show great promise for identifying disease gene loci.
from Genetic Analysis Workshop 15
St. Pete Beach, Florida, USA. 11–15 November 2006
Published: 18 December 2007
BMC Proceedings 2007, 1(Suppl 1):S129
<supplement> <title> <p>Genetic Analysis Workshop 15: Gene Expression Analysis and Approaches to Detecting Multiple Functional Loci</p> </title> <editor>Heather J Cordell, Mariza de Andrade, Marie-Claude Babron, Christopher W Bartlett, Joseph Beyene, Heike Bickeböller, Robert Culverhouse, Adrienne Cupples, E Warwick Daw, Josée Dupuis, Catherine T Falk, Saurabh Ghosh, Katrina A Goddard, Ellen L Goode, Elizabeth R Hauser, Lisa J Martin, Maria Martinez, Kari E North, Nancy L Saccone, Silke Schmidt, William Tapper, Duncan Thomas, David Tritchler, Veronica J Vieland, Ellen M Wijsman, Marsha A Wilcox, John S Witte, Qiong Yang, Andreas Ziegler, Laura Almasy and Jean W MacCluer</editor> <note>Proceedings</note> <url>http://www.biomedcentral.com/content/pdf/1753-6561-1-S1-info.pdf</url> </supplement>
This article is available from: http://www.biomedcentral.com/1753-6561/1/S1/S129 © 2007 Nolte et al; licensee BioMed Central Ltd.
Background
With the current advances in genotyping technology, genome-wide association studies for detecting genes involved in complex diseases have recently become feasi-ble. However, the computational and statistical method-ology for analyzing such studies needs optimization and standardization. Various methods and strategies have been investigated [1-3]. The typical association study of candidate regions uses single locus tests, such as the chi-square test or the transmission disequilibrium test [4]. The advantage of single-locus tests is that haplotype infer-ence can be avoided. However, it is expected that there is more information contained in haplotypes as a result of the underlying evolutionary processes [5,6]. Therefore, association analysis based on haplotypes is believed to be more powerful, in particular if the common disease-com-mon variant theory applies. According to this, the genetic variants related to a complex disease are old mutations and are common in the population (minor allele frequen-cies > 5%). Subsequent mutations and recombinations in the ancestral haplotype at which the disease mutation occurred shortened the haplotypes that descended from this ancestor. However, in the current generation the hap-lotypes will still share a fragment around the disease locus. The size of the reduced ancestral haplotype frag-ments varies as a result of the uneven nature of such recombination and mutation processes. We hypothesize that there is a difference in haplotype patterns between cases and controls at regions associated with the disease and we present two new methods based on this hypothe-sis: the haplotype-sharing statistic (HSS), which is an improvement of a statistic described by Van der Meulen et al. [7,8], and the CROSS test, which was published in an earlier form [9]. The test statistics of these two haplotype-sharing methods will be described and their performance will be compared to standard association methods.
Methods
MaterialsData from both Problems 2 and 3 of Genetic Analysis Workshop 15 (GAW15) were analyzed. From Problem 2, we used a data set of the North American Rheumatoid Arthritis Consortium (NARAC) of 2300 single-nucleotide polymorphisms (SNPs) covering 10 Mb of chromosome 18q, a region that had shown linkage evidence for rheu-matoid arthritis (RA) [10]. This data set contained 460 cases and 460 controls, the latter being recruited from a New York City population. Problem 3 provided simulated RA data on 9187 SNPs distributed over the entire genome. We used Replicates 1 through 10 of the affected sib-pair nuclear families for analysis. From each family, haplo-types transmitted to the first affected sib were used as cases and non-transmitted haplotypes as controls, regardless of the affection status of the parents. We had no prior knowl-edge of the answers.
Haplotype inference
The 920 subjects of the NARAC data set were phased using the phasing program 2SNP [11]. This program recon-structed the 1840 haplotypes for all 2300 SNPs in approx-imately 20 minutes. The construction of the simulated data sets allowed extraction of phased haplotypes and these data sets were analyzed without phase ambiguities or missing alleles.
Statistical analysis
Haplotype sharing between two haplotypes X and Y from the perspective of each locus k, denoted as h(X, Y; k), can be evaluated as the number of consecutive SNPs in the tel-omeric and centrtel-omeric directions carrying the same alle-les including locus k. Given a sample of case haplotypes X1,...,XN and a sample of control haplotypes Y1,...,YM, four measures of haplotype sharing at locus k are defined as follows:
case sharing:
;
control sharing:
;
cross sharing: ;
overall sharing:
.
The first haplotype sharing method, the HSS, compares the case haplotype sharing with control haplotype shar-ing. In contrast to the earlier HSS [7,8], in this manner the HSS corrects for linkage disequilibrium (LD) other than that caused by the disease mutation. We hypothesize that haplotype sharing will be larger among cases than among controls at loci involved in the disease and at other loci in LD with them, because i) haplotypes containing a risk allele are more likely to be similar to each other and dis-similar to haplotypes containing a non-risk allele; and ii) haplotypes containing the risk allele may be shared over longer stretches. The first factor is explained from the con-cepts of association and LD. The second factor can be explained by presumably shorter coalescence times of dis-ease alleles and hence fewer recombination events in the
SH k
N N h X X k
CASE
i j
j i N
i N ( )
( ) ( , ; )
=
− ⋅ = = +
−
∑
∑
21 1 1
1
SH k
M M h Y Y k
CTR
i j
j i M
i M ( )
( ) ( , ; )
=
− ⋅ = = +
−
∑
∑
21 1 1
1
SH k
MN h X Y k
CROSS
i j
M
i N
( )= ⋅ ( , ; )
= =
∑
∑
11 1 j
SH k N SH k M SH k NM SH k
N M
ALL( ) CASE( ) CTR( ) CROSS( )
( )
= ⋅ + ⋅ + ⋅
+
2 2
2
sample of cases compared to the sample of wild-type alle-les in controls. The HSS at locus k is defined as
where sdSHCASE(k) and sdSHCTR(k) are the estimates of the
standard deviation of the mean haplotype sharing at locus k accounting for LD among cases and controls, respec-tively. When N and M are large, SHCASE(k) and SHCTR(k)
follow a normal distribution (Central Limit Theory) and, because SHCASE(k) and SHCTR(k) are independent,
signifi-cances of tHSS(k) can be derived from a t-distribution with N + M - 2 degrees of freedom (i.e., N - 1 from the cases and M - 1 from the controls). The main statistical problem in evaluating mean haplotype sharing is how to calculate the variance of the mean sharing between all pairs of haplo-types. Generally, haplotypes will share alleles in groups and this means that haplotype agreement between haplo-type pairs is not independent. For the HSS, we derived an unbiased estimate from the theory of U-statistics for the standard deviation of the mean haplotype sharing (see Appendix).
The second haplotype-sharing method is the CROSS test. This hypothesizes that a case and a control haplotype are different from each other in the region of a disease locus and will therefore show less haplotype sharing (cross sharing; SHCROSS) than two random haplotypes (SHALL).
This test incorporates more information on allele fre-quency differences between cases and controls (i.e., the single SNP association "signal") than the HSS. Unlike the HSS, an equivalent U-statistics variance of the cross shar-ing can not be estimated because of the correlation between SHCROSS and SHALL. Therefore, the variance of the
cross sharing is estimated from a sequential randomiza-tion procedure in which case and control status is ran-domly permuted over the haplotypes as long as the interim significance estimate remains interesting (i.e., p -value < 0.1). In order to render this test fast and hence fea-sible for whole-genome screens with a high density of SNPs, the significance is not determined from the rand-omization procedure, but the variance of SHCROSS(k)
-SHALL(k) is estimated from a maximum of 200
randomi-zations, which is a sufficient number to provide a reason-ably accurate variance estimate. The CROSS test at locus k is then defined as
Note that a negative value implicates positive association. As a result of the correlation between SHCROSS and SHALL,
the tails of the zCROSS(k) distribution are not properly
approximated by a normal distribution, leading to down-ward biased p-values for extreme z-values. Therefore, the z -values are transformed to a chi-square distribution with ν degrees of freedom:
With an appropriately chosen ν, the distribution resem-bles the true z-score distribution, especially in the tails, so that realistic p-values are obtained. The best choice for ν typically depends on the sample size and on the individ-ual chromosome. For the current study, we empirically derived the value for νthat minimized the bias in p-values in non-associated regions.
In order to compare the performances of the HSS and CROSS, we also performed single-SNP and haplotype-association analysis. Single-SNP haplotype-association was tested by means of a chi-square test. For haplotype association, fre-quencies of haplotypes of five consecutive SNPs were counted and a log-likelihood ratio test was performed including only haplotypes with n > 10 to assess the signif-icance of the difference between cases and controls (our own software, available on request).
We used a conservative Bonferroni correction to correct for multiple testing. Hence, in the real data, a result was considered significant if the -log(p-value) was larger than -log(0.05/2300) = 4.65, and in the simulation study if the -log(p-value) was larger than -log(0.05/9187) = 5.25 and suggestive if it was larger than -log(0.10/9187) = 4.95.
Results
NARAC data set (Problem 2)
The running time of all analyses for 2300 SNPs and 920 individuals was 80 minutes on a single laptop PC (Celeron 1500 MHz), which is sufficiently fast to be acceptable for whole-genome association studies.
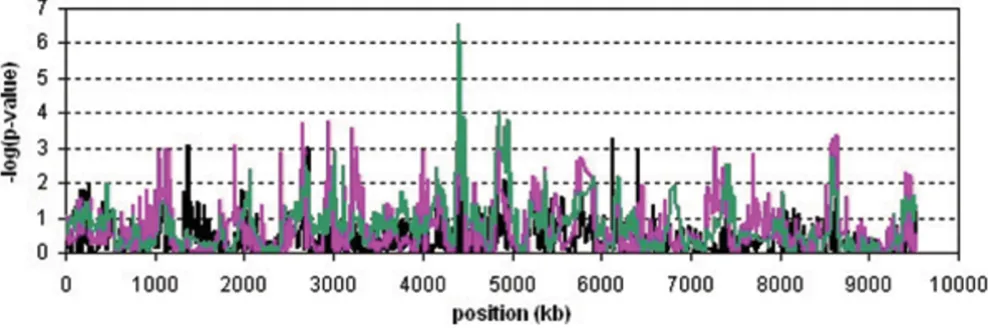
The results are presented in Figures 1 and 2. The CROSS test revealed a significant association with a -log(p-value) of 6.6 at position 4407 kb from the first SNP. The odds ratio based on allele frequencies at this location is 1.41 (1.16–1.72, 95% CI). A second, non-significant peak (-log(p-value) = 4.1) was found near 4863 kb from the first SNP, with a corresponding odds ratio of 1.21 (0.99–1.51, 95% CI). Although the HSS peaks at the same two loca-tions (-log(p) = 4.2 and 3.2, respectively), these results were not significant. The same holds for the single-marker chi-square test.
Figure 2 focuses on the associated region around 4407 kb. The CROSS test did not show a clear peak at a particular locus. Instead, several SNPs in the region were associated,
t k SH k SH k
sdSH k sdSH k
HSS
CASE CTR
CASE CTR
( ) ( ) ( )
( ( )) ( ( ))
,
= −
+
2 2
z k SH k SH k
sd SH k SH k
CROSS
CROSS ALL
CROSS ALL
( ) ( ) ( )
( ( ) ( )).
= −
−
P(χ ν| ) ~ ( ) χ ν ( ) ~ ( ) .
ν χ ν ν
2 2 2
2 2
which was to be expected because the CROSS test is based on haplotype sharing and tests at subsequent loci were highly correlated. However, the HSS and the single-marker chi-square test were not informative about the exact disease locus either. Nevertheless, the CROSS identi-fied a small region of 20 kb (4,400–4,420 kb) as the can-didate region.
Simulated data set (Problem 3)
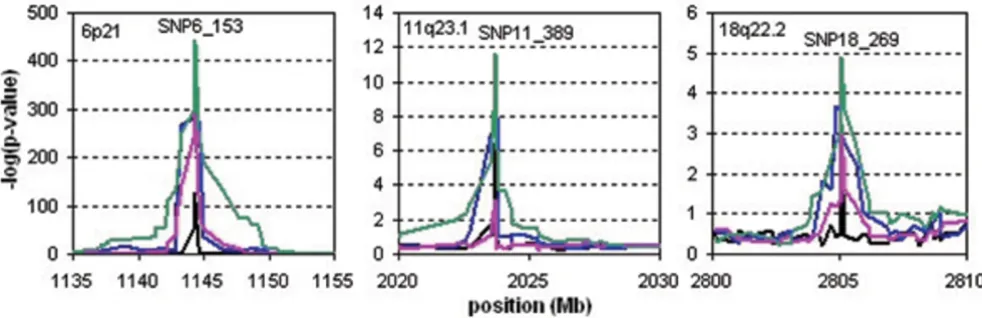
Figure 3 shows the results of the genome-wide SNP asso-ciation analyses. Genome-wide significant assoasso-ciations
were observed for all statistical methods at chromosomal regions 6p21 and 11q23.1, and we found a suggestive result at 18q22.2 for the CROSS test only. These regions are known candidate regions for rheumatoid arthritis. The CROSS test showed the most significant results: for 6p21 the mean of the -log(p)-values for the ten replicates was 443.6 (range 370.3–552.0); for 11q23.1 it was 22.8 (range 6.4–33.9); and for 18q22.2 it was 4.95 (range 1.8– 10.6). None of the methods detected other associated regions.
Analysis results of the NARAC data set
Figure 1
Analysis results of the NARAC data set. Results of the CROSS test (green line), the HSS (pink line) and single-marker association (black line) are plotted for all 2300 SNPs on chromosome 18q.
Region showing the strongest association in the NARAC data set
Figure 2
Region showing the strongest association in the NARAC data set. The CROSS (green line), the HSS (pink line) and
Type I errors and power are shown in Table 1. Both hap-lotype-sharing methods had the correct type I errors. On chromosome 11 both the HSS and the CROSS tests had more power than the standard association analyses, while on chromosome 18 only the CROSS test had more power. The significance of the effect on chromosome 6 was so strong that all methods had 100% power in this region.
Discussion
The results of our analyses on both the NARAC data and simulated genome-wide data show that the CROSS test is a powerful statistic for identifying disease loci. The CROSS combines information on differences in haplotype shar-ing, which are also used by the HSS, and on allele fre-quency differences, which are the basis of association analysis.
In the NARAC data, the CROSS test revealed a significant association (-log(p-value) = 6.6) approximately 4407 kb
from the starting SNP. Odds ratios of 1.41 were observed at multiple SNPs in this region. A second suggestive peak was observed near 4863 kb (-log(p-value) = 4.1). This result was not significant after applying the conservative Bonferroni multiple testing correction, but because the significances outside of the associated region seemed to range up to a -log(p) of ~3, this result might indicate a rel-evant association as well. The HSS and the single-SNP association test peaked at the same locations as the CROSS, but these tests did not reach significance. Further-more, the HSS and single-SNP association analyses were not specific enough because multiple signals at other posi-tions reached the same significance level as the 4407 kb peak. The CROSS test did not identify a particular SNP as the causal one, which is inherent to the way the test was developed, but a candidate region as small as 20 kb could clearly be identified.
Table 1: Type I error and power
Type I errora Powerb
Method 0.05 0.005 0.0005 Chr 6 Chr 11 Chr 18
Single-SNP association 0.051 0.0048 0.00057 1.0 0.7 0.1
Haplotype association 0.053 0.0052 0.00051 1.0 0.8 0.1
HSS 0.052 0.0046 0.00031 1.0 1.0 0.1
CROSS 0.051 0.0051 0.00061 1.0 1.0 0.4
aType I results at three different significance levels were determined from the Replicates 1 to 10 of SNPs on all chromosomes except 6, 11, and 18. bPower is determined as the fraction of replicates showing a significant result (p < 0.05/9187) in a 1-Mb region around SNP6_153 on chromosome
6, SNP11_389 on chromosome 11, and SNP18_269 on chromosome 18.
Analysis results of the simulated data set in the regions 6p21 (a), 11q23.1 (b), and 18q22.2 (c)
Figure 3
Analysis results of the simulated data set in the regions 6p21 (a), 11q23.1 (b), and 18q22.2 (c). On the x-axis, the
cumulative position with respect to the start of chromosome 1 is given. The black, blue, pink, and green lines represent the
mean of the -log(p-values) of the ten replicates of single-SNP association, five-SNP haplotype association, HSS, and CROSS,
When applied to the simulated 10 k SNP array data, the HSS and CROSS tests showed significant results in the known candidate regions for rheumatoid arthritis, i.e., 6p21 and 11q23.1, and the CROSS was suggestive of asso-ciation at 18q22.2 after Bonferroni correction. The type I errors of these haplotype-sharing methods were as expected and no significant associations in other regions were observed. Similar results were found by single-SNP and five-SNP haplotype association analysis, but the CROSS test showed more power in each associated region.
The strength of single-SNP association analysis was infe-rior to that of our two haplotype sharing methods, sug-gesting that the latter indeed contain more information. The HSS and CROSS showed more significant results and sharper peaks than the five-SNP haplotype analysis. This might imply that HSS and CROSS have a better mapping accuracy than a fixed-length or sliding-window haplotype method. This could result from the fact that HSS and CROSS use the variable length over which haplotypes are the same, whereas a sliding window method may use either too much or too little information. The finding that both the HSS and the CROSS test accurately identify the disease locus might seem to conflict with the results of the NARAC data, in which the exact locus could not be pin-pointed. However, the SNP density of the NARAC data is about 80-fold higher than in the simulated data set and multiple highly correlated SNPs were expected to be asso-ciated causing broader peaks.
We did not investigate the robustness of the haplotype sharing methods to haplotype reconstruction errors or missing alleles. Although this analysis would be interest-ing and remains necessary, the focus of this paper was to introduce and describe the HSS and the CROSS test. The effects of phase ambiguities and missing alleles on the HSS and CROSS will be the topic of future work.
Conclusion
The HSS and in particular the CROSS test show great promise for identifying and fine-mapping disease genes of complex diseases. They are useful for whole genome asso-ciation screens because the analytical form of the HSS and the sequential randomization for estimating variance of the CROSS test renders them fast enough and hence prac-tical to use even for marker densities of 500,000 SNPs/ genome.
Appendix
The mean haplotype sharing is a U-statistic:
. Denote the mean
and variance of the sharing of two haplotypes at locus k,
h(Xi, Xj; k), by μk and σk2, respectively. We state that, given a data set {X1,...,XN},
where
is an unbiased estimate of the variance of a U-statistic. We will derive that Sh(k)2 is an unbiased estimate of var(h(X
i,
Xj; k)) = σk2, because from this finding, it simply follows that S(k)2 is an unbiased estimator of var(U), as
It is simple to derive that
is an unbiased estimator of σk2 (proof left to the reader). This estimator is of the order 4, as in the second term each haplotype pair is considered twice. To speed up the calcu-lation, this estimator can be rewritten to an estimator of the order 2 as follows:
Competing interests
Publish with BioMed Central and every scientist can read your work free of charge
"BioMed Central will be the most significant development for disseminating the results of biomedical researc h in our lifetime."
Sir Paul Nurse, Cancer Research UK
Your research papers will be:
available free of charge to the entire biomedical community peer reviewed and published immediately upon acceptance cited in PubMed and archived on PubMed Central yours — you keep the copyright
Submit your manuscript here:
http://www.biomedcentral.com/info/publishing_adv.asp
BioMedcentral
Acknowledgements
This article has been published as part of BMC Proceedings Volume 1 Sup-plement 1, 2007: Genetic Analysis Workshop 15: Gene Expression Analysis and Approaches to Detecting Multiple Functional Loci. The full contents of the supplement are available online at http://www.biomedcentral.com/ 1753-6561/1?issue=S1.
References
1. Hirschhorn J, Daly M: Genome-wide association studies for common diseases and complex traits. Nat Rev Genet 2005,
6:95-108.
2. Gordon D, Finch S: Factors affecting statistical power in the detection of genetic association. J Clin Invest 2005,
115:1408-1418.
3. Marchini J, Donelly P, Cardon L: Genome-wide strategies for detecting multiple loci that influence complex disease. Nat Genet 2005, 37:413-417.
4. Spielman R, Ewens W: The TDT and other family-based tests for linkage disequilibrium and association. Am J Hum Genet
1996, 59:983-989.
5. te Meerman G, Van der Meulen M, Sandkuijl L: Perspectives of identity by descent (IBD) mapping in founder populations.
Clin Exp Allergy 1995, 25:97-102.
6. te Meerman G, Van der Meulen M: Genomic sharing surrounding alleles identical by descent: effects of genetic drift and popu-lation growth. Genet Epidemiol 1997, 14:1125-1130.
7. Van der Meulen M, te Meerman G: Association and haplotype sharing due to identity by descent, with an application to genetic mapping. In Genetic Mapping of Disease Genes Edited by:
Pawlowitzki I, Edwards J, Thompson E. London: Academic Press; 1997:115-135.
8. Van der Meulen M, te Meerman G: Haplotype sharing analysis in affected individuals from nuclear families with at least one affected offspring. Genet Epidemiol 1997, 14:915-920.
9. Levinson D, Kirby A, Slepner S, Nolte I, Spijker G, te Meerman G:
Simulation studies of detection of a complex disease in a par-tially isolated population. Am J Med Genet 2001, 105:65-70. 10. Jawaheer D, Seldin MF, Amos CI, Chen WV, Shigeta R, Etzel C, Damle
A, Xiao X, Chen D, Lum RF, Monteiro J, Kern M, Criswell LA, Albani S, Nelson JL, Clegg DO, Pope R, Schroeder HW, Bridges SL, Pisetsky DS, Ward R, Kastner DL, Wilder RL, Pincus T, Callahan LF, Flemming D, Wener MH, Gregersen PK, North American Rheumatoid Arthritis Consortium: Screening the genome for rheumatoid arthritis susceptibility genes: a replication study and combined analy-sis of 512 multicase families. Arthritis Rheum 2003, 48:906-916. 11. Brinza D, Zelikovsky A: 2SNP: Scalable phasing based on 2-SNP