Available Online atwww.ijcsmc.com
International Journal of Computer Science and Mobile Computing
A Monthly Journal of Computer Science and Information Technology
ISSN 2320–088X
IMPACT FACTOR: 5.258IJCSMC, Vol. 5, Issue. 4, April 2016, pg.403 – 409
Estimation of Size in Software
Development: A Case Study
Anureet Kaur
Department of Computer Science & Applications, Khalsa College, India [email protected]
Abstract — There are several estimation techniques that are used for estimating the time and effort required in development of software. For any of these estimation techniques to be operative, the organization doing the estimates that must meet definite conditions. Software’s estimate of effort entails input specifying the software size and there are many factors on which reliable size estimate depends. Later its software size, on which cost and effort is determined. The software size describes the amount of problem complexity in relations of effort and time required to develop the software. From the available techniques, the two metrics which are mostly used to estimate size is lines of code (LOC) and function point (FP). Each of these has its own pluses and minuses. The aim of this paper is how to make software projects more successful by properly estimating the size. In this paper Function point metric is used to estimate the size of a project and then after development, the estimated is compared with size.
Keywords— estimation, effort, metrics, size, software engineering, Function point, LOC
I. INTRODUCTION
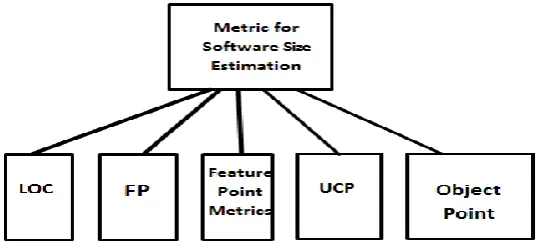
The description of each metric is shown in the table 1.But this paper is only focused on using function point metric.
TABLE 1: METRIC FOR SOFTWARE SIZE ESTIMATION AND DESCRIPTION
Sr.No. Metric for s/w size Estimation
Brief Description
1. Line of Code(LOC) The size of the project is estimated by counting the number of source
instructions in the developed program
2. Function Point In this instead of counting the lines, the functionality of the software
is counted.
3. Feature Point Metric Feature Point metric extends the function points to include complexity
of the functions also.
4. Use Case Point(UCP) Use-case Points are counted from the use-case analysis of system.
UCP are counted during early phases of an object-oriented project that captures its scope with use cases.
5. Object Point In this the measurement is based on the number and complexity of
objects such as screens, reports and 3GL components
II. FUNCTION POINT METRIC
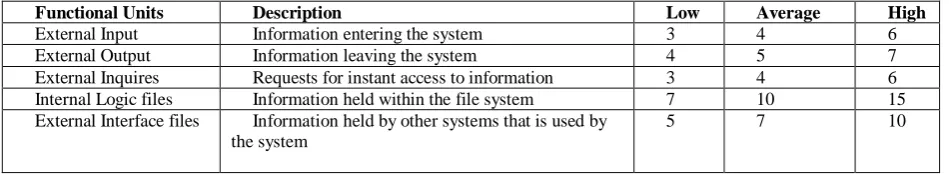
The function point metric is can be used to easily estimate the size of a software product directly from the problem specification. This is in contrast to the LOC metric, where the size can be accurately determined only after the product has fully been developed. The conceptual idea behind the function point metric is that the size of a software product is directly dependent on the number of different functions or features it supports. To calculate function points, five functional units are raked according to their complexity i.e., Low, Average, or high. After classifying each of the five function types, the Unadjusted Function Points (UFP) are calculated using predefined weights for each function type given in table 2[4]
TABLE 2: CALCULATING UNADJUSTED FUNCTION POINTS (UFP)
Functional Units Description Low Average High
External Input Information entering the system 3 4 6
External Output Information leaving the system 4 5 7
External Inquires Requests for instant access to information 3 4 6
Internal Logic files Information held within the file system 7 10 15
External Interface files Information held by other systems that is used by
the system
5 7 10
The procedure for calculating Unadjusted Function Point in Mathematical form is:
The function point is calculated by multiplying the UFP by an adjustment factor that is calculated by considering 14 aspects of processing complexity.
The fi (i=1 to 14) are the degrees of influence and are based on responses to question noted below: [5]
Figure 2: Factors for calculating fi [5]
III.PROBLEM STATEMENT
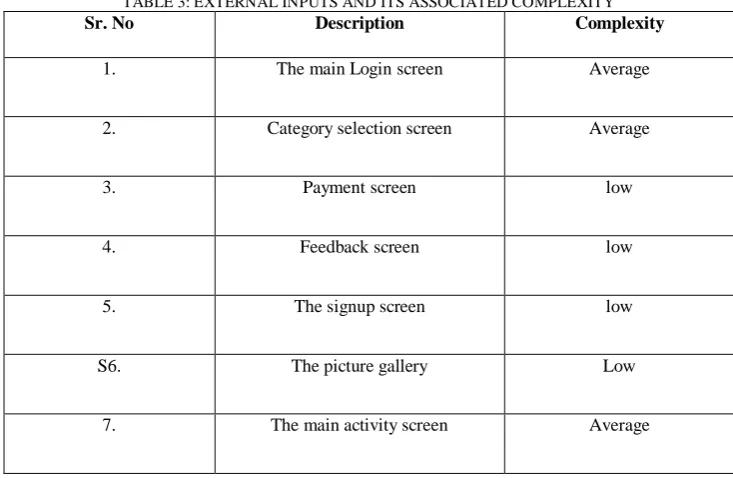
For calculating the size of the project function point metric is used as shown in the following tables 3--6. Step 1: Calculations for External Inputs as already discussed in Function point calculation.
TABLE 3: EXTERNAL INPUTS AND ITS ASSOCIATED COMPLEXITY
Sr. No Description Complexity
1. The main Login screen Average
2. Category selection screen Average
3. Payment screen low
4. Feedback screen low
5. The signup screen low
S6. The picture gallery Low
7. The main activity screen Average
Step 2: Calculations for External Interface files
TABLE 4: EXTERNAL INTERFACE FILES AND ITS ASSOCIATED COMPLEXITY
Sr. No Description Complexity
1. Contact Us screen call and
Message
low
2. Contact Us screen email low
Step 3: Calculation of Unadjusted Function Points (UFP)
TABLE 5: UNADJUSTED FUNCTION POINTS (UFP) CALCULATION
User Function Type
Complexity Weight *Counts
Low Average High Total
External I/P 3*4=12 4*3=12 6*0=0 24
External O/P 4*0=0 5*0=0 7*0=0 0
Internal Logical File
7*0=0 10*0=0 15*0=0 0
External Interface File
5*2=10 7*0=0 10*0=0 10
External Inquiry 3*0=0 4*0=0 6*0=0 0
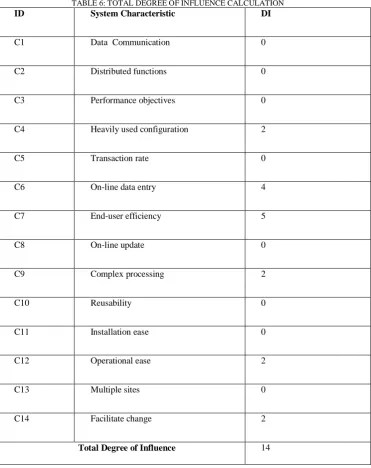
Step 4: Calculation of Total Degree of Influence (TDI)
TABLE 6: TOTAL DEGREE OF INFLUENCE CALCULATION
ID System Characteristic DI
C1 Data Communication 0
C2 Distributed functions 0
C3 Performance objectives 0
C4 Heavily used configuration 2
C5 Transaction rate 0
C6 On-line data entry 4
C7 End-user efficiency 5
C8 On-line update 0
C9 Complex processing 2
C10 Reusability 0
C11 Installation ease 0
C12 Operational ease 2
C13 Multiple sites 0
C14 Facilitate change 2
Total Degree of Influence 14
Step 5: Calculation of Technical Complexity Adjustment (TCA) TCA=0.65+0.01*TDI
Substituting the values, we get TCA=0.65+0.01*14
Size_in_LOC=26.86*53 =1423
To validate the results, SourceMonitor Version 3.5 is used. The freeware program SourceMonitor lets you see inside your software source code to find out how much code you have and to identify the relative complexity of your modules. [6]
Figure 4: SourceMonitor output
So Actual LOC is 1453 and estimated using FPA was 1423
As it can be seen here, there is a difference of approximately 2% difference. For Calculating effort,the below formaula can be used.
Effort in Person Month = FP /no. of FP's per month (Using organizations or industry benchmark)
IV.CONCLUSIONS
source tool is used to compare the estimated size with the actual size after development of the software. It is concluded that there is only 2% variation, which is not considered depraved in software estimation.
REFERENCES
[1] D. D. Galorath, M. W. Evans, Software Sizing, Estimation, and Risk management, Auerbach Publications, 2006.
[2] Khaled Hamdan, Hazem El Khatib, Khaled Shuaib,” Practical Software Project Total Cost Estimation Methods”, MCIT 10, IEEE, 2010.
[3] Jairus Hihn, Hamid Habib-agahi,”Cost Estimation of Software Intensive Projects:A Survey of Current Practices”, IEEE, 2011.
[4] Yunsik Ahn, Jungseok Suh, Seungryeol Kim, Hyunsoo Kim,”The software maintenance project effort estimation model based on function points”, Journal of software maintenance and evoloution, 2003. [5] Borade et al., International Journal of Advanced Research in Computer Science and Software Engineering
3(8),August - 2013, pp. 730-739
![Figure 2: Factors for calculating fi [5]](https://thumb-us.123doks.com/thumbv2/123dok_us/1928048.1253197/3.595.99.509.491.746/figure-factors-for-calculating.webp)