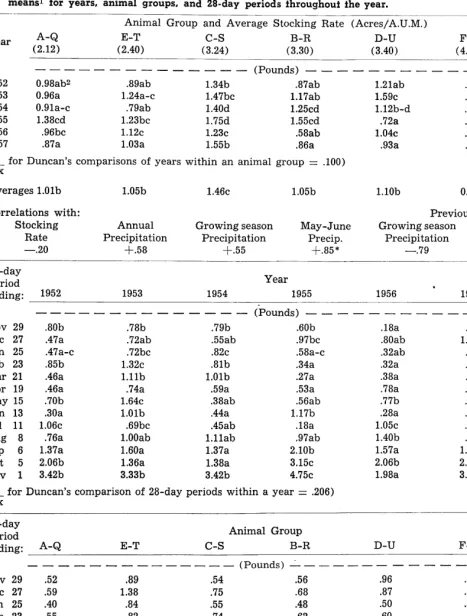
IN THIS
ISSUE
The Response of Yearling Cattle on Crested Wheafgrass Pasture fo Energy, Protein and Sodium Supplementation
Joe D. Wallace, Far-r-is Hubbert, Jr. and R. J. Raleigh
Native Grass and Cresfed Wheafgrass Production as Influenced by Fertilizer Placement and Weed Control
D. E. Smika, H. J. Haas and G. A. Rogler
A Modification of the Line Intercept Method for Sampling Undersfory Vegeiafion.._.Thomas H. Ripley, Frank M. Johnson and William H. Moore
Salt Consumption by Breeding Cows on Native Range in the Northern Great Plains...~.._~____.__.._~_..~__~.~ _____ ______ ______ Walter R. Houston
Cobalt Supplementation on Nebraska
A Conservation Program for Grazing
Ranges
D. C. Clanton and W. W. Rowden
Woodlands in fhe Southeast
Thomas N. Shiflet
A Comparison of Line Intercepts and Random Point Frames for Sampling Desert Shrub Vegefafion...Jorge M. Brun and Thadis W. Box
Some Imporfani and Associated Native Grasses on Central and South Florida Ranges... _________ _ __.._ ___________________________ _____ _.____ ______ _ __.________ _ ___.___ L. L. Yarlett
Technical Notes:
Lightweight Collapsible Plot Frame... __._____ ______________ ___..__ -Robert M. Blair
Book Reviews: Pasture and Range Research Techniques (S. Clark Martin);
Animal Nutrition, Fifth Edition (B. P. Cardon); 6,000 Miles of Fence
(Richard B. Peck); Crusade For Wildlife (Hudson G. Reynolds); Deer Browse Planis of Southern Foresis (C. R. Hunger-ford) __________ _ ._____...____ _ ______ _ Current Literature _________ _____ __._________________ ________ ___________________ ..___ ______._.______ _..______.. ____.___ _____ ___ Society Business__ ____ _ ____ __ .___._..__ _______ __.__ _______~.________ ______ _ ____ ____ ___________ _ _._______ _ _________.__ ___ ________.. News and Nofes... _____._ ~__________..______ ..___ ____ ____. _ _...___ _ __.._ _...__ __...___ _ ____ _ ___________ ____
National Affairs: _____... ___ _... _______ ______.__ _ ____________ _ ____ _ _____ ____________ ___________ _ ._____________._____._..._._..._. With The Secfions... __..._ _..__ __._ ______ _______._.____.__ ________ ____ _______________ _____ _ ..__ _____ ___..._ ___ __._. __
1
5
9
12
16
18
21
25
28
29 32 35 44 47 49
Cover Photo- The Science and Art of
Range Management
Journal of
RANGE
MANAGEM
Volume 16, Number 1 January, 1963
ENT
Th e
Yearling Cattle on
Crested Wheatgrass Past&e to
Energy, Protein and Sodium Supplementation’
JOE D. WALLACE, FARRIS HUBBERT, JR.2 AND
R. J. RALEIGH
Assistant Professor of Animal Science, Oregon State University; Associate Professor of Animal Science, Uni- versity of Arizona and Assistant Professor of Animal Nutrition, Oregon State University
The sale of yearling feeder cat-
tle represents
a considerable
share of ranch income in the
western range area. In an effort
to maximize p r o f i t s derived
from the sale of such animals,
progressive stockmen are con-
tinually striving for more effi-
cient utilization of basic winter
and summer feed resources. In-
creasing efficiency of feed utili-
zation through supplementation
under western range conditions
is usually centered around feed-
ing a minimum amount of select-
ed concentrates to supply essen-
tial nutrients that are deficient
in the hay or range forage.
Winter supplementation h a s
become a common practice in
many ranch operations. Numer-
ous workers have shown bene-
ficial effects of. feeding various
supplements with winter rough-
1A contribution from Squaw Butte Experiment Station, Burns, Oregon. This station is jointly operated by the Oregon Agricultural Experi- ment Station and Crops Research Division, Agricultural Research Service, U. S. Department of Agri- culture. Technical Paper No. 1537, 0 r e g on Agricultural Experiment Station.
2 Formerly Associate Professor of Animal Nutrition, Oregon State University.
ages (Brouse, 1955; Bohman and
Torell, 1956; Embry, et al. 1958).
Other workers have described
conditions under which supple-
mentation may be profitable on
winter ranges (Rowden, et al.
1961; Anderson, et al. 1957; Boh-
man, et
al.1955; Guilbert and
Hart, 1946). Under winter hay
feeding conditions or where cat-
tle are wintered on the range the
problem of devising an effective
supplement c a n be relatively
simple. This is true because the
basic roughage (hay or mature
range forage) is generally stable
with respect to availability and
nutrient content.
Feeding of young cattle on
summer range
may be con-
sidered where additional gain
is sufficient to offset the costs of
supplements and extra labor in-
volved. The first and primary
step in establishing a range sup-
plementation program is to prop-
erly evaluate nutrients m a de
available by range forage at var-
ious stages of maturity in terms
of animal requirements. Grow-
ing plants are continually chang-
ing in chemical composition and
this generally causes a decrease
in nutrient quality as the graz-
ing season advances.
1
The primary objective of the
work reported in this paper was
to determine the rate of gain
made by yearling cattle grazing
crested wheatgrass pasture sup-
plemented with energy (barley),
protein (cottonseed meal), and
sodium (salt) alone or in various
combinations. The basic reason
for including sodium in this ex-
periment was to study the effect
of an adjustment in the sodium-
potassium ratio in the diet which
may be attained by increased
salt intake. A secondary objec-
tive was to relate chemical com-
position and in vitro cellulose
digestibility of crested wheat-
grass herbage collected at vari-
ous intervals to animal perform-
ance.
Experimental Procedure *
Experimental studies summar-
ized in this paper were conduct-
ed at the Squaw Butte Experi-
ment Station during the grazing
seasons of 1958 and 1959. Crop-
year precipitation during 1958
and 1959 was 143 and 54 percent
of the m e d i a n precipitation
about 11.3 inches for the area,
respectively (Sneva and Hyder,
1962). Experimental periods ex-
tended from May 15 to Septem-
ber 3 in 1958 and from May 12
to August 4 in 1959. The study
was terminated on August 4 in
1959 because of a shortage of
range forage resulting from the
relatively 1 i m i t e d amount of
moisture that year.
2 WALLACE, HUBBERT AND RALEIGH
ling steers were used and in 1959 half of the animals were steers and half were heifers. The ani- mals grazed together on crested wheatgrass pasture during the entire study e a c h year. They were gathered each morning and sorted into their respective pens where the proper supplements were made available to them.
The animals remained in the
pens for a 2-hour period each day before being turned back on t h e pasture. A representative group of yearlings used in the 1958 study is shown in Figure 1.
ing rates; May 15-May 28, 0.25
pound; May 28-June 11, 0.50
p o u n d ; June 11-July 9, 0.75 pound; July g-July 23,1.0 pound; July 23-August 6, 2.5 pound; and
August 19-September 3, 3.0
pounds per head daily. During the grazing season of 1959 pro- tein supplementation was started at 0.25 pound per head daily on May 12 and was increased to 0.50, 1.0 and 2.0 pound on June 3, June 23 and July 22, respective- 1Y.
Sodium was provided as finely ground salt at the rate of 0.50
FIGURE 1. Yearlings in supplement pens during the 1958 trial. Alleyway was used to sort animals into their respective pens.
Experimental treatments were energy, protein and sodium sup- plements in a 2x2x2 factorial de- sign. Energy was supplied as barley and was fed at the rate
of 2 pounds per head daily
throughout the entire trial each year. Cottonseed meal, used as the protein source, was gradual- ly increased w i t h advancing plant maturity each year in an effort to maintain at least 10 per- cent crude protein in the ani- mal’s diet. An estimation of for- age intake and protein analyses of forage samples were used in establishing the level of cotton- seed meal fed. During 1958 pro- tein was available at the follow-
pound per head daily at the be- ginning of the 1958 trial and was later decreased to 0.25 pound on June 11 and finally to 0.10 pound on September 3. During the 1959 grazing season salt was provided at a constant rate of 0.25 pound per head per day throughout this study.
Chemical analyses were con- ducted on samples of crested wheatgrass herbage collected at various i n t e r v a 1 s during the study period each year. In vitro cellulose digestibility was deter- mined on the forage samples ac- cording to the procedure de- scribed by Hub b er t, et al.
(1958a).
The animals were individually weighed at different intervals during the study periods. All weights were t a k e n following overnight restriction from feed and water according to the pro- cedure of Harris, et cd. (1959).
Results And Discussion Forage analyses and in vitro
digestion data
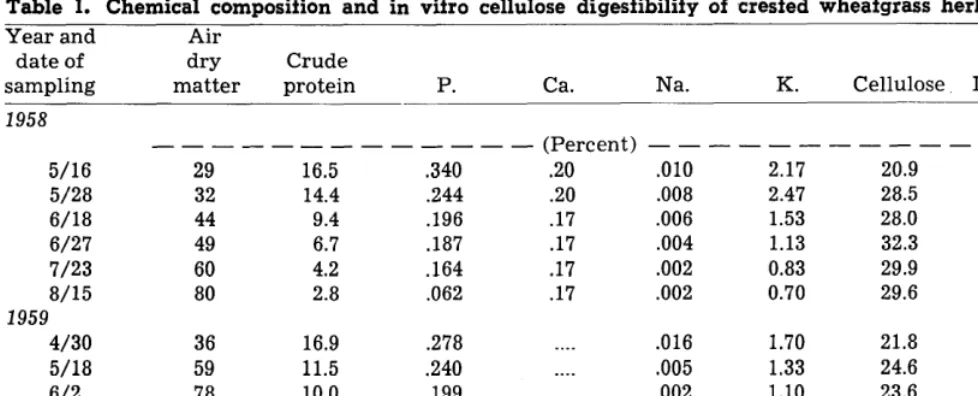
Forage chemical analyses and in vitro cellulose digestion data are shown in Table 1. The dif- ference between years in chemi- cal composition data can possi- bly be attributed to the fact that 1958 was a year of relatively high precipitation w h i 1 e 1959 was rather dry. The dry matter content of the forage remained at a lower level in 1958 than 1959. Cellulose and lignin were higher during the 1958 season than on comparable dates and stages of growth in the 1959 grazing season. The crude pro- tein decreased more rapidly in 1958 after mid-June than in 1959 during the s a m e period. The sodium-potassium r a t i o w a s wider during the early part of the season than in late season for both years. Potassium values were higher during the early part of the 1958 season than for comparable dates in 1959.
In vitro cellulose digestibility values during the early part of the grazing season showed no real difference between years; however, the digestibility values declined more rapidly from mid- June to the end of the grazing season in 1958 than in 1959. The higher lignin content of the 1958 samples w a s probably associ- ated, at least to some degree, with the somewhat reduced di- gestibility values found on these samples.
RESPONSE OF YEARLING CATTLE 3
Table 1. Chemical composition and in vitro cellulose digestibility of crested wheafgrass herbage.
Year and Air In vitro
date of dry Crude cellulose
sampling matter protein P. Ca. Na. K. Cellulose Lignin Digestibility
1958
-
5/16 5/28 6/18 6/27 7/23 8/15 1959
4/30 5/18 6/2 6/16 7/l 7/15
(Percent) - -
.20 .OlO
.20 .008
.17 .006
.17 .004
.17 .002
.17 .002
- - __---_-i--
2.17 20.9 3.81 58.4
2.47 28.5 4.70 57.2
1.53 28.0 7.37 43.5
1.13 32.3 8.51 38.2
0.83 29.9 7.96 25.9
0.70 29.6 8.24 23.0
--
29
32 44 49 60 80
--mm--
16.5 .340
14.4 .244
9.4 .196
6.7 .187
4.2 .164
2.8 .062
36 16.9 .278 _.__ .016
59 11.5 .240 ___. .005
78 10.0 .199 _.__ .002
93 10.4 .194 _.__ .006
92 8.2 .154 ___. .004
92 6.2 .191 _-__ .003
1.70 21.8 4.78 65.8
1.33 24.6 4.34 53.4
1.10 23.6 4.69 52.8
1.53 25.5 6.53 51.1
1.13 25.9 6.60 41.3
0.97 28.2 6.90 36.7
a highly significant increase in dry matter consumption.
the 1959 t r i a 1 (Table 3). A Protein supplementation re- greater response to energy sup- sulted in a greater response in plementation was apparent dur- 1958 (especially during the latter ing July of 1959 than was true part of the grazing season) as for 1958. This was probably due compared to 1959 (Table 3). This to reduced forage intake brought may be attributed to lower for- about by drought conditions in age protein in 1958 and also to 1959. The gain response obtained the length of the 1958 trial. The f r 0 m energy supplementation apparent depression of gain by during the 1959 trial would seem protein supplementation during to indicate that energy intake May and June of 1958 as shown from the forage was a limiting by main effect comparisons was factor throughout t h e season. partially caused by the reduced The early response from energy gains made by animals receiving
supplementation might be at- the salt-protein combination
tributed to the relatively low during this period (Table 2). As dry matter content (Table 1) shown in Table 3, a significant of the forage during the early protein x salt interaction was season which would tend to limit noted during the first, fourth
Gain by Treatment, Weigh Period and Year. Animal Performance Data
Animal gains decreased with advancing periods during t h e grazing season each year (Table 2). Similar trends were noted by Frischknecht, et al. (1953) in
grazing trials conducted on
crested wheatgrass. In general, gains were higher during 1958 than 1959. This was probably due to the abundance of forage during 1958 rather than to qual- ity since f 0 r a g e quality re- mained at a higher level during the 1959 grazing season (Table 1).
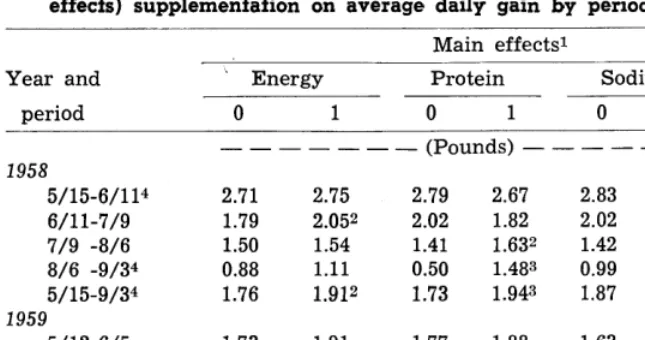
Energy supplementation r e -
sulted in a significant increase in rate of gain during 1958 and
Table 2. Summary of Average Daily
Treatment Year and
weigh
period control salt’ CSM barley
Salt + CSM
Salt +
Salt + CSM + CSM Average barley barley + barley (by periods) ---
1958
5/15-6/11 2.68 6/l l-7/9 2.12 7/9 -8/6 1.41 8/6 -9/3 0.18
Average 1.64
1959
5/12-6/5 1.52 6/5 -7/15 1.52 7/15-g/4 1.38
Average 1.49
Average (both yrs.) 1.56
- - ---_ ---- -_-- (Pounds) - - - - ---- ---
2.92 2.89 2.86 2.36 2.71 2.89 2.53 2.73
1.78 1.70 2.18 1.55 1.98 2.07 1.96 1.92
1.41 1.58 1.26 1.59 1.55 1.55 1.81 1.52
0.62 1.49 0.54 1.21 0.68 1.75 1.46 0.99
1.73 1.96 1.76 1.72 1.78 2.20 1.99 1.85
1.88 1.52 1.53 2.01 2.15 1.95 2.02
1.60 2.02 1.96 1.79 1.67 2.14 1.90
1.17 1.42 1.38 1.16 1.79 1.17 2.00
1.58 1.74 1.70 1.71 1.83 1.86 1.96
1.66 1.85 1.73 1.72 1.80 2.03 1.98
1.82 1.82 1.43 1.73
4
WALLACE, HUBBERT AND RALEIGH
Table 3. Summary of influence of energy, protein and sodium (main effects) supplementation on average daily gain by periods and years.
Main effects1
Year and ’ Energy Protein Sodium
period 0 1 0 1 0 1 C.V.
---_ (Pounds) - - - Percent
1958
5/15-6/l 14 2.71 2.75 2.79 2.67 2.83 2.63 14.0
6/l l-7/9 1.79 2.052 2.02 1.82 2.02 1.82 23.0
7/9 -8/6 1.50 1.54 1.41 1.632 1.42 1.59 24.8
8/6 -g/34 0.88 1.11 0.50 1.483 0.99 0.99 25.9
5/15-g/34 1.76 1.912 1.73 1.943 1.87 1.80 12.1
1959
5/12-6/5 1.73 1.91 1.77 1.88 1.63 2.022 33.6
6/5 -7/15 1.73 1.92 1.69 1.96 1.91 1.74 27.0
7/15-8/4 1.30 1.58 1.44 1.45 1.33 1.55 41.6
5/12-8/4 1.63 1.833 1.65 1.812 1.69 1.77 13.0
1 The zero level of each treatment main effect received no supplementation while the one level received supplements in accordance with the experi- mental design as explained in the text under experimental procedure. 2 Significantly higher than non-supplemented animals (P< 0.05). 3 Significantly higher than non-supplemented animals (P< 0.01). 4 Significant (P< 0.05) Protein x Salt interaction during these periods.
and over all period in
1958. The
consumption
of supplements
containing salt was somewhat
reduced during the early part of
the 1958 trial because of the rela-
tively high salt level fed.
The lack of consistent response
to both protein and energy sup-
plements during the first period
of 1958 may, on the other hand,
indicate
the supplementation
during this period is unnecessary
and may be detrimental.
The 1958 data indicated that
the high level of salt fed (0.5
pound per head daily) with cot-
tonseed meal and barley de-
creased performance during the
first month. The daily feeding
of 0.25 pound salt per steer dur-
ing 1959 appeared to increase the
performance obtained from feed-
ing cottonseed meal and barley
alone (Table 2) .
The significant
response resulting from salt sup-
plementation during the first
period of 1959 might be par-
tially attributed to an adjust-
ment of sodium: potassium ratio
in the animal’s diet. The work
of Hubbert, et al. (195813) sug-
gested that a more suitable
media was provided for rumen
bacteria when the sodium: po-
tassium ratio in the animal’s diet was approximately 1 to 1.
Where salt was fed in combi-
nation with cottonseed meal
there was an apparent depres- sion in gain compared to cotton- seed meal alone (Table 2). This was true during both years but was considerably more evident during the 1958 study. The re- striction in performance result- ing from high salt intake was possibly due to reduced forage intake brought about
by
in- creased water consumption. Crampton (1956) reported that forcing animals to consumean
excess of water may limit their
intake of nutrients because of
the limited capacity of the di-
gestive system. Results of this
study suggest the need for a
thorough evaluation of the in-
fluence of salt-protein mixtures
as supplements for young cattle
on range.
SUMMARY
Energy (barley), protein (cot-
tonseed meal) and sodium (salt)
supplements were fed alone and
in all possible combinations to
yearling cattle on crested wheat-
grass pasture during two grazing
seasons.
Both energy and protein sup-
plementation resulted in signifi-
cant increases in rate of gain
each year. Energy supplementa-
tion appeared more favorable
when forage was somewhat lim-
ited or when dry matter content
of the forage was relatively low.
The primary response to protein
supplementation occurred during
the latter part of the grazing
season.
Supplementation of sodium
(salt) resulted in a significant
gain response during the early
part of one year and appeared
somewhat detrimental to per-
formance during the other year.
When salt was fed in combina-
tion with cottonseed meal, year-
ling gains were reduced com-
pared with those from cotton-
seed meal alone.
Chemical analyses and
in vitrocellulose digestibility values of
crested wheatgrass samples col-
lected each year during the graz-
ing season were presented.
LITERATURE CITED
ANDERSON, G. C., C. J. CUNNINGHAM, J. 0. HEISHMAN AND E. A. LINESAY. 1957. Roughage supplements in rations for wintering yearling cattle. West Va. Univ. Agr. Expt. Sta. Bul. 409, 8p.
BOHMAN, V. A., HENRY MELENDY, AND M. A. WADE. 1955. Range beef cattle nutrition techniques. Jour. Animal Sci. 14: 1235 (abs.) . BOHAM, V. A. AND CLARK TORELL.
1956. Compensatory growth of beef: The effect of protein supple- ments. Jour. Animal Sci. 15:
1089-1096.
BROUSE, E. M. 1955. Wintering calves in the Nebraska sandhills. Nebr. Agr. Exp. Sta. Bul. 357 (revised), 43 p.
CRAMPTON, E. W. 1956. Applied animal nutrition. W. H. Freeman and Co., San Francisco, Calif., 458 P*
EMBRY, L. B., A. C. DITTMAN, AND G. F. GASTLER. 1958. Wintering calves with alfalfa or prairie hay. S. Dak. Agr. Expt. Sta. Bul. 466, 11 p. FRISCHKNECHT, NEIL C., LORIN E.
HARRIS, AND HARRY K. WOODWARD. 1953. Cattle gains and vegetal changes as influenced by grazing treatments on crested wheatgrass. Jour. Range Mangt. 6: 151-158. GUIL~ERT, H. R., AND G. H. HART.
RESPONSE OF YEARLING CATTLE 5
HARRIS, LORIN E., C. WAYNE COOK, AND JOHN E. BUTCHER. 1959. In- take and digestibility techniques and supplemental feeding in range forage evaluation. Agron. Jour. 51: 226-234.
HUBBERT, FARRIS JR., R. R. WHEELER, C. S. COOPER AND W. A. SAWYER. 1958a. The response of beef cattle to phosphorous fertilized flood meadow hay with in vitro obser- vation on factors influencing ru- men microorganisms activity.
Proc. West. Sec. Amer. Sot. of Animal Prod. 9: 61, 6 p.
HUBBERT, FARRIS JR., EDMUND CHENG AND WISE BURROUGHS. 1958b. The influence of potassium, sodium, rubidum, lithium and cesium on in vitro cellulose digestion by ru- men microorganisms with obser- vations upon sodium and potas- sium influences in lamb fattening rations. Jour. Animal Sci. 17: 576-585.
ROWDEN, W. W., J. E. INGALLS, K. E. GREGORY AND R. M. KOCH. Protein
supplements for beef calves on winter range. Nebr. Agr. Expt. Sta. Bul. SC 108, 7 p.
SNEVA, F. A. AND D. N. HYDER. 1962. Estimating herbage production on semiarid ranges of the intermoun- tain region. Jour. Range Mangt. 15: 2 88-93.
WALLACE, JOE D., C. B. RUMBURG AND R. J. RALEIGH. 1961; Evaluation of range and meadow forages at var- ious stages of maturity and levels of nitrogen fertilization. Jour. Animal Sci. 20: 684 (abs.) .
Native Grass and Crested Wheatgrass Prdduction
as Infl&ncedw by Fertilizer Placement
and Weed Controll
D. E. SMIKA, H. J. HAAS, AND G. A. ROGLER Soil Scientists, Soil and Water Conservation Research
Division; and Research Agronomist, Crops Research Di- vision, Agricultural Research Service, U. S. Department of Agriculture, Mandan, North Dakota. The senior au- thor is presently located at North Platte, Nebraska
In foreign countries %nd in most areas of the United States, fertilization of grassland is being practiced more extensively than ever before. The most conven- ient and most widely used meth- od of fertilizer application is sur- f a c e broadcasting. A n o t h e r method - subsurf ace placement -has gained popularity in re- cent years, largely because of the manufacture of machines speci- fically designed for this purpose. But does subsurf ace-placed f er- tilizer produce greater yield in- creases than fertilizer broadcast on the surface?
Karlorisky (1957) found over a a-year period that subsurface placement of phosphorus ferti- lizer resulted in 1 owe r grass yields than surface broadcasting. The National Joint Committee on Fertilizer Application (1948) reported that there is no need for incorporating any fertilizer material into the soil for grass
--
K!ontribution from Soil and Water Conservation Research Division and Crops Research Division, Agricul- tural Research Service, U. S. De- partment of Agriculture.
unless liquid or gaseous forms of nitrogen are u s e d. Neller and Hutton (1957) working in Flori- da found that depth of fertilizer placement did not significantly affect growth of grass.
In the Northern Great Plains cool-season grass species such as western wheatgrass (Agropyron
smithii), needle-and-thread grass (Stipa corn&a), and c r e s t e d
wheatgrass (Agropyron deser-
torum) respond to nitrogen fer- tilization w i t h very vigorous growth in early spring (Rogler & Lorenz, 1957). However, weeds and various sage species present in much of the grassland will also r e s p o n d to nitrogen and make heavy growth, particularly during the first growing season after fertilization.
Vigorous cool-season g r a s s
growth and perennial w e e d
growth may suppress warm-sea- son annual weed growth. In a review on pasture weed control in the North Central Region, Klingman (1956) reported that fertilizer helped control some weeds, particularly annuals, by developing dompetition f r o m
grasses. H a y and Quellettee (1959) obtained some weed con- trol with fertilizer alone, but best results from the standpoint of both yield of grass and ab- sence of weeds in pastu?es were obtained when fertilizer tie%- ment was supplemented by 2,4-D applications.
The study reported herein was conducted at the Northern Great Plains Field Station, Mandan, North Dakota. T h e objectives were to (1) determine the effect of one application each of sur- face broadcast and subsurface placed nitrogen and phosphorus fertilizer on the yield of native grass a n d crested wheatgrass, and (2) determine the effects of chemical weed spray and ferti- lizer and the interaction of these treatments on the con t r 01 of fringed sage and other weeds and the subsequent effect on the yield of grass in the two pas- tures.
6
SMIKA, HAAS AND ROGLER
Table 1. Seasonal. April through July, climatic data during period of study and long iime average. Norihern Greaf Plains Field Siafion, Mandaa North Dakota.
Precipitation (inches Evaporation (inches) Mean seasonal temperature
Maximum (“F) Minimum (OF)
1958 1959 1960
8.74 5.28 10.94
21.91 23.40 22.53
70 72 71
46 46 45
45 year average 9.34 21.80 68 46
leaf-sedge (Carex filifolia).
Thecrested wheatgrass pasture con-
tained only a sparse stand of the
original grass. Both areas had a
very high infestation of fringed
sage
(Artemisia frigida).Other
weeds of importance growing on
the plots of both areas were
marestail
(Erigeron canadensisL.)
,
dandelion
(Taraxacum of- ficinale),and t a n s y mustard
(Descurainia pinnata).The soil at both experimental
sites is Eakin silt loam, which
consists of a loess layer of about
24 inches over glacial till. At
both sites the O-to- g-and 6- 12-
inch d e p t h s had a saturated
paste pH of 6.5 and 6.6, respec-
tively. The average total nitro-
gen content of the O-to 6-and 6-to
12-inch depths was .274 and .160
percent, respectively, at the na-
tive grass plot site and .239 and
.126 percent, respectively, at the
crested wheatgrass plot site. So-
dium bicarbonate soluble phos-
phorus content of the O-to 6-and
6-to la-inch depths was
25and
13 pounds of
P205per acre, re-
spectively, in both plot areas. At
this phosphorus level, yield re-
sponse to phosphorus fertilizer
was considered probable.
Climatic data during the 3
years of the study and 45-year
averages are presented in Table
1.
A split-split plot design with
three replications was used in
both study areas. Main plots
were fertility treatments-O-O,
40-0, 80-0, 160-0, O-40, 80-40, and
80-80 pounds of nitrogen (am-
monium nitrate)
and P205
(triple s u p e r phosphate) per
acre, respectively. Subplots (11.8
by 24 feet) were fertilizer appli-
cation methods-surface
broad-
cast and subsurface placement
at a 4-inch depth. One-half of
each non-fertilized p 1 o t was
treated with the drill without
fertilizer to determine the effect
of the drill alone. Fertilizer was
applied only once, on October 28
or 29, 1957, by means of a John
Deere Grassland Drill.2 This im-
plement had 2-inch shoes spaced
ten inches
apart. One-half of
each subplot w a s sprayed on
June 9, 1958 at the rate of ap-
Table 2. 1958-60 average ovendry yields of native grass by fertilizer freaf- menfs and method of application.
Grass Yields Fertilizer Fertilizer
treatments surf ace
N-P205 broadcast
Fertilizer subsurface placed drill effect drill effect
included deducted
A---_--- (Pounds/Acre) - - - -
o-o 340 490” 340
40-O 490 600 450
80-O 800 940 790
160-O 1100 1190 1040
O-40 290 480* 330
80-40 710 920* 770
80-80 770 910 ‘760
* Significantly greater
than surface broadcast yield (P 95 or greater),proximately 2.5 pounds 01 acid
equivalent 2,4-D ester per acre.
The crested wheatgrass and
native grass p lo t s were har-
vested each year in late June and
late July, respectively. The grass
on both sites was harvested at
approximately one-inch above
the ground.
Sage and other
weeds were hand-separated from
the grass and the amount of each
determined on a dry w eight
basis.
Results and Discussim
Native Grass Study
Fertilizer placement -
Grass
yields were greater f r o m the
subsurface-placed than from the
s u r f a c e broadcast treatment
(Table 2) .
The difference, how-
ever, was due to the cultivating
effect of the drill rather than to
placement of fertilizer. That is,
when the increase due to the
drill alone on the non-fertilized
treatment was deducted from
the yield of each of the other
subsurface-placed f e r t i 1 i z e r
treatments, there was no differ-
ence in yield due to placement of
fertilizer. Grass height on plots
in which fertilizer was subsur-
face placed averaged over two
inches taller than on plots which
received the surface application
of fertilizer for the three years
of study. The cultivating action
of the drill on the subsurface-
placed plots thinned the stand of
grass but did not increase weed
production. Thus, there were
fewer plants to c 0 m p e t e for
moisture and nutrients, which
resulted in greater grass growth.
The response to fertilizer was
due entirely to nitrogen. No
yield increase was obtained from
phosphorus irrespective of rate,
method of application, or the
addition of nitrogen even though
a soil test indicated a response
PRODUCTION, PLACEMENT AND WEED CONTROL 7
Table 3. Fringed sage and other weeds in native grass yields during 3 years1 by fertilizer and spray ireatmenk
- Fertilizer
treatments Non-Sprayed Treatment Sprayed Treatment N-P20r, 1958 1959 - _____ 1960 --__ -- 1958 1959 1960 (Lbs./Ac) - - - (Percent) - - - -
o-o 53.5 10.8 21.5 6.2 1.3 3.5
40-O 58.5 8.8 31.8 28.6 0.4 1.6
80-O 70.9 15.8 18.8 22.2 0.8 2.9
160-O 72.3 17.0 24.0 22.8 3.4 0.3
O-40 60.6 9.5 29.5 23.3 0.0 4.6
80-40 75.0 15.3 17.0 31.1 0.0 1.3
80-80 75.8 10.5 16.2 27.5 0.1 5.1
1 Average of subsurface placed and surface broadcast plots.
present study it has been effec- tive for three years and it ap- pears that there may be some carryover into the fourth year.
to phosphorus could be expected. In general, fringed sage and Spraying effects - Percent of other weed production increased fringed sage and other weeds in in 1960 on both the sprayed and native grass (Table 3) was large- non-sprayed plots, compared to ly reduced by spraying alone. 1959. More precipitation in 1960 S o m e additional decrease oc- may h a v e accounted for this. curred, however, in the second The percentage present in the year after spraying where 160 sprayed plot y i e 1 d s, however, pounds of nitrogen fertilizer had was still very small.
been applied in conjunction with The number of years that a spraying. Fertilization alone had single spraying will be effective little effect on reducing the has not been determined. In the
Yields of native grass from all fertilizer treatments (Table 4) were higher with spraying than without. The difference between native grass yields from sprayed and non-sprayed treatments in- creased as the rate of nitrogen increased. By controlling t h e weed growth with spray, more nitrogen and m o i s t u r e were
available to increase grass
growth rather than weed
growth.
Cresfed Wheafgrass Study
Table 4. Ovendry yields <of native grass for the 1958-1960 period by fer- filizer and spray treatments.
Fertilizer
treatments Non-Sprayed Sprayed Increase due
N-PzO~ Treatment Treatment to spray
_
--- (Pounds/Acre) - - - -
o-o 370 450 80””
40-O 480 610 130””
80-O 770 970 200**
160-O 1020 1260 240””
O-40 360 410 50””
80-40 740 890 150””
80-80 770 910 140**
**Significant increase P .Ol.
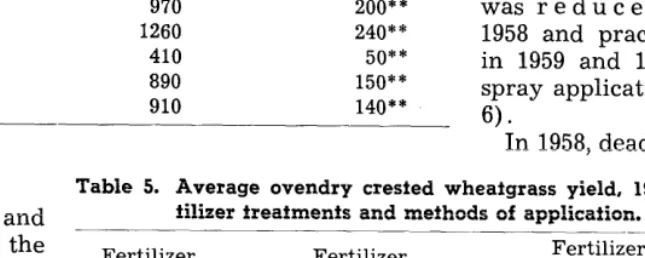
Fertilizer placement - Yields
of crested wheatgrass were
greater when the fertilizer was
subsurface placed than when
broadcast (Table 5). As with the native grass the increase from subsurface placement of ferti- lizer was due to the cultivating effect of the drill alone and not the placement of the fertilizer.
Crested wheatgrass responded to phosphorus only when nitro-
gen was applied with phos-
phorus. Method of application had no effect on response.
Spraying effects - Percentage of fringed sage and other weeds
was reduced considerably in
1958 and practically eliminated in 1959 and 1960 by the single spray application in 1958 (Table 6).
In 1958, dead weeds, consisting weed content.
Much of the high sage and
other weed content in the
sprayed plots consisted of dead
plants. Spraying killed the
plants but they were still pres- ent and made up a considerable portion of the 1958 harvest yields.
Weed production on the non- sprayed plots was much less in 1959 than in 1958, possibly due to less precipitation in 1959. In those plots w h i c h had been sprayed there was v e r y little weed growth.
Table 5. Average ovendry crested wheatgrass yield, 1958 to 1960.1 by fer- tilizer treatments and methods of application.
Fertilizer treatments
N-P205
Fertilizer surf ace broadcast
Fertilizer subsurface placed Drill effect Drill effect
included deducted
- 7 - - - a _ - _ _ _ (Pounds/Acre) - - - -
o-o 370 710** 370
40-O 600 980** 640
80-O 790 1090” 750
160-O 940 1190” 850
O-40 340 690” 350
80-40 840 1210* 870
80-80 960 1270” 930
1 Average of sprayed and non-sprayed plots.
8 SMIKA, HAAS AND ROGLER
Table 6. Fringed sage and ofher weeds in crested wheafgrass during 3 years1 by fertilizer and spray treatments.
Fertilizer
treatments Non-Sprayed Treatment -___ Sprayed Treatment
N-P205 1958 1959 1960 1958 1959 1960
(Lbs./Ac) - - - (Percent) - - - -
o-o 25.9 4.4 11.3 7.9 0.5 0.0
40-O 29.6 2.3 1.2 11.7 0.0 0.0
80-O 32.6 3.1 1.6 10.2 0.0 0.0
160-O 32.9 1.3 0.9 13.2 0.0 0.0
O-40 29.3 2.5 7.4 10.4 0.4 0.0
80-40 30.3 1.6 0.8 15.8 0.0 0.0
80-80 27.9 03 0.6 12.7 0.1 0.0
1 Average of subsurface placed and surface broadcast plots.
primarily of fringed sage, were
still present at harvest time in
the sprayed plots. If spraying
had been d o n e earlier, weed
growth w o u 1 d probably have
been less. Fertilization tended
to increase t h e percentage of
weeds in both the sprayed and
non-sprayed yields in 1958.
By 1959, no weeds or sage
were present w h e r e nitrogen
was applied in conjunction with
the spray. All non-sprayed plots
also showed a sharp reduction in
weed percentage in 1959, with
plots which had received nitro-
gen showing the greatest reduc-
tion.
Weeds w e r e not present in
1960 in plots which had been
sprayed in 1958 and were less
prevalent in t h e non-sprayed,
nitrogen-fertilized plots than in
1958 an d 1959. On t h e non-
sprayed, no nitrogen plots, per-
centage of weeds increased in
1960 compared to 1959.
A single spray application and
nitrogen fertilizer were success-
ful in eliminating sage and other
weeds from the crested wheat-
grass yields.
Yields of crested wheatgrass
were s 1 i gh t ly higher from
sprayed than from non-sprayed
areas (Table 7). However, the
differences were significant for
only the O-O and O-40 treatments.
,
Fringed sage and other weeds
w e r e
primarily controlled in
both pastures by spraying alone.
The nitrogen fertilization, how-
ever, was moderately successful
in reducing the weed percentage
in crested wheatgrass the second
and third year after application
by encouraging the growth of
grass, w h i c h in turn offered
greater competiton to weeds.
Where weed growth was elimi-
nated by spraying, grass yields
were increased.
Table 7. Ovendry crested wheatgrass yields from sprayed and non-sgrayed plots by ferfilizer treatments.1
Fertilizer
treatments Non-Sprayed Sprayed Increase due
N-P205 Treatment Treatment to spray
---_ (Pounds/Acre) - - - -
o-o 470 610 140**
40-O 780 790 10
80-O 930 950 20
160-O 1010 1030 20
O-40 470 560 go**
80-40 1000 1060 60
80-80 1110 1120 10
1 Average of subsurface placed and surface broadcast plots for the period 1958-1960.
** Significant increase P .Ol
Summary LITERATURE CITED
Effects of surface and subsur-
HAY, JR., R. AND G. J. QUELLETTE.face placement of fertilizer on
1959. The role of fertilizer andthe yield of native grass and
weeds. Canadian Jour. of Plant 2,4-D in the control of pasturecrested wheatgrass were deter-
mined, as well as the effects on
yield of 2,4-D spraying to con-
trol fringed
sage and other
weeds.
Sci. 39: 278-283.
KARLORISKY, J. N. 1957. No benefit from subsurface placement of phosphatic fertilizers in pasture. New Zealand Jour. Agri. 95: 245. KLINGMAN, D. L. 1956. Weed control
in pastures in the North Central Region. Weeds 4: 369-375.
Yields of both native
and
crested wheatgrass were higher
when fertilizer was subsurface
placed, but the increase was due
to the cultivating effect of the
drill and not to the placement
of the fertilizer. Native grass
showed no y i e 1 d response to
phosphorus with or without
ni-trogen, but crested wheatgrass
showed a small response to phos-
phorus when applied in conjunc-
tion with nitrogen.
NATIONAL JOINT COMMITTEE ON FER- TILIZER APPLICATION. 1948. Methods of applying fertilizer. Nat. Fert. Assoc. Pamphlet No. 149: 11. NELLER, J. R. AND C. E. HUTTON. 1957.
Comparisons of surface and sub- surface placement of superphos- phate on growth and uptake of phosphorus of sodded grass. Agron. Jour. 49: 347-351.
A Modification of the Line Intercept Method
For Sampling Understory Vegetation
THOMAS H. RIPLEY,1 FRANK M. JOHNSON,2 AND WILLIAM H. MOORE1
No single technique of vegeta- tion measurement is universally applicable. All approaches have features and limitations which control use to specific study or inventory requirements and area characteristics. Not excluded are problems of measuring the com- position and density of forage-
bearing twigs and stems in
woody understories. Additional complications are met if study or inventory requirements intro- duce needs to assess utilization. For these reasons, and because small changes frequently must be measured with a high degree of sensitivity, several procedures (developed by other workers) were combined with some inno- vations to produce the under-
story measurement techniques
described here.
Canfield (1941), in a major contribution, described the use of the line intercept method and provided a base for a number of important developments in line, line point, and loop techniques. Our innovation has its genesis in Canfield’s method, for it is basically a line intercept ap-
proach-or perhaps, more spe-
cifically, a vertical plane inter- cept method. Because of a need to work in a definitive zone, an established or fixed height of sampling plane was designated (usually 4.5 feet). Also, because total density was of greater con-
1Southeastern Forest Experiment Station, Forest Service, U. S. De- partment of AgricuZture.
2Bureau of Sport Fisheries and Wildlife, Fish and Wildlife Service, U. S. Department of Interior. sparker, K. W. A method for meas-
uring trend in range condition on nationa forest ranges. Forest Serv- ice, U. S. Dept. Agr. 1951. (Unpub- lished Plan for Administrative Studies.)
tern than length of crown inter- cept, the vertical plane served well as a basis for counting all forage or forage-producing inter- cepts.
ably angle iron or aluminum) driven into the ground at 0.5, 50.5, and 99.5 links or feet (de- pending on whether a chain or lOO-foot tape is used) served as permanent references for relo- cating transects. Although origi- nally designed for inventory of
grassland communities, the
method of line location is equal- ly suited to understory condi- tions.
Parker,3 in his “three-step” The advantages of permanent
method, employed a widely used plots for most work involving system to mark and relocate line measurement of change are ob- intercepts; his methods proved vious and need no elaboration. very useful in this approach. Where a single estimate of den- With only a slight change in lo- sity or of species or group occur- cation from Parker’s procedure, rence is desired and no remeas- three sharpened stakes (prefer- urement is desired, the use of
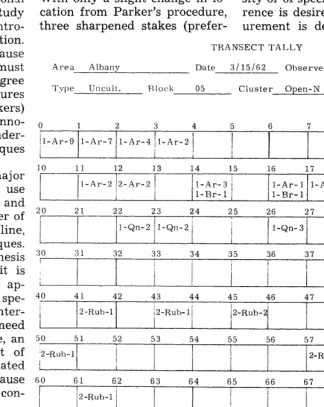
TRANSECT TALLY
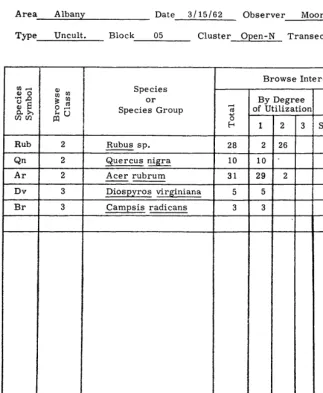
Area Albany Date 3/15/62 Observer Moore-Downing
T,vpe Uncult. Block 05 Cluster Open-N Transect 3
0 1 2 3 4 5
ll-Ar-9 l-Ar-7 l-Ar-4 jl-Ar-2 1
I 1 ,
10 11 12 13 14 15
l-Ar-2 2-Ar-2 l-Ar-3 /
/ 1-Br-1 1
20 21 22 23 24 25
r
,l-Qn-2 l-Qn-2 I
I
6 7 8 9 10
16 17 18 19 20
1-Ar- 1 l-Ar- 1 1-Br- 1
26 27 28 29 30
l-Qn- 3 l-Qn-2 1-Qn- 1
1-Br- 1
30 31 32
1 I
40 41 42
2-Rub-l
50 51 52
‘2-Rub-l
I
33 34
/ I
43 44
j2-Rub-li
53 54
35 36
I
45 46
/2-Rub-2’
55 56
37 38 39 40
2-Rub-2 2-Rub-5
47 48 49 50
57 58 59 60
2-Rub-l 2-Rub-l
60 61 62
2-Rub-l ’
63 64 65 66 67 68 69 70
i
I 2-Rub-l 1-Dv- 1
70 71
‘l-Rub-1 j I
80 81
1
I i I 90 91
72
, I
82
92
73 74
l-Rub-l
83 84
t
93 94
/2-Rub-7
75 76 77 78 79
/
2-Rub-l 1-Dv- 1’
jl-Dv-3
I
85 86 87 88 89
I
95 96 97 98 99
I
I 2-Rub-2
80
90
100
1
FIGURE 1. A sample transect tally sheet.
10 RIPLEY, JOHNSON AND MOORE
permanent plots is unnecessary. In any case, whether the line is to be permanently or temporar- ily located, a tape or chain stretched in place serves as the unit of measurement.
Location of units can be sys- tematic, random, or a combina- tion of both, depending upon the needs of the study. Generally, where exclosures are used, pairs of fenced and open plots located randomly within strata or popu- lations to be sampled are useful. Within these, it is desirable to locate systematically a series of protected and open lines. Again, number and length of lines and sizes of plots are controlled by study needs and variation in the understory. In several under- stories sampled in the Southeast, four one-chain transects appear to approach an optimum within 1x3-chain plots.
The procedures used in meas- uring each sampling unit or ver- tical plane l-chain long involve recording all woody (or other- wise specified) plant parts in- tercepted by the vertical plane of established height usually cor- responding to the upper limit of the zone of browsing (i.e., 4.5 feet). In the field, this plane is quickly and easily defined by running a vertical rod of the de- sired height along the edge of the chain (Ripley et al., 1960). Any number of specifications can be imposed to govern the type of information collected, depending on the study needs. One useful approach is to record only those intercepts which pro- duce browse below the upper surface of the designated sam- pling zone (4.5 feet) and distal to the point of intercept. This realistically eliminates all inter- cepts on major stems and trunks which do not contribute forage within the reach of browsing animals. For convenience in the field and to minimize recording errors, it seems convenient (though not essential) to sub- divide the sampling plane into segments. For example, 100 one-
TRANSECT SPECIES SUMMARY
Area Albany Date 3115162 Observer Moore-Downing
Vpe Uncult. Block 05 Cluster Open-N Transect 3
Browse Intercepts Species
or
Species Group
T
BY Age
Class
Y M
By Degree of Utilizatior 11
Rub 2 I Rubus sp. 28
2
26
2
5
3 1
2
10
29
5
3
Totals 77 49 28
-
3 -
- -
-
-
-
-
- 0 -
-
D -
-
- -
-
-
-
-
- Qn
Ar
Dv
Br
FIGURE 2. A sample transect species summary.
TRANSECT SUMMARY
BY
BROWSE CLASSES
Area Albany Date 3115162 Observer Moore-Downing
Type Uncult. Block - 05 Plot p Cluster Open-N Transect 3
INTERCEPT SUMMARY AGE SUMMARY BROWSE SUMMARY
Class
None
<30%
> 30%
Total 69 8
link segments in a chain provide a useful subdivision and data are easily recorded on a tally sheet (Figure 1). Intercepts recorded by segments are also easily sum- marized for each plane (sampling unit). It appears convenient to record plant intercepts using a two- or three-letter symbol for each species (after Parker, on cit.) encountered, together with the number of intercepts.
In some instances, it is desir- able to record also the degree of utilization by numerical entry. Entries of 1, 2, or 3, for example, are useful in specifying the aver- age degree of use on plants con- tributing to each species entry
shown: where 1 indicates no
browsing, 2 up to 30 percent of available growing tips browsed, and 3 is 31 percent or more browsed. To avoid confusion, entries for use and numbers of intercepts can be separated by the species symbol (Figure 1). In some cases it is desirable to char- acterize the age of the material
sampled by using convenient
symbols such as those employed by Parker.4
Data summaries for sampling units are simple, direct, and use- ful in reducing transect data prior to analysis (Figures 2 and 3). Here, total intercepts are re- corded by species showing totals and distributions by artificial utilization and age classes. An- other summary which has utility in some cases involves sorting species into realistic browse preference classes. Summaries of numerous species frequently have little meaning, and study
requirements can be met by
comparing areas or time series using these meaningful prefer-
LINE INTERCEPT METHOD
ence groupings. Such a reduc- tion has been shown in Figure 3 from species data provided in Figure 2. In order that the sum- mary of data procedures outlined here can be readily followed, actual field data are shown in Figure 1, and these are summar- ized in Figures 2 and 3 (data taken from the middle coastal plain of Georgia).
A modification not illustrated here that appears to be quite use- ful is the recognition of vertical substrata in the sampling plane. By splitting the tally sheet into “layers,” intercepts may be re- corded in strata at any height above the ground. This tech- nique is valuable in trying to detect browsing effects at differ- ent levels, especially if height development of certain species is a major consideration.
The deficiencies in this modifi- cation of the line intercept meth- od are also great, though not unique. The procedure still pro- vides no real solution for com- paring various growth forms in understory vegetation, including the modifying effects of animals. Unless detailed records are main- tained separately, no clear pic- ture of crown spread changes can be examined. Further, un- less some consideration is given to the size (e.g., diameter) of the intercepts, there is only a crude, probable relation to for- age production or availability.
As a technique for measuring change, however, this method has a number of good features. First, it incorporates the advan- tages of the long, narrow plot in reducing between-plot varia- tion with the attendant advan- tage of reducing replications.
11
When established with perma- nent stakes, transect remeasure- ment provides a basis for analy- sis of difference-a desirable feature where time series are in-
volved. The summaries shown
here permit rapid examination of data using standard statisti- cal testing procedures. Hypothe- sis concerning either continuous or discrete variables can be tested. Also, the method bypasses bias inherent in methods em- ploying a loop (Cook and Box, 1961; Kinsinger et al., 1960; and Johnston, 1957). Finally, larger volumes of data are obtained for comparable units of effort than with either point or loop sam- pling.
LITERATURE CITED
CANFIELD, R. H. 1941. Application of the line interception method in sampling range vegetation. Jour. Forestry 39: 388-394.
COOK, C. WAYNE, AND Box, THADIS W. 1961. A comparison of the loop and point methods of analyzing vegetation. Jour. Range Mangt. 14: 22-27.
JOHNSTON, A. 1957. A comparison of the line interception vertical point quadrat and loop methods as .used in measuring basal area of grass land vegetation. Canad. Jour. Plant Sci. 37: 34-42.
KINSINGER, FLOYD E., ECKERT, RICHARD E., AND CURRIE, PAT 0. 1960. A comparison of the line-intercep- tion, variable-plot and loop meth- ods as used to measure shrub- crown cover. Jour. Range Mangt. 13: 17-21.
RIPLEY, THOMAS H., JOHNSON, FRANK M., AND THOMAS, WILLIAM P. 1960. A useful device for sampling un- derstory woody vegetation. Jour. Range Mangt. 13: 262-263.
Salt Consumption by Breeding Cows on
Native Range in the Northern Great Plains
WALTER R. HOUSTON
Range Conservationist (Research) Crops Research Divi- sion, Agricultural Research Service, U.S. Department of Agriculture, Miles City, Montana
Little information is available on the amounts of salt (sodium chloride) used by breeding cows on native range or the seasonal distribution of use, although such information is important to livestock management. Salt in- take is influenced by the form of the salt (loose or block), differ- ences between individuals, water intake, the supply of other min- erals, age and possibly breeding status of animals, composition of forage, soils, season, and climate. Since salt is inexpensive, usually more of it is provided than con- sumed or needed.
Salt is essential to animal nu- trition. Chlorine is a normal con- stituent of saliva and other body secretions, and its absence causes poor health, appetite failure, and loss of weight (Mitchell and McClure, 1937). Sodium, which functions as a carrier of chlorine, is also necessary for animal health. It is found primarily in blood serum and in muscles. Al- lowing animals to satisfy their normal salt appetite appears to satisfy requirements for these elements. Lack of salt also low- ers digestibility of forage by steers (Smith et al. 1950).
Sodium chloride and other
salts are found in many forage species in the West, and often in water supplies. Many western soils contain variable amounts of alkali salts. The forage and both surf ace and subsurf ace waters obtain salts from these soils.
In New Mexico Lantow (1933) found greater amounts of chlo- rine in green vegetation than in dry. Native grasses contained 0.05 to 0.64 percent salt, with the salt content increasing with for- age growth. Goss (1903) in New
Mexico found samples of salt- grass (DistichZis sp.) contained 0.28 percent salt, seepweed (Suaeda sp.) 1.53 percent, four- wing saltbush (Atriplex cane- seem) 0.08 percent, and grease- wood (Sarcobatus sp.) 1.11 per- cent salt. In Texas Fraps and Lomanitz (1920) found native grasses to average about 0.25 percent salt. However, Morrison
(1956) indicated that salt con- tent of pasture grasses, western plains, averaged 0.19 to 0.06 per- cent salt (sodium plus chlorine) with increasing growth and ma- turity. He also stated that most dry hays ranged from 1.19 to 0.23 percent salt.
Hensel (1921) reported salt consumption by two-year-old steers in Kansas to average about 2.8 pounds per head per month during the spring, but only about 1.2 in October. Ares (1941) found salt consumption by cows on rangeland was little affected by placing the salt at water or away from it. Con- sumption per cow averaged 13.4 and 12.0 pounds annually for the respective locations. Studies of salt consumption by Stanley
(1938) in Arizona indicated that salt consumption was greater on dry feed than on green. How-
ever, Lantow (1933) found a
high correlation between salt consumption and precipitation during a given period.
Kennedy (1935) found ab-
normally high consumption of
salt-bonemeal mixture (3 to 1 proportions) during the drought of 1936 on the same pastures used in this study. On these same pastures Woolfolk (1944) reported no effects of stocking rate on salt-bonemeal consump-
12
tion, but did find a direct rela- tionship between summer pre- cipitation and salt consumption.
Woolfolk also suggested that
high amounts of alkali in the soils and water reduced salt- bonemeal consumption.
Use of salt both as an aid in livestock distribution, and as a feed intake regulator for concen- trates during winter is increas- ing (Ares, 1953).
Method of Study
In the course of a range stock- ing-rate study with Hereford breeding cows at the U. S. Range Livestock Experiment Station, Miles City, Montana, salt con- sumption was determined at 28- day intervals throughout the year from early November 1951 through October 1957.
The cows were divided into six groups of 10 animals and each group was grazed at a separate stocking rate on native range. The groups were rotated from separate summer to winter pas- tures and back each year. The animals were on winter range from November 1 to mid-May, and on summer range the re- maining 5.5 months of the year. Calves were born on the winter range between late March and early May and weaned at the end of the summer grazing sea-
son. Cows normally consumed
about 3/4 ton of hay during late winter.
Stock water was available to all groups of animals from a cen- tral tank at each range unit. There was no other source of permanent water, although some ponds and shallow streams fur- nished water for short periods after storms.