© 2014, IJCSMC All Rights Reserved 272
Available Online atwww.ijcsmc.com
International Journal of Computer Science and Mobile Computing
A Monthly Journal of Computer Science and Information Technology
ISSN 2320–088X
IJCSMC, Vol. 3, Issue. 1, January 2014, pg.272 – 280
RESEARCH ARTICLE
An Image Fusion Method Using DT-CWT
and Average Gradient
A. M. El Ejaily
1, F. Eltohamy
2, M. S. Hamid
3, G. Ismail
41
Libyan Armed Force
2,3,4
Egyptian Armed Force
1
ejaily54@ yahoo.com; 2 [email protected]; 4 [email protected]
Abstract— Image fusion is a technique of combining complementary information from multiple images originated from different sources into single fused image. This paper proposes an image fusion method to merge remote sensing satellite images based on Dual-Tree Complex Wavelet Transform (DT-CWT). The Quickbird and Worldview satellite data are used for carrying out the experimental work. The objective and visual results show the superiority of the proposed fusion method over that based on classical discrete wavelet transform (DWT) and other methods based on the DT-CWT.
Keywords— Image fusion; Remote sensing; Dual-Tree complex wavelet transform DT-CWT; discrete wavelet transform DWT
I. INTRODUCTION
In the field of remote sensing, the aim of image fusion is to improve the quality of remotely sensed images for better classification and features extraction and consequently increasing satellite data usage and extending remote sensing image applications [1]. A variety of image fusion techniques have been developed. However the main drawback of image fusion techniques is the distortion of the original color that introduced in the fused image.
The most common form of image fusion methods is the one that based on discrete wavelet transform DWT proposed by mallat [2]. Fusion of a high resolution panchromatic image (PAN) and a multispectral image (MS) by DWT results in fused image that highly preserve the spectral information of multispectral image, this is because of the ability of the DWT of the analysis of the images to be fused in both time and frequency domains. However, the DWT suffers from the following two limitations [3]:
© 2014, IJCSMC All Rights Reserved 273
cannot distinguish between the opposing diagonal directions.
In this paper, an image fusion method based on DT-CWT is proposed. Visual inspection and objective measures of high-pass correlation (HPC), spectral discrepancy (DK), root mean square error (RMSE) and universal image quality index (UIQI) are used to assess the spatial and spectral quality of the obtained fused images. the results are compared with that obtained from other image fusion methods based on DWT and CWT.
II. THE DUAL-TREE COMPLEX WAVELET TRANSFORM
The Dual-Tree Complex Wavelet Transform (DT-CWT) has been introduced to overcome the disadvantages of real DWT. The overall performance of the DT-CWT design ensures the following properties [4 ]:
Approximate shift invariance,
Good directional selectivity in 2-D with Gabor-like filters also true for higher dimensionality (m-D),
Perfect reconstruction using short linear-phase filters,
Limited redundancy: independent of the number of scales: 2:1 for 1-D (2m :1) for m-D,
Efficient order-N computation - only twice the simple DWT for 1-D (2m times for m-D);
The overall performance of the DT-CWT design ensures the shift invariance property of the transformation. Moreover, it improves the directional selectivity compared to the DWT since it produces six directional subbands at each scale oriented at ±15 , ±45 , ±75 compared to the three directional subbands of the DWT. Fig. 1 shows a two-level decomposition of 1-D signal f(x) using DT-CWT.
A DT-CWT transformation of 1-D signal f(x) in terms of shifted and dilated wavelet function
( )
and scaling function( )
is given by the following equation [5]:( ) =
∑
, ,( ) +
∑
∑
, ,( )
(1)Where Z is the set of natural numbers, j and l refer to the index of shifts and dilations, respectively, is the scaling coefficient, and , is the complex wavelet coefficient with
,
( ) =
∅
,( ) +
√−
1
∅
,( )
andψ
,(x) =
ψ
,(x) + -1
ψ
,(x)
, where thesuperscripts r and i denote the real and imaginary parts, respectively. To compute the 2-D DT-CWT of images, the two trees are applied to the rows and then to the columns of the image as in the basic DWT. This operation results in six complex high-pass subbands at each level and two complex low-pass subbands on which subsequent stages iterate. The decomposition of 2D signal can be expressed in the same manner like the 1-D decomposition in [5] as follows
( ) =
∑
, ,( , ) +
∑
∈∑
∑
. ,( , )
(2)© 2014, IJCSMC All Rights Reserved 274 Fig. 1. Dual tree complex wavelet as implemented by N. kingsbury in [4]
In this paper, the advantages of the DT-CWT over the DWT are exploited by designing an image fusion scheme based on CWT as explained in the next section.
III.THE PROPOSED DT-CWT BASED IMAGE FUSION METHOD
Many of image fusion algorithms based on the DWT have been used [6,7]. Though an image fusion technique based on the DWT outperforms the classical image fusion techniques such as IHS, Brovey, and PCA, it still has some problems due to the disadvantages mentioned in the previous section.
The advantages of the DT-CWT over the DWT motivate researchers to use it in image fusion algorithms[3], [8-12]. In [8] a DT-CWT based image fusion method is proposed in which the low pass coefficients of the MS image are retained as the low pass coefficients of the fused image while the detail coefficients are fused by choosing the absolute maximum. In [11] the approximation coefficients are fused by averaging while selecting the absolute maximum of the details coefficients. This paper proposes an image fusion approach based on the DT-CWT to fuse a low spatial resolution MS image with a high spatial resolution PAN image. First the two input images are co-registered to each other and decomposed using the DT-CWT. Then, the resulted approximation and detail coefficients are fused according to a certain fusion method. Finally the fused image is reconstructed using the inverse DT-CWT of the fused coefficients. This is illustrated in Fig. 2. The proposed method is explained in details in the following points.
1. The low spatial resolution MS image is co-registered to the same area as the high spatial resolution PAN image and resampled to the same resolution as the PAN image. 2. The PAN image is histogram matched to each band of the MS image. This is
performed in order to compensate for the spectral difference between the two images, which occurred due to different sensors, acquisition dates, and viewing angles.
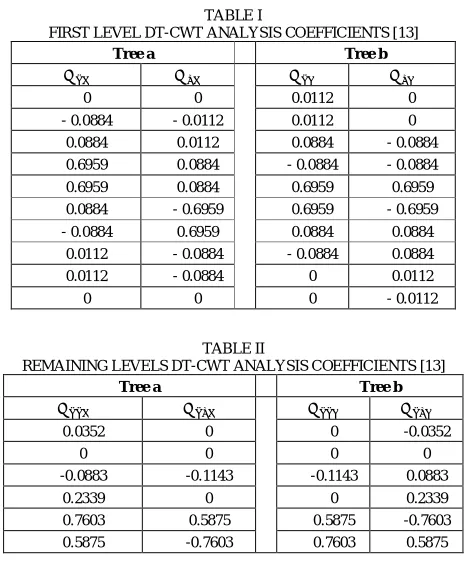
3. The histogram matched PAN images and registered MS image bands are decomposed using three levels of the DT-CWT to form their multi-resolution and multi-directional composition. This is achieved by using length-10 analysis and synthesis filters. Table I shows the coefficients of the analysis filters in the first level [13] and Table II shows
( )
2↓
2↓
2↓
2↓
2↓
2↓
2↓
2↓
(Real Part)
(Imaginary Part)
Details Approximation
Approximation
© 2014, IJCSMC All Rights Reserved 275
filters are obtained by simply reversing the coefficients of the analysis filters.
Fig. 2. Procedure of the DT-CWT based image fusion method TABLE I
FIRST LEVEL DT-CWT ANALYSIS COEFFICIENTS [13]
Tree a Tree b
0 0 0.0112 0
- 0.0884 - 0.0112 0.0112 0 0.0884 0.0112 0.0884 - 0.0884 0.6959 0.0884 - 0.0884 - 0.0884 0.6959 0.0884 0.6959 0.6959 0.0884 - 0.6959 0.6959 - 0.6959 - 0.0884 0.6959 0.0884 0.0884
0.0112 - 0.0884 - 0.0884 0.0884 0.0112 - 0.0884 0 0.0112
0 0 0 - 0.0112
TABLE II
REMAINING LEVELS DT-CWT ANALYSIS COEFFICIENTS [13]
Tree a Tree b
0.0352 0 0 -0.0352
0 0 0 0
-0.0883 -0.1143 -0.1143 0.0883
0.2339 0 0 0.2339
0.7603 0.5875 0.5875 -0.7603 0.5875 -0.7603 0.7603 0.5875
MS Image
DT-CWT Analysis
↖−45°
↖−15°
↗15°
↗75°
↖45°
↖−75°
PAN Image
DT-CWT Analysis
↖−45°
↖−15°
↗15°
↗75°
↖45°
↖−75°
Fusion Algorithm
DT-CWT Synthesis
Fused Image
↖−45°
↖−15°
↗15°
↗75°
↖45°
© 2014, IJCSMC All Rights Reserved 276
0 0.2339 0.2339 0
-0.1143 0.0883 -0.0883 -0.1143
0 0 0 0
0 -0.0352 0.0352 0
4. The fusion starts from the coarsest to the finest level of decomposition. The real and imaginary parts of the detail coefficients of the PAN image at location (i,j) are denoted by
D (i. j), and D (i. j), respectively. The real and imaginary parts of the approximation
coefficients of the PAN image at location (i,j) are denoted by A (i. j) and A (i. j), respectively. The corresponding notations for the MS image are D (i. j), D (i. j), A (i. j),
and A (i. j), and for fused image are D (i. j), D (i. j), A (i. j), and A (i. j). The real and
imaginary parts of the approximation coefficients of the fused image are synthesized according to the averaging rule:
A (i. j) = (A (i. j) + A (i. j))/2 (3) A (i. j) = (A (i. j) + A (i. j))/2 (4)
The detail coefficients of the fused image D (i, j) are selected from the high and low resolution images according to the following procedure:
The magnitudes of detail coefficients of high and low resolution images are calculated as follows:
M (i, j) = (D (i. j)) + (D (i. j)) (5)
M (i, j) = (D (i. j)) + (D (i. j)) (6)
Mean gradient is used as activity-level measurement such that the mean gradient (G) of the magnitudes of each details subband of both high and low resolution images is calculated as follows:
̅= ∑ ∑ ∆ ∆ (7)
where ∆ and ∆ denote the horizontal and vertical gradient of each point magnitude.
∆ = ( + 1, )− ( , ),
∆ = ( , + 1)− ( , + 1),
is the size of the subbands.
Finally the details subband with the maximum mean gradient is returned as the fused image detail subband. This is performed because a subband of higher value of mean gradient contains more detail information.
5. The fused image is obtained by performing the inverse DT-CWT using the synthesis coefficients.
IV. IMAGE QUALITY ASSESSMENT
Fused image quality refers to both the spatial and spectral quality of the fused image [14]. The goal of image fusion is to increase the spatial resolution of the MS images while preserving their spectral information contents.
A.Spectral Quality Metrics:
© 2014, IJCSMC All Rights Reserved 277
fused and original MS image bands.
B.Spatial Quality Metrics:
A good fusion method must allow the addition of a high degree of the spatial details of the high resolution PAN image to the low resolution MS image. The measures of high pass correlation coefficient (HPCC) [18] is used to assess the spatial quality of the fused images. HPCC is measured between PAN image and each band of MS image. . HPCC has a dynamic range of [-1 , 1], a higher value indicate high spatial quality of the fused image.
V. PERFORMANCE EVALUATION AND EXPERIMENTAL REsULTs
The proposed image fusion method is applied to the Quickbird and the Worldview satellite image data. The Quickbird image data was acquired with spatial resolution of 60 cm for the PAN image and 2.4 m for the MS image. The Worldview image data was acquired with spatial resolution of 50-cm for the PAN image and 2-m for the bands of the MS image. The test images of the two satellites are 1024 × 1024 pixels.
The Quickbird and the Worldview satellite images are fused using four image fusion methods. In the first method the DWT is used. In the second method CWT-Rule-1 is used in which the low-frequency coefficients of the MS image are retained as low-frequency coefficients of the fused image and the high-frequency coefficients are fused by choosing the absolute maximum. In the third method, CWT- Rule-2, the high-frequency coefficients are fused in the same manner as the CWT-Rule-1 but the low-frequency coefficients are fused by averaging. In the fourth method, the fusion is carried out according to the proposed CWT-based image fusion method.
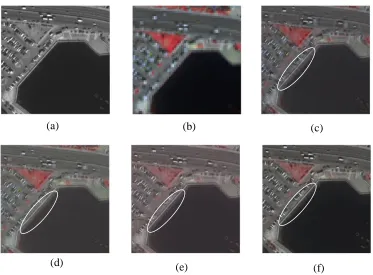
Fig. 3 (a)–(f) show the PAN and MS images of the Quickbird satellite and the fused images corresponding to the four image fusion methods explained above. The results of applying the four quality metrics described in section III are given in Table IV. The results show that the proposed method outperforms the three other methods in terms of spectral and spatial quality because preserving the MS image detail sub-bands that have maximum average gradient in the reconstruction of the fused image will enhance the spatial detail of the fused image and produce pixel values closer to that of the original MS image which in turn minimizes the spectral distortion of the fused image. Also there is a clear blurring in the edge -marked with a white boundary - of the water lake located in the lower right part of the fused image in case of CWT- rule1 and CWT-rule2. Fig. 6(a)–(f). show the PAN, MS, and fused images of Worldview satellite data. The results of the objective assessment are given in Table V. All the fused images appear quite similar. However, closer inspection shows that the fused image obtained using the proposed method has better spectral quality compared with the three other methods where blue spots appear around the vehicles -marked with a white boundary - in the lower right corner of the fused images . Table V demonstrates the results of the objective quality in which the values of spectral quality metrics corresponding to the proposed method fused image are the maximum among the other three image fusion methods.
VI.CONCLUSIONS
In this paper, an image fusion method based on the DT-CWT and the average gradient is proposed. Quickbird and Worldview remote sensing satellite image data are used for performance evaluation of applying the proposed method.
© 2014, IJCSMC All Rights Reserved 278
the results show better performance in the spectral quality only. In general the results show consistency between the visual quality of the obtained fused images and the results of their objective metrics.
TABLE III
THE RESULTS OF SPATIAL AND SPECTRAL QUALITY ASSESSMENT(QUICKBIRD IMAGES).
Fusion
method R G B R G B R G B R G B
DWT 0.880 0.885 0.851 0.826 0.804 0.797 0.114 0.118 0.109 0.135 0.142 0.130 CWT
Rule1 0.738 0.755 0.697 0.835 0.835 0.820 0.116 0.115 0.107 0.136 0.134 0.125 CWT
Rule2 0.756 0.764 0.712 0.853 0.841 0.831 0.114 0.111 0.105 0.133 0.131 0.124
Proposed
method 0.964 0.974 0.954 0.897 0.889 0.876 0.087 0.090 0.084 0.113 0.116 0.111
Fig. 5. Quickbird data : (a) PAN image ; (b) MS image ; (c) fused image of DWT method; (d) fused image of CWT Rule 1; (e) fused image of CWT Rule 2;
(f) fused image of proposed CWT method.
(c) (b)
(a)
(e) (f)
© 2014, IJCSMC All Rights Reserved 279
Fig. 5. QuickBird data : (a) PAN image ; (b) MS image ; (c) fused image of DWT method; (d) fused image of CWT Rule 1; (e) fused image of CWT Rule 2;
(f) fused image of proposed CWT method.
Fusion
method R G B R G B R G B R G B
DWT 0.955 0.968 0.965 0.924 0.907 0.903 0.063 0.057 0.058 0.077 0.072 0.074
CWT
Rule1 0.954 0.957 0.951 0.936 0.923 0.924 0.052 0.051 0.051 0.065 0.066 0.067 CWT
Rule2 0.948 0.952 0.946 0.935 0.923 0.909 0.052 0.058 0.063 0.067 0.071 0.078
Proposed
method 0.940 0.949 0.947 0.946 0.941 0.928 0.043 0.042 0.046 0.063 0.062 0.069
(b)
(a) (c)
(f) (e)
© 2014, IJCSMC All Rights Reserved 280
REFERENCES
[1] C. Pohl, and V. Genderen, “Multisensory image fusion in remote sensing: concepts, methods and application”, Int journal of remote sensing, vol. 19, pp.823- 854. 1998.
[2] S.Mallat , “A theory for multiresolution signal decomposition: the wavelet representation.” Pattern Analysis and Machine Intelligence, IEEE Transactions on, vol. 11, pp. 674-69. 1998.
[3] S. Ioannidou, and V. Karathanassi , “Investigation of the dual-tree complex and shift-invariant discrete wavelet transforms on Quickbird image fusion. ” Geoscience and Remote Sensing Letters, IEEE, vol 4, pp. 166-170. 2007.
[4] N. G. Kingsbury, “The dual-tree complex wavelet transform: a new technique for shift invariance and directional filters. ” Proc. 8th IEEE DSP Workshop, 1998.
[5] T. Celik, and K.-K. Ma, “Unsupervised change detection for satellite images using dual-tree complex wavelet transform. ” Geoscience and Remote Sensing, IEEE Transactions on , vol48, pp. 1199-1210. 2010.
[6] H. Ma,C. Jia, et al, “Wavelet-based PAN and multispectral image fusion. ” Proceeding of the 6th World Congress on Intelligent Control and Automation, 2006.
[7] A. Lavanya, K.Vani, S. Sanjeevi, and R.S. Kumar, “Image fusion of the multi-sensor lunar image data using wavelet combined transformation.” International Conference on Recent Trends in Information Technology(ICRTIT), pp. 920 - 925. 2011.
[8] X. Qing, X. Shuai, et al., “Complex Wavelets and its Application to Image Fusion. ” XXth ISPRS Congress Technical Commission III, 2004
[9] Q. Zhang, Z. Ma, and L. Wang, “Multimodality Image Fusion by Using Both Phase and Magnitude Information. ” Pattern Recognition Letters, vol. 34, pp. 185-193, 2013.
[10] J. J. Lewis, R. J. O'Callaghan, S. G. Nikolov, D. R. Bull, and N.
Canagarjah, “Pixel- and Region-based Image Fusion with Complex Wavelets.” Information Fusion, vol. 8, pp. 119-130, 2007.
[11] S. Li, B. Yang, and J. Hu, “Performance Comparison of Different Multi-Resolution Transforms for Image Fusion.” Information Fusion, vol. 12, pp. 74-84, 2011.
[12] H. Demirel, and G. Anbarjafari, “Satellite Image Resolution
Enhancement Using Complex Wavelet Transform.” Geoscience and Remote Sensing Letters, vol. 7, January 2010.
[13] M. Victor, and P. Ales, “Complex Wavelet Transform in Signal and Image Analysis. ”14th International Scientific - Technical conference on Process Control, Czech Republic June 2004. [14] Z. Wang, S. Li, Q. Cai, S. SU, M. Liu, “Multi-spectrum Image Fusion Algorithm Based on Weighted
and Improved Wavelet Transform.” IEEE International Conference on Intelligent Computing and Intelligent Systems. vol. 4, pp. 63-66, 2009.
[15] Z. Wang and A.C.Bovik, “A Universal Image Quality Index.”IEEE Signal Processing Letters, vol. 9, pp. 81-84, March 2002 .
[16] Z. Zhenhua, Z. Jing, and X. yang, “Color Transform Based Remote Sensing Image Fusion Using Non-Separable Wavelet Frame Transform.” Pattern Recognition Letters, vol. 26, 2005.
[17] R. S. Blum, and Z. Liu , “Multi-sensor image fusion and its applications.” CRC press, New York 2005.
![Fig. 1. Dual tree complex wavelet as implemented by N. kingsbury in [4]](https://thumb-us.123doks.com/thumbv2/123dok_us/1998639.1264624/3.612.168.447.97.268/fig-dual-tree-complex-wavelet-implemented-n-kingsbury.webp)