Scholarship@Western
Scholarship@Western
Electronic Thesis and Dissertation Repository
12-5-2018 10:00 AM
Applications of CT Perfusion-Based Triaging and Prognostication
Applications of CT Perfusion-Based Triaging and Prognostication
in Acute Ischemic Stroke
in Acute Ischemic Stroke
Eric A. Wright
The University of Western Ontario
Supervisor Lee, Ting Y
The University of Western Ontario
Graduate Program in Medical Biophysics
A thesis submitted in partial fulfillment of the requirements for the degree in Doctor of Philosophy
© Eric A. Wright 2018
Follow this and additional works at: https://ir.lib.uwo.ca/etd Part of the Medical Biophysics Commons
Recommended Citation Recommended Citation
Wright, Eric A., "Applications of CT Perfusion-Based Triaging and Prognostication in Acute Ischemic Stroke" (2018). Electronic Thesis and Dissertation Repository. 5888.
https://ir.lib.uwo.ca/etd/5888
This Dissertation/Thesis is brought to you for free and open access by Scholarship@Western. It has been accepted for inclusion in Electronic Thesis and Dissertation Repository by an authorized administrator of
i
CT Perfusion (CTP) is a minimally invasive imaging technique that aids acute ischemic
stroke (AIS) triage and prognostication by determining tissue viability based on hemodynamic
parameters. The goals of this research are to determine: 1) CTP thresholds for estimation of
infarct and penumbra volume, 2) how CTP scan duration impacts infarct and penumbra volume
estimates, and 3) reliability of CTP for predicting functional outcomes following intra-arterial
therapy (IAT).
Chapter 2 introduced an experimental study for determining ischemia-time dependent
thresholds for brain infarction using multimodal imaging in a porcine stroke model that is
easier to implement than previous large animal stroke models. CTP determined an absolute
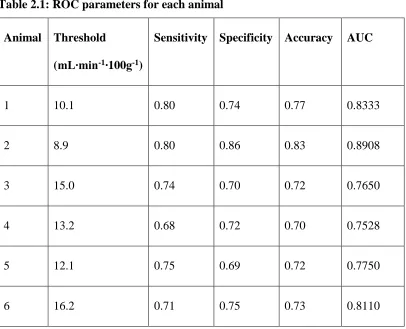
cerebral blood flow (CBF) threshold of 12.6±2.8mL∙min-1∙100g-1 for brain infarction after 3h
of ischemia, which was close to that derived using hydrogen clearance in a previous study by
Jones et al (Journal of Neurosurgery, 1981;54(6):773-782).
Chapter 3 retrospectively investigated the impact of CTP scan duration on cerebral
blood volume (CBV), CBF, and time-to-maximum (Tmax) and found optimal scan durations
that minimized radiation dose while not under- or over-estimating infarct volumes measured
using two previously derived CBF thresholds for infarction. We found that CBV and Tmax
decreased at shorter scan durations, whereas CBF was independent of scan duration,
consequently, infarct volume estimated by both CBF thresholds was independent of scan
ii
Chapter 4 compared reperfusion seen on follow-up CTP to reperfusion predicted by
post-IAT digital subtraction angiography (DSA) and the ability of the two modalities to predict
good 90-day functional outcome in a retrospective study. We found that patients with
‘complete reperfusion’ grades on DSA often had ischemic tissue on follow-up CTP and that
follow-up CTP had superior specificity and accuracy for predicting functional outcome
compared to DSA.
In summary, this research has shown that CBF thresholds can reliably detect infarct in
AIS and are independent of scan duration, allowing radiation dose to be minimized by limiting
scans to 40s without compromising accuracy of infarct volume estimates. Finally, CTP is a
more specific and accurate predictor of functional outcome than the commonly used
post-procedural DSA, this could help select patients for neuroprotective therapy.
Keywords
Stroke, cerebral ischemia, computed tomography, computed tomography perfusion, functional
iii
Co-Authorship Statement
Chapter two was adapted from an original research manuscript entitled “Absolute
cerebral blood flow infarction threshold for 3-hour ischemia time determined with CT
Perfusion and 18F-FFMZ-PET imaging in a porcine model of cerebral ischemia” published in
PLoS One 11(6): e0158157, June 2016, by E.A. Wright, C.D. d’Esterre, L.B. Morrison, N.
Cockburn, M. Kovacs, and T.Y. Lee. The study was designed by T.Y. Lee and myself with
contributions from C.D. d’Esterre. I was responsible for performing the experiments with help
from L.B. Morrison. For each experiment, N. Cockburn and M. Kovacs produced the 18
F-FFMZ required for PET imaging of tissue viability. I also collected and analyzed the data and
wrote the manuscript under the supervision of T.Y. Lee. All authors reviewed and edited the
manuscript.
Chapter three was adapted from an original research manuscript entitled “Impact of
truncation artifacts on CT Perfusion-derived CBV, CBF, and time-to-maximum measurements
in ischemic stroke patients” submitted to American Journal of Neuroradiology by E.A. Wright,
C.D. d’Esterre, L. Hur, C. McDougall, M. Horn, M. Najm, M. Goyal, B.K. Menon, and T.Y.
Lee. The study was designed by T.Y. Lee and myself with contributions from C. D. d’Esterre.
The patient studies were provided by M. Goyal, and B.K. Menon. L. Hur, C. McDougall, M.
Horn and M. Najm processed the patient studies to generate CT Perfusion maps using a
pre-defined protocol. I verified that CT Perfusion maps were correct (visual assessment, verified
that arterial input function and venous output function were measured appropriately, etc.) and
performed post-processing to abstract data from the maps, performed all data analysis and
wrote the manuscript under the supervision of T.Y. Lee. The manuscript was reviewed and
iv
Chapter four was adapted from an original research manuscript entitled “Reperfusion
assessed by CT Perfusion is a more specific and accurate predictor of functional outcome than
modified thrombolysis in cerebral infarction score in ischemic stroke patients treated with
intra-arterial therapy” submitted to Radiology by E.A. Wright, E. Fainardi, A. Bernardoni, C.D.
d’Esterre, M. Goyal, B.K. Menon, and T.Y. Lee. The study was designed by E. Fainardi and
T.Y. Lee with contribution from myself. E. Fainardi and A. Bernardoni recruited patients and
assessed admission CT angiography for all patients. I was responsible for computation of CT
Perfusion maps, post-processing to abstract data from maps, analyzing all data, and writing the
manuscript under the supervision of T.Y. Lee. All authors reviewed and revised the
v
Acknowledgments
First and foremost, I would like to acknowledge my supervisor, Dr. Ting-Yim Lee. He
allowed me to have a great deal of independence to forge my own path, but was also always
available when I needed guidance, ready to help with his seemingly encyclopedic knowledge
of CT Perfusion. I have learned an immense amount and grown as a person under his
supervision, and I cannot thank him enough for his mentorship and support throughout my
time in graduate school. I would also like to thank the members of my advisory committee,
Dr. Keith St. Lawrence and Dr. Michael Kovacs.
I would like to thank Dr. Christopher d’Esterre from the University of Calgary, who
was always available to offer valuable insight and encouragement, as well as Dr. Enrico
Fainardi from the University of Florence for all his help with the study which comprises the
4th chapter of this thesis.
I would also like to express my deep gratitude to Laura Morrison. To say that my
animal experiments would have been impossible without her would be an understatement. I
will always be grateful for her hard work, and attention to detail, both of which were key to
making those experiments a success. My thanks also go to Jennifer Hadway and Lise
Desjardins, who were always available whenever I needed help or had questions in the lab.
My sincere appreciation must also be expressed to Anne Leaist. It would have been
immeasurably harder to focus on my work without her help with conference expenses, stipend
issues, and all other administrative matters. I also would like to thank all other current, and
former members of the Lee Lab whose time in the lab overlapped with mine. All the interesting
vi
presentations was very much appreciated. Thank you all for creating a warm atmosphere that
always made coming into the lab enjoyable.
I would also like to send out my heartfelt thanks to my parents Sandra and Bruce for
their constant encouragement, and frequent weekend trips to London to visit. Finally, thank
you to my long-time girlfriend Joanna, for her love, support, and patience, and for always
keeping me grounded through all the highs and lows that have come over the last five years. I
vii
Table of Contents
Abstract ... i
Co-Authorship Statement... iii
Acknowledgments... v
Table of Contents ... vii
List of Tables ... xi
List of Figures ... xii
List of Appendices ... xiv
List of Abbreviations ... xv
Chapter 1 ... 1
1 Introduction ... 1
1.1 Stroke Pathophysiology ... 2
1.1.1 Cerebral Ischemia ... 2
1.1.2 Tissue Subtypes in Ischemic Stroke ... 6
1.2 Treatment of Ischemic Stroke ... 8
1.2.1 Thrombolytic Therapy ... 9
1.2.2 Mechanical Thrombectomy ... 12
1.3 Medical Imaging in Ischemic Stroke ... 17
1.3.1 Positron Emission Tomography ... 17
1.3.2 Magnetic Resonance Imaging ... 20
1.3.3 Computed Tomography ... 24
1.4 Animal Models of Ischemic Stroke ... 40
1.5 Future Diagnosis and Treatment of Stroke ... 42
1.6 Research Objectives ... 44
viii
Chapter 2 ... 86
2 Absolute Cerebral Blood Flow Infarction Threshold for 3-hour Ischemia Time Determined with CT Perfusion and 18F-FFMZ-PET Imaging in a Porcine Model of Cerebral Ischemia... 86
2.1 Introduction ... 86
2.2 Methods... 88
2.2.1 Acute Cerebral Ischemia Model ... 88
2.2.2 On-line CBF Monitoring with CT Perfusion ... 89
2.2.3 18F-FFMZ-PET Imaging for Detecting Cerebral Infarction ... 90
2.2.4 Data Analysis ... 91
2.3 Results ... 94
2.4 Discussion ... 101
2.5 Conclusion ... 104
2.6 References ... 105
Chapter 3 ... 110
3 Impact of Truncation Artifacts on CT Perfusion-derived CBV, CBF, and Time-to-Maximum Measurements in Ischemic Stroke Patients ... 110
3.1 Introduction ... 110
3.2 Methods... 113
3.2.1 Patients ... 113
3.2.2 Image Acquisition ... 114
3.2.3 CTP Postprocessing ... 114
3.2.4 Image Analysis... 115
3.2.5 Statistical Analysis ... 116
3.3 Results ... 117
3.3.1 Patients ... 117
ix
3.3.3 Threshold-derived Infarct Volumes ... 120
3.4 Discussion ... 123
3.5 Conclusion ... 127
3.6 References ... 127
Chapter 4 ... 132
4 Reperfusion Assessed by CT Perfusion is a More Specific and Accurate Predictor of Functional Outcome than Modified Thrombolysis in Cerebral Infarction Score in Ischemic Stroke Patients Treated with Intra-Arterial Therapy ... 132
4.1 Introduction ... 132
4.2 Methods... 133
4.2.1 Patient Selection... 133
4.2.2 Imaging Protocol ... 135
4.2.3 Image Analysis... 136
4.2.4 Statistical Analysis ... 138
4.3 Results ... 139
4.3.1 Comparison of mTICI Scores to SCTP ... 139
4.3.2 Comparison of mTICI Scores to SCTP for Predicting Functional Outcome ... 143
4.4 Discussion ... 152
4.5 References ... 155
Chapter 5 ... 161
5 Conclusions and Future Work ... 161
5.1 Summary ... 161
5.1.1 Development of Porcine AIS Model and Derivation of 3h CBF Threshold for Infarction ... 161
5.1.2 Assessment of Scan Duration Effect on Quantitative CTP Results ... 162
x
5.2 Experimental and Clinical Impact ... 165
5.3 Future Work ... 166
5.3.1 Deriving CBF Thresholds for a Greater Range of Ischemia Durations .. 166
5.3.2 Using PS to Identify Patients at Increased Risk of Hemorrhagic Transformation ... 169
5.3.3 Assessment of Post-IAT Reperfusion using ‘DSA Perfusion’ Maps ... 171
5.4 Conclusion ... 173
5.5 References ... 173
Appendices ... 176
xi
List of Tables
Table 2.1: ROC parameters for each animal ... 100
Table 3.1: Average ± S.E. tissue volumes specified by CBF thresholds ... 122
Table 4.1: Demographic, clinical and imaging characteristics of the 96 patients included in the study ... 144
Table 4.2: Logistic regression for predicting 90-day functional outcome based on SCTP and
xii
List of Figures
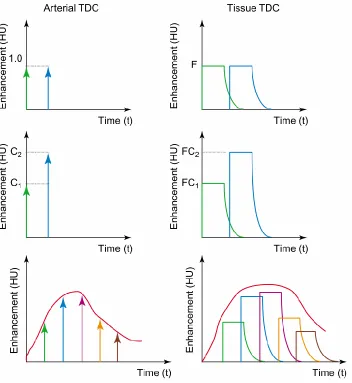
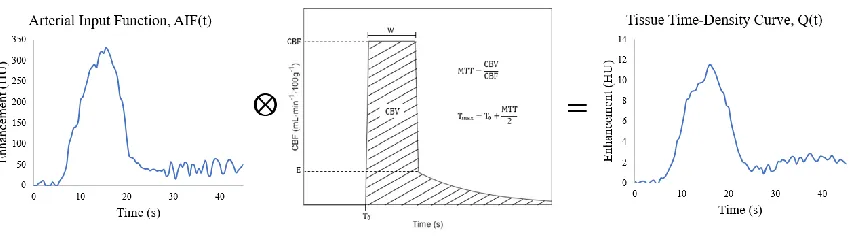
Figure 1.1: The concept of deconvolution applied to CT Perfusion ... 31
Figure 1.2: Graphical representation of CTP deconvolution equation ... 33
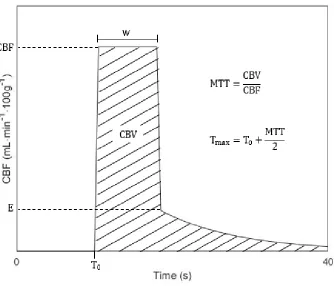
Figure 1.3: Sample IRF ... 35
Figure 2.1: Image analysis method ... 93
Figure 2.2: Average relative CBF of infarct ROIs ... 95
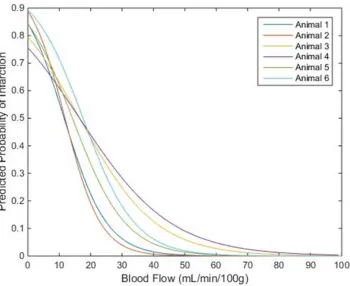
Figure 2.3: Predicted probability of infarction versus CBF ... 97
Figure 2.4: ROC curves for each animal ... 99
Figure 3.1: Truncation of ischemic tissue TDCs ... 112
Figure 3.2: Median CBV, CBF, and Tmax versus scan duration in infarct, ipsilateral non-infarct, and contralateral ROIs ... 119
Figure 3.3: Confidence intervals and range of volume differences relative to 150s scan for CBF<7 mL∙min-1∙100g-1 and 7<CBF<13 mL∙min-1∙100g-1 ... 121
Figure 4.1: Patient exclusion flow chart ... 134
Figure 4.2: Mean SCTP at each level of post-procedural mTICI score ... 140
Figure 4.3: Ischemic lesion on 24h follow-up Tmax map for patient with post-procedural mTICI score of 3 ... 142
Figure 4.4: ROC curves for predicting good functional outcome based on SCTP and post-procedural mTICI score ... 149
Figure 4.5: Sensitivity, specificity, accuracy, PPV, and NPV for regression model, SCTP > 81.5% and mTICI 2b/3 for predicting functional outcome ... 151
xiii
Figure 5.2: Elevated PS in patient with hemorrhagic transformation after IAT ... 170
xiv
List of Appendices
Appendix A: Supplementary Figures for Chapter 2 ... 176
Appendix B: Animal Ethics Approval for the work contained in Chapter 2 ... 183
Appendix C: Ethics Approval for the work contained in Chapter 3 ... 184
xv
List of Abbreviations
ACA Anterior cerebral artery
AIF Arterial input function
AIS Acute ischemic stroke
ASPECTS Alberta Stroke Program Early CT Score
ATP Adenosine triphosphate
BBB Blood-brain barrier
BV Blood volume
Ca(t) Arterial contrast concentration versus time curve
CBF Cerebral Blood Flow
CT Computed tomography
CTA Computed tomography angiography
CTP Computed tomography perfusion
DCE-MRI Dynamic contrast-enhanced magnetic resonance imaging
DSC-MRI Dynamic susceptibility contrast magnetic resonance imaging
DSA Digital subtraction angiography
DWI Diffusion weighted imaging
ECASS European Cooperative Acute Stroke Study
ET-1 Endothelin-1
xvi
FDA Food and Drug Administration
FFMZ Fluoroethylflumazenil
FLAIR Fluid-attenuated inversion recovery
FMZ Flumazenil
GRE Gradient recalled echo
HU Hounsfield Unit
IA Intra-arterial
IAT Intra-arterial therapy
ICA Internal carotid artery
ICH Intracerebral hemorrhage
IQR Interquartile range
IRF Impulse residue function
IV Intra-venous
LVO Large vessel occlusion
MCA Middle cerebral artery
MERCI Mechanical Embolus Removal in Cerebral Ischemia
MRA Magnetic resonance angiography
MRI Magnetic resonance imaging
mRS Modified Rankin scale
xvii
MTT Mean transit time
NCCT Non-contrast CT
NIHSS National Institutes of Health Stroke Scale
NINDS National Institute of Neurological Disorder and Stroke
PET Positron emission tomography
PS Permeability-surface area product
PWI Perfusion-weighted imaging
Q(t) Tissue contrast concentration versus time curve
RAPID RApid processing of PerfusIon and Diffusion
RF(t) Flow-scaled impulse residue function
rLMC Regional leptomeningeal collateral
ROI Region of interest
R(t) Impulse residue function
SCTP Reperfusion score
SWI Susceptibility-weighted imaging
T0 Arrival time
TDC Time-density curve
Tmax Time-to-maximum
TNK Tenecteplase
xviii
t-PA Tissue plasminogen activator
u-PA Urokinase
Chapter 1
1
Introduction
Stroke is the second leading cause of death, and third leading cause of disability
worldwide1 according to the World Health Organization. Overall, stroke mortality rates
have declined over the last 30 years in the United States2, and Canada3, but incidence
rates remain higher in certain racial4, and gender cohorts5, and in certain geographical
areas6. The decline in overall stroke mortality rate is due to a decrease in the number of
fatal strokes7, rather than a decrease in stroke incidence, which is projected to more than
double over the next 30 years, with most of the increase coming from people aged 75
years or older8. Approximately half the survivors of stroke are institutionalized or
disabled within 5 years9, and due to the aging population, the number of individuals
living with disability resulting from stroke is projected to almost double in the next 2
decades10. Long term care for these patients will further increase the socioeconomic
burden of cerebrovascular disease11. CT Perfusion (CTP) is a minimally invasive
imaging technique that produces quantitative maps of hemodynamic parameters which
can be used to assess tissue viability. CTP could improve outcomes after stroke by
allowing triaging based on each patients’ brain tissue viability, allowing the optimal
treatment to be selected on an individualized basis. Post treatment CTP is not commonly
performed but could also be used to improve prognostication by quantitatively assessing
reperfusion of ischemic tissue. The goals of this research are to determine: 1) CTP
thresholds for estimation of infarct and penumbra volume, 2) how CTP scan duration
impacts infarct and penumbra volume estimates, and 3) the prognostic utility of CTP for
future socioeconomic burden of cerebrovascular disease, CTP-based acute treatment and
patient-specific triaging and management must be improved to reduce the proportion of
stroke patients living with severe disability following their stroke.
1.1
Stroke Pathophysiology
Stroke is caused by a reduction in blood flow to the brain and can be divided into
two broad categories. Hemorrhagic strokes are caused by leakage from damaged cerebral
blood vessels, and ischemic strokes are caused by blockage of an artery supplying the brain
tissue. This thesis deals only with ischemic stroke and not hemorrhagic stroke. Studies
suggest that the overall annual incidence of first-ever stroke in North America is 189 per
100,000 people, with ischemic strokes accounting for ~85% of the total incidence12.
Approximately 30% of ischemic stroke patients die within 3 months of the stroke13, and
~45% of survivors will not be able to live independently14.
1.1.1
Cerebral Ischemia
Cerebral ischemia is a condition where restricted cerebral blood flow (CBF) leads
to insufficient supply of oxygen and glucose to meet the metabolic demands of brain tissue.
Cerebral ischemia can be global, such as when cardiac arrest or open-heart surgery results
in complete cessation of systemic blood flow, or focal, where CBF is reduced in one region
of the brain15. There are multiple arterial etiologies of focal cerebral ischemia. The most
common are thrombosis in situ, clot formation in a cerebral artery due to endothelial injury
triggering the coagulation cascade; and thromboembolism, where emboli travel to cerebral
vessels through the blood after rupture of a thrombus or atherosclerotic plaque elsewhere
during atrial fibrillation, or from coagulation following open heart surgery. Sustained
hypertension can lead to fibrinoid deposits within cerebral arterioles, which is often
associated with lacunar infarction16. Ischemia in tissue supplied by the distal part of the
cerebral vascular tree is referred to as watershed stroke. Watershed stroke is usually caused
by decreased mean arterial pressure in the internal carotid arteries (ICA) due to myocardial
dysfunction, systemic hypotension, or ICA stenosis17.
The trial of Org 10172 in acute stroke treatment (TOAST)18 established a
classification system which denoted five subtypes of ischemic stroke: large-artery
atherosclerosis, cardioembolism, small-vessel occlusion, stroke of other determined
etiology, and stroke of undetermined etiology19. Strokes of different subtypes (as identified
by TOAST criteria) can have varying clot composition, size, and density, which can impact
stroke severity and response to acute treatment20,21. Regardless of vascular etiology,
reduced delivery of oxygen and glucose due to reduced CBF results in inadequate
production of adenosine triphosphate (ATP) by cellular respiration. Neuronal cells require
ATP for active, facilitated transport of Na+, K+ and other ions to maintain their resting
membrane potential, and for action potential propagation. Intracellular ATP stores are
exhausted within minutes post ictus, leading to loss of ionic homeostasis22, this is the first
step in a complex ‘ischemic cascade’ which ultimately leads to cell death caused mainly
by excitotoxicity, Ca2+ dysregulation, and oxidative/nitrative stress.
Anoxic depolarization due to influx of Na+, and failure of normal reuptake
mechanisms causes excessive accumulation of the excitotoxic neurotransmitter, glutamate,
in the extracellular space23. This leads to overstimulation of ionotropic glutamate
of intracellular Ca2+ is further exacerbated by other anion channels activated during
ischemia24–26, and failure of normal Ca2+ efflux mechanisms, such as the Na+/Ca2+
exchanger27. Influx of Ca2+ activates proteases, lipases, and nucleases28, and also leads to
increased production of reactive oxygen species29. These factors can trigger release of Ca2+
from the endoplasmic reticulum, as well as reactive oxygen species and enzymes from the
mitochondria30, further accelerating the death spiral. Continued build-up of metabolic,
oxidative, and nitrative stressors eventually lead to cell death by necrosis or apoptosis.
Glutamate excitotoxicity also expands the ischemic injury at a macroscopic level by
causing cortical spreading depolarization, where elevated extracellular glutamate and K+
cause slowly propagating depolarization of surrounding neurons and astrocytes, and
disruption of ionic gradients31. Disruption of ionic gradients, and mismatch between
reduced CBF and high metabolic demand to support membrane repolarization lead to
expansion of the initial ischemic injury32.
Cerebral blood vessels are separated from brain tissue by a selectively permeable
barrier called the blood-brain barrier (BBB) which tightly regulates the passage of
molecules between the blood and brain tissue. The BBB consists of endothelial cells,
astrocytic end-feet, pericytes and a basement membrane. Tight junctions between adjacent
endothelial cells and astrocytic end-feet form a physical barrier, allowing lipophilic
molecules and metabolic products to cross by passive diffusion, and preventing diffusion
of hydrophilic molecules, and potential neurotoxins33. Pericytes embedded in the basement
membrane envelope the endothelial cells interact closely with them and play a role in
maintaining and regulating BBB function34. Prolonged ischemia triggers several responses
pericytes to detach from endothelial cells, disrupting intercellular signalling interactions
which results in blood-borne substances entering the brain via increased endothelial
transcytosis35. Ischemia also degrades tight junctions between endothelial cells, allowing
molecules to travel out of the blood via paracellular diffusion36, and causes astrocytes to
retract their end-feet and release pro-inflammatory cytokines37. The longer the duration of
ischemia, the more severe the BBB breakdown and inflammatory response. This in turn
increases the likelihood of blood extravasation if the ischemic tissue is eventually
reperfused, a process known as hemorrhagic transformation of cerebral infarction.
Furthermore, hyperglycemia caused by diabetes mellitus is known to worsen BBB
breakdown, in addition to enhancing atherosclerosis, arterial stiffness, oxidative stress, and
systemic inflammation38. As a result, patients with diabetes mellitus are more likely to
have ischemic strokes, and also have higher rates of hemorrhagic transformation39 and
mortality 90 days post stroke40.
Tissue fate in ischemic stroke is time dependent (this will be detailed in the next
subsection); tissue remains viable after symptom onset, but ~1.9 million neurons become
irreversibly damaged every minute that stroke symptoms persist41. Treatment for acute
ischemic stroke (AIS) revolves around salvaging viable ischemic tissue by restoring normal
perfusion to the affected region as quickly as possible. However, restoring CBF to
ischemic tissue regions with a potentially compromised BBB can lead to hemorrhagic
transformation. For this reason, decisions surrounding the treatment of AIS are often
determined by weighing the potential benefits of reperfusion, which declines over time42,43,
1.1.2
Tissue Subtypes in Ischemic Stroke
In neuronal cells, the energy requirements, and by extension the CBF requirements,
for signal transduction (action potential propagation and neurotransmission) and
maintaining morphological integrity are different44. Consequently, tissue affected by focal
ischemia in the acute phase of ischemic stroke can be classified into distinct categories
based on blood flow thresholds. Studies show there are two critical thresholds of decreased
CBF: a threshold for reversible functional failure, and a lower threshold for irreversible
morphological damage45.
Tissue in the central, most hypoperfused region, with CBF below the threshold for
irreversible damage, is termed the infarct core. The definition of infarct core was originally
based on substantial increases in extracellular K+ concentration seen in baboons when CBF
was reduced by occlusion of the middle cerebral artery (MCA)45,46. Increased extracellular
K+ is a marker of anoxic depolarization, one of the early steps in the ischemic cascade
which ultimately leads to necrosis or apoptosis, therefore the infarct core is irreversibly
damaged and no longer viable, even with reperfusion. In cases where cerebral circulation
is completely arrested (e.g. cardiac arrest) brain infarction can occur within minutes, but
when cessation of blood flow is not complete the time it takes for infarction to occur
depends on the level of residual CBF. Experiments in animal models established that for
1 to 2 hours of ischemia, tissue with CBF less than 8-10 mL∙min-1∙100g-1 will become
infarcted47,48.
The tissue surrounding the infarct core, with CBF below the threshold for functional
failure, but above the threshold to induce acute infarction, is termed the penumbra. The
affected at a higher CBF level than the threshold for increased extracellular K+ in a baboon
model of focal ischemia45,46. Clinical49 and animal studies50,51 show that the CBF threshold
for functional impairment ranges from 15-20 mL∙min-1∙100g-1, depending on the species
and measurement method used. Tissue with CBF between the thresholds for functional
impairment and acute infarction will remain salvageable if normal blood flow is restored
promptly. As mentioned previously, the window for tissue viability before infarction
becomes inevitable depends on the level of residual blood flow and the duration of
ischemia52. The threshold for infarction after 1 hour of ischemia is ~8 mL∙min-1∙100g-1, if
ischemia persists for 3 hours the infarction threshold rises to ~12 mL∙min-1∙100g-147,48, if
normal CBF is not restored and ischemia persists indefinitely, then all penumbral tissue
will eventually progress to infarction48.
Lastly, tissue with CBF that is lower than normal levels but still above the threshold
for functional impairment is termed benign oligemia45. Despite hypoperfusion, this tissue
does not progress to infarction, regardless of the duration of ischemia, and is therefore not
as clinically important as infarct or penumbra.
The human brain is composed of two distinct types of tissue, gray and white matter.
Gray matter mainly consists of neuronal cell bodies, unmyelinated axons, glial cells and
synapsesand is found in the cerebral cortex, thalamus, hypothalamus, and basal ganglia.
White matter consists of myelinated axons, and glial cells and connects various gray matter
regions together, allowing neuronal signals to be conducted through the brain quickly53.
Resting CBF is lower in white matter (20-25 mL∙min-1∙100g-1) than gray matter (50-60
mL∙min-1∙100g-1)54 because white matter consumes only about one third of the energy
absence of synapses55. Since white matter has a lower energy demand and perfusion level,
it follows that CBF thresholds for infarction and electrical silence are also lower than in
gray matter for a given ischemia duration. Clinical studies have confirmed that the CBF
threshold for infarction in gray matter is significantly higher than in white matter for similar
ischemia durations56. Therefore, using the same infarction thresholds for both white and
gray matter may overestimate the volume of infarcted white matter56.
1.2
Treatment of Ischemic Stroke
Treatment of AIS was limited to medical management and basic life support until
the introduction of thrombolytic therapy in 199657. Current treatment of AIS is based on
recanalization of the occluded artery to restore CBF to ischemic tissue. There are two
approved treatment options: thrombolytic therapy – which works by dissolving the clot via
fibrinolysis, and mechanical thrombectomy – an interventional procedure where the clot is
mechanically removed using a specialized catheter58. Regardless of what treatment is used,
initiating therapy as soon as AIS is diagnosed by imaging is crucial for maximizing
penumbral salvage and lessening the risk of hemorrhagic transformation or other
complications42,43. Current clinical guidelines suggest implementing protocols such as
pre-arrival hospital notification of incoming patients with possible AIS59, or using telemedicine
to accelerate image interpretation for rural centers without a neuroradiologist on site60, to
minimize the delay between hospital admission and initiation of treatment (referred to as
‘door-to-needle time’). The goal of implementing such protocols is to perform CT within
20 minutes of admission and keep door-to-needle times less than 60 minutes in at least
1.2.1
Thrombolytic Therapy
Thrombus formation (thrombosis) and dissolution (thrombolysis) are complex
interconnected processes. Thrombosis starts when platelets are activated by contact with
sub-endothelial proteins62. Activated platelets trigger a series of protease-mediated
cleavages which ultimately ends with the serine protease thrombin cleaving soluble
fibrinogen into insoluble fibrin63. Fibrin polymerizes to form the bulk of the blood clot
along with activated platelets, red blood cells, and white blood cells64. This clotting
cascade prevents excessive blood loss from damaged blood vessels but can also lead to
thromboembolic stroke when clots form in cerebral arteries, or travel to cerebral arteries
from elsewhere in the body. Clot dissolution is mediated by endogenous fibrinolysis,
which relies on the formation of plasmin, a fibrinolytic enzyme, from its precursor
plasminogen. This conversion is catalyzed by a group of enzymes called plasminogen
activators65. Thrombolytic therapy involves administering drugs that are either
recombinant versions of endogenous plasminogen activators (e.g. tissue plasminogen
activator (t-PA) or urokinase-plasminogen activator (u-PA)), or exogenous plasminogen
activating agents (e.g. streptokinase), that enhance plasmin-mediated fibrinolysis65. The
likelihood of early recanalization and good outcome after IV thrombolysis is dependent on
the clot fibrin content66, and its length and density on CT67,68. Early vessel recanalization
and good functional outcome are also more likely in cardioembolic strokes compared to
other stroke subtypes69,70. A significant drawback to thrombolysis is that degradation of
fibrin and fibrinogen inhibits the coagulation cascade71, and therefore increases the risk of
intracerebral hemorrhage (ICH)72. Additionally, in patients with compromised BBB due
effects that can enhance excitotoxicity and further damage the BBB73. For this reason,
primary ICH must be ruled out by computed tomography (CT) or magnetic resonance
imaging (MRI) before initiating thrombolysis74.
The first clinical trial to show a significant benefit of thrombolytic therapy was the
National Institute of Neurological Disorders and Stroke (NINDS) trial in 1995. Alteplase,
a recombinant version of t-PA was administered intravenously within 3 hours of symptom
onset, in patients with no evidence of ICH on CT. The percentage of patients with excellent
outcome (assessed as a score of 0 or 1 on the modified Rankin Scale (mRS)) in the t-PA
group was 43% compared to only 26% in the control group, and 90 day mortality was also
lower in the t-PA group, despite increased risk of ICH (6.4% vs 0.6%)57. Based on these
results, the United States Food and Drug Administration (FDA) approved IV t-PA for the
treatment of AIS within 3 hours post symptom onset. Phase IV trials in Canada75 and
Europe76 would later confirm the efficacy of IV t-PA in routine care settings, showing that
rates of excellent outcome (mRS ≤ 1) (~38%), mortality within 90 days (11% to 22%), and
symptomatic ICH (~6%) were all similar to pooled results from randomized controlled
trials.
In the decade after FDA approval, administration rates of IV t-PA remained as low
as 0.9% to 2.4%77,78, with the 3 hour time window posing a significant barrier to
treatment79. Multiple trials comparing placebo to IV t-PA given within the first 6 hours
post onset80,81, or in the 3 to 5 hour time window82, failed to show a significant
improvement in functional outcome, and had higher rates of symptomatic ICH in the
treatment group. Meta-analysis of pooled data from six randomized controlled trials of IV
increased, but there was still a significant benefit in the 3 to 4.5 hour time window83.
Efficacy of IV t-PA given within 3 to 4.5 hours post onset was confirmed in the European
Cooperative Acute Stroke Study (ECASS) III trial, which found significantly higher rates
of excellent functional outcomes (52 vs 45% in the control group) in the IV t-PA group,
and similar mortality rates despite increased risk symptomatic ICH84. Administration of
IV t-PA remains a frontline therapy for AIS patients, but the time window still presents a
major barrier to treatment; studies suggest up to 67% of patients not receiving thrombolysis
are deemed ineligible because of the time window85.
Current clinical guidelines suggest administering IV t-PA within 4.5 hours of
symptom onset, at a dosage of 0.9 mg/kg, with the first 10% of the dose given as a bolus58,
although a dosage of 0.6 mg/kg may result in similar improvement in functional outcome
with lower rates of symptomatic ICH86. Patients can be treated regardless of age, or
admission stroke severity (assessed by the National Institute of Health Stroke Scale or
NIHSS), provided admission non-contrast CT (NCCT) rules out primary ICH74. IV t-PA
within 4.5 hours is currently indicated for both genders, but the treatment effect may be
more beneficial in women than in men87. Patients who are at risk of a serious bleeding
complication due to recent stroke, head trauma, brain surgery, or administration of low
molecular weight heparin within 24 hours preceding the stroke should not be treated with
thrombolysis58. Blood glucose must be measured before initiating thrombolytic therapy
because hypoglycemia can be incorrectly diagnosed as AIS88,and severe hyperglycemia
(blood glucose > 400mg/dL) is associated with lower recanalization rates89 and increased
the risk of ICH and poor outcome90. Consequently, diabetes mellitus is also associated
patients treated with thrombolysis, though studies suggest diabetic AIS patients still benefit
from IV t-PA93. Hypertension is also associated with increased risk of hemorrhagic
transformation following thrombolytic therapy, increased mortality, and decreased
probability of good functional outcome94. Hypertensive patients can only receive IV t-PA
if systolic and diastolic blood pressure can be safely lowered to less than 185, and
110mmHg respectively, and should be maintained at less than 180 and 105mmHg
respectively for twenty-four hours after initiating thrombolytic therapy58.
1.2.2
Mechanical Thrombectomy
Successful trials of IV thrombolysis were a breakthrough in treatment of AIS, but
the time window still posed a major impediment to treatment85, and recanalization rates
were poor for large vessel occlusions (LVO)95. LVO refers to occlusions of large proximal
cerebral arteries, such as the M1 segment of the MCA, anterior cerebral artery (ACA),
distal ICA, or the basilar artery. Although only ~40% of ischemic strokes are caused by
LVO they account for ~60% of post-stroke dependence and ~95% of post-stroke
mortality96. Poor recanalization rates for LVO and the relatively short time window for
administrating IV t-PA were major drivers for development of IAT for AIS.
Early attempts at IAT involved administering thrombolytic drugs directly to the
thrombus by guiding an endovascular microcatheter delivery system to the occlusion site,
allowing a high concentration of thrombolytic agent to be delivered to the thrombus while
also minimizing systemic exposure, theoretically minimizing the risk of hemorrhage. The
earliest clinical use of IAT in the literature used intra-arterial (IA) delivery of streptokinase
to treat patients with basilar artery thrombosis and reported excellent outcomes in 3 of 5
associated with improved functional outcome98,99, but also high rates of ICH, and
symptomatic ICH98,99. Several studies also combined IV t-PA initiated as soon as possible,
followed by IA delivery of t-PA directly to the thrombus for patients who still had clot
visible on angiography. These studies found similar rates of ICH and a nonsignificant
improvement in outcome compared to IV t-PA alone100–102. Although IA thrombolysis was
shown to improve recanalization rates compared to IV thrombolysis98–103, there is no level
1 evidence that IA thrombolysis alone improves functional outcome compared to IV
thrombolysis alone.
Catheter devices for mechanically removing thrombus were developed as an
alternative to IA delivery of thrombolytic agents. Mechanical removal of the thrombus is
advantageous because of high recanalization rates for LVO104, faster recanalization relative
to IA thrombolysis which requires prolonged infusion of thrombolytic agents for up to 2
hours102, and reduced hemorrhage risk by avoiding the use of thrombolytic drugs105. In a
mechanical thrombectomy procedure: a microcatheter is advanced to the occlusion site and
passed through the thrombus, the device is deployed distal to the thrombus and retracted to
ensnare the thrombus and pull it to a proximally placed guide catheter for aspiration106.
The first endovascular device approved for AIS treatment used a flexible corkscrew design
and was called the Mechanical Embolus Removal in Cerebral Ischemia (MERCI)
retriever106. Trials of the MERCI device showed that LVOs could be recanalized in 46%
to 57% of patients treated within 8 hours, but design limitations meant up to 6 passes had
to be made to remove the entire clot106,107. Second generation devices using a flexible,
Early randomized controlled trials of mechanical thrombectomy all failed to show
a significant improvement in functional outcome compared to IV t-PA110–112, but these
trials had several important limitations. Only ~20% of patients in the IAT arm of each trial
were treated with second generation devices110–112, and in 2 trials 50% to 66% of patients
were treated with IA thrombolysis instead of thrombectomy110,111. IV t-PA was not
administered to patients randomized into the IAT arm of 1 trial. As a result, treatment was
initiated an average of 1h later in patients receiving IAT compared to patients treated with
IV t-PA111. CT angiography (CTA) was not used to confirm the presence of a LVO for all
patients in 2 of the trials, resulting in many patients randomized into the IAT arm not
having an occlusion that was suitable for treatment with IAT110,111. Lessons learned from
these trials informed the design of subsequent randomized, controlled trials of IAT.
In 2015, 5 trials comparing patients treated with IV t-PA plus IAT to patients treated
with IV t-PA alone were stopped early after demonstrating significant benefit of IAT. All
5 trials used NCCT or MRI to rule out ICH, angiography to confirm the presence of LVO,
and initiated IAT within 6113–116 to 8117 hours of symptom onset. In addition to
demonstrating the efficacy of IAT for treating patients with LVO, these trials also provided
early evidence that advanced neuroimaging, such as multi-phase CTA or CTP could be
used to identify patients with a small infarct core and large penumbra, who would be most
likely to benefit from revascularization. The ESCAPE trial, performed in Canada, used a
semi-quantitative scale called the Alberta Stroke Program Early CT Score (ASPECTS) to
assess NCCT for signs of early ischemic damage indicative of a large infarct core118, and
a novel CTA imaging technique (multiphase CTA) to evaluate the degree of collateral
SWIFT-PRIME and EXTEND-IA trials, performed in the United States and Australia/New
Zealand respectively, used thresholds applied to parameter maps from CTP to estimate the
volume of infarct and penumbra; patients with large infarct volumes and/or small
penumbra volumes were excluded113,115. These trials, which included imaging to evaluate
the extent of irreversibly damaged infarct and salvageable penumbra, had higher rates of
good functional outcome in the IAT group (53% to 71%), than the MRCLEAN and
REVASCAT trials, conducted in the Netherlands and Spain respectively, which did not
use advanced neuroimaging (33% to 44%)116,117.
Several retrospective studies noted that there was no significant difference in the
rate of good functional outcome, symptomatic ICH or mortality when patients were triaged
based on admission CTP or MRI120,121, providing more support for image-based triaging
rather than strictly time-based triaging. The efficacy of image-based triaging for IAT was
confirmed recently in the DEFUSE 3 and DAWN trials – two randomized, controlled trials
comparing standard medical therapy alone to standard medical therapy plus IAT in patients
arriving up to 16 hours122 to 24 hours123 post symptom onset, or those with unknown onset
times. Patients were eligible if they had LVO confirmed on CTA, no evidence of
hemorrhage on NCCT, and mismatch between infarct volume and either penumbra
volume122 or clinical deficit123. The treatment effect of IAT (difference in rate of functional
independence between IAT and control groups) seen in these trials (28% to 36%)122,123 was
paradoxically larger than what was seen in a meta-analysis of the trials where IAT was
initiated within 6 hours of symptom onset (19.5%)104. This was mainly because patients
in the control group were not eligible for IV t-PA since these trials only enrolled patients
in earlier trials received IV t-PA)104. Nevertheless, the rate of IAT-treated patients with
good functional outcomes (45% to 49%)122,123 was similar to when IAT was initiated within
6 hours of symptom onset (46%)104, showing that IAT could still be effective in certain
patients up to 24 hours post symptom onset.
Current clinical guidelines recommend performing mechanical thrombectomy with
a stent retriever within 6 hours of symptom onset in patients aged 18 years or older, no sign
of extensive early ischemic damage on NCCT (ASPECTS ≥ 6), and occlusion of the
intracranial portion of the ICA or M1 segment of the MCA confirmed on CTA58.
Mechanical thrombectomy is also recommended up to 24 hours post symptom onset in
patients aged 18 years or older, with CTA-confirmed occlusion of ICA or M1 segment of
the MCA, and either an infarct/penumbra mismatch, defined by the DEFUSE 3 trial
criteria, or a clinical/imaging mismatch, defined by the DAWN trial criteria. Both trials
used thresholds applied to CTP-CBF maps or diffusion-weighted MRI (diffusion-weighted
imaging or DWI) to estimate the volume of infarct core. The DEFUSE 3 trial used
thresholds applied to time-to-maximum (Tmax) maps from CTP or perfusion-weighted MRI
(perfusion-weighted imaging or PWI) to estimate the penumbra volume; patients were
eligible for treatment if penumbra volume was 1.8 times larger than the infarct, infarct
volume was < 70mL, and penumbra volume was > 15mL122. The DAWN trial inferred the
volume of penumbra from clinical assessment with the NIHSS. Clinical deficit defined by
NIHSS reflects the total volume of ischemic tissue since both infarct and penumbral tissue
are functionally silent, therefore a large penumbra volume is implied in patients with severe
clinical deficits but only a small infarct core volume. Patients younger than 80 years were
and NIHSS ≥ 20; patients 80 years or older were eligible if infarct volume < 21mL and
NIHSS ≥ 10123.
1.3
Medical Imaging in Ischemic Stroke
Medical imaging has become an important part of routine clinical care for AIS.
Structural and functional information from admission neuroimaging is used to inform three
key factors for triaging and management of patients with AIS symptoms: 1) is the stroke
ischemic or hemorrhagic? 2) is there an intravascular occlusion? 3) is there viable
penumbra tissue? NCCT or MRI must be performed at admission to determine if the stroke
is ischemic or hemorrhagic before initiating treatment, since treatment options for AIS can
be detrimental to patients with primary ICH124. CTA or magnetic resonance angiography
(MRA) is also required to define the presence and location of LVO and to assess ease of
access in patients being considered for IAT, and many centers now also routinely use CTP
or PWI to guide treatment decisions. In addition to improving acute diagnosis and
providing personalized triaging based on tissue status instead of time from onset,
physiological information from functional CT, MRI, and positron emission tomography
(PET) has shaped AIS treatment strategies by advanced our understanding of stroke
pathophysiology and tissue viability.
1.3.1
Positron Emission Tomography
PET imaging relies on detection of coincident gamma rays produced in positron
annihilation events to measure the spatial distribution of biological molecules radioactively
labelled with positron emitting nuclides, known as radiotracers. PET is a highly sensitive
assess a wide range of hemodynamic, functional, and metabolic parameters depending on
properties of the radiotracer used. A static PET scan performed sometime after radiotracer
administration can measure the spatial distribution of radioactivity in the body relative to
the total injected amount and body weight. On the other hand, dynamic scanning used in
conjunction with arterial blood sampling to quantify arterial delivery (arterial input
function or AIF) of the radiotracer can allow more detailed pharmacokinetic modelling to
be performed125.
PET imaging with 15O-labelled water and oxygen gas allows quantification of CBF,
cerebral metabolic rate of oxygen (CMRO2), and oxygen extraction fraction (OEF)
(fraction of oxygen extracted from the blood). Contemporaneous assessment of blood flow
and oxygen metabolism with PET imaging greatly advanced the understanding of the
time-dependence of tissue viability in ischemic stroke patients126,127. Tissue with decreased CBF
(CBF < 12 mL∙min-1∙100g-1) and CMRO
2 usually progressed to infarction, while
penumbral tissue had CBF between 12-22 mL∙min-1∙100g-1, elevated OEF, and preserved
CMRO2 in the acute phase128. The coupled decrease in CBF and increase in OEF (termed
‘misery perfusion’)129 was representative of still-viable tissue, that would eventually
progress to infarction without reperfusion due to mismatch between metabolic demand and
decreased oxygen delivery from CBF. Animal studies of reversible focal cerebral ischemia
showed that brain tissue with acutely elevated OEF progressed to infarction in animals with
permanent MCA occlusion, but not in animals where the occlusion was reversed after 6
hours, establishing the time-dependence of penumbral viability130,131. Although tissue
compartments in AIS are well defined by CBF, CMRO2, and OEF, there are drawbacks to
of 15O is only ~2 minutes132, and the rapid arterial blood sampling required for
quantification is invasive.
More recently, tracers labelled with 11C or 18F which bind to neuronal cell surface
receptors have been developed. The half-lives of 11C and 18F are ~20 minutes and 110
minutes respectively132, making them easier to use than 15O logistically. One example is
11C-labelled flumazenil (FMZ), which is a selective, high-affinity ligand for the central
benzodiazepine receptor of the GABA receptor complex133. GABA receptor activity can
be used as a marker of neuronal integrity since GABA receptors are sensitive to ischemic
damage134. Clinical studies have shown that neocortex with decreased uptake of 11C-FMZ
in the acute phase of stroke is infarcted134–136. Fluoroethylflumazenil (FFMZ), a
fluorinated analog of FMZ, works similarly for mapping GABA receptor activity137, and
can be labelled with 18F, which is advantageous because the half-life is longer than 11C 138.
The density of GABA receptors is low in the basal ganglia and negligible in white matter139,
meaning FMZ, FFMZ and other benzodiazepine receptor ligands are not suitable for
detecting infarction outside of cortical grey matter133. Fluoromisonidazole (FMISO)
radiolabelled with 18F is a hypoxia tracer which has been proposed as a marker of
penumbral tissue. FMISO accumulates in ischemic tissue by binding to macromolecules
after being reduced by nitroreductases140. Studies in a rat MCA occlusion model of AIS
showed a pattern of FMISO uptake throughout the entire MCA territory at early time points
30 to 60 minutes post occlusion, that evolved into a small rim of uptake surrounding the
infarct core, and by 24 to 48 hours post occlusion there was minimal uptake in the final
infarct141,142. A similar time-dependent uptake pattern was also observed in human patients
of AIS found that FMISO was retained in ischemic tissue for up to 6 hours post occlusion,
consequently penumbral tissue which had already progressed to infarction within 6 hours
still had elevated FMISO uptakes144. Subsequent study showed strong FMISO uptake
throughout the MCA territory even when administered up to 6 hours post occlusion, when
most ischemic tissue had likely progressed to infarction. Approximately 50% of the
FMISO-retaining lesion was infarcted on histology, and most of the salvaged tissue in the
lesion had signs of neuronal damage145. These findings suggest increased FMISO uptake
may not be a specific marker of penumbral tissue, further study is required to determine
the applications of this radiotracer in AIS research.
Although the clinical utility of PET in AIS is limited due to cost and logistical
complexity, it is still an invaluable tool for studying pathophysiological processes of AIS
and serves as a gold standard for validating other imaging techniques used in AIS.
1.3.2
Magnetic Resonance Imaging
MRI is a versatile imaging technique used for AIS diagnosis and prognosis, that
can provide both structural and functional information depending on the pulse sequence
used to create the image. Acute ICH can be seen on MRI with gradient recalled echo
(GRE) pulse sequences as a core of heterogenous signal intensity surrounded by a rim of
hypointensity. Studies have shown that NCCT and MRI with GRE pulse sequences are
equivalent for ruling out ICH in patients being considered for IV t-PA124. Thrombus
location and length can also be assessed on susceptibility-weighted imaging (SWI) with
GRE sequences, where the thrombus appears as a hypointense blooming artifact due to
paramagnetic properties of deoxyhemoglobin contained in the clot146. SWI has a high
circulation146,147, can reliably measure the length of clots longer than 6mm147, and clot
composition can even be inferred since SWI is related to the red blood cell content of the
clot148.
MRA can be performed either by injecting gadolinium-based contrast agent, or with
non-contrast methods like the time-of-flight (TOF) technique, where flowing blood has
hyperintense signal relative to surrounding static tissue. Both contrast-enhanced and
non-contrast enhanced MRA can assess vessel patency in AIS149 and both methods have
advantages and disadvantages. TOF-MRA can be performed when contrast administration
is not possible, but compared to contrast-enhanced MRA, the acquisition time is longer,
making patient motion problematic, and the field of view (FOV) is smaller, so extracranial
arteries cannot be imaged149.
DWI and associated apparent diffusion coefficient (ADC) maps are the clinical gold
standard for detecting early ischemic damage. One of the final steps towards irreversible
tissue damage is cytotoxic edema, where water shifts to the intracellular space due to the
increase in intracellular sodium and calcium after membrane ion pump failure. DWI is
sensitive to Brownian motion of water molecules and detects cytotoxic edema as a
hyperintense lesion due to restricted diffusion of water molecules in the intracellular
space150. Contrast in DWI is due to differences in ADC as well as T2-weighted contrast,
commonly referred to as ‘T2 shine-through’151. To remove the effects of T2 shine-through,
ADC maps are generated where cytotoxic edema is seen as a hypointense lesion with
decreased ADC values151. Acute DWI lesions are highly sensitive and specific markers of
AIS152 and provide reliable estimates of the size and location of the final infarct core
where a small part of the acute lesion may appear normal on follow-up imaging,153 however
the reversal is often transient and unlikely to represent salvaged tissue154.
Imaging of the infarct core with DWI can be complemented with PWI performed
using IV administration of exogenous gadolinium-based contrast agent. PWI with
exogenous contrast agents can be broadly divided into dynamic contrast-enhanced
(DCE)-MRI, which relies on the T1 effects of gadolinium, or dynamic susceptibility contrast
(DSC)-MRI, which relies on the susceptibility effect of gadolinium. Signal enhancement
versus time curves are measured by T1-weighted or T2/T2*-weighted echo-planar imaging
and summary parameters like time-to-peak (TTP) and area-under curve (AUC) can be
determined in a model-free approach155. Or quantitative maps of CBF, Tmax, and other
parameters can be computed with pharmacokinetic modelling if the measured signal
enhancement curves are converted to contrast concentration versus time curves, and an AIF
is available. Measured signal enhancement is not linearly related to contrast concentration
in PWI, making absolute quantitation of hemodynamic parameters more difficult. Contrast
concentration can be calculated from signal enhancement using pulse sequence-dependent
equations155, DCE-MRI requires pre-contrast T1 mapping in addition to pulse
sequence-dependent equations to calculate the contrast concentration versus time from the measured
signal156. Accurately measuring the AIF can also be problematic because of
in-flow/out-flow effects (blood in-flow/out-flowing into or out of the imaging volume causing signal increases and
decreases respectively), limited temporal resolution and other factors156. When an AIF of
sufficient quality cannot be derived from the PWI scan, alternatives such as
population-averaged AIFs may be used instead156, but this can lead to errors in parameter calculation
Studies have shown that the deconvolution-based Tmax parameter is optimal for
identifying penumbra (Tmax > 6s) on admission DSC-MRI157,158. Model-free summary
parameters do not account for arterial delivery and are therefore affected by factors like
bolus dispersion and cardiac output159, but studies show TTP is highly correlated with Tmax
and performs similarly for predicting penumbra volume160,161. DWI/PWI mismatch is a
widely used neuroimaging paradigm for managing AIS patients based on infarct and
penumbra volumes measured from admission DWI and PWI using fully automated
post-processing software (RApid post-processing of PerfusIon and Diffusion, or RAPID)162.
DEFUSE 3 recently used RAPID to show that patients with LVO and mismatch on
admission DWI/PWI or CTP (infarct volume < 70mL, infarct/penumbra ratio > 1.8, and
penumbra volume > 15mL) can still benefit from IAT up to 16 hours post symptom
onset122. PWI can also be performed with endogenous contrast using arterial spin labelling
(ASL), where magnetically-labelled, arterial blood acts as an endogenous tracer rather than
administering exogenous gadolinium-based contrast. However, ASL is not commonly
used for AIS because relaxation of the magnetic label during prolonged transit times caused
by ischemia can lead to poor signal-to-noise ratio and underestimated CBF163.
Another MRI-based paradigm for AIS patient management is mismatch between
admission fluid-attenuated inversion recovery (FLAIR) and DWI. Hyperintense lesions
on FLAIR are highly sensitive markers of infarct core164 but are generally not visible in the
first 3 hours post onset, whereas DWI lesions are visible 1 hour or less post onset165.
Studies have shown that FLAIR-DWI mismatch (hyperintense DWI lesion with no FLAIR
lesion) is a surrogate marker of ischemia duration166 that can identify patients with time
placebo-controlled trial found that treating patients with FLAIR-DWI mismatch and unknown
stroke onset time with IV t-PA improved functional outcome despite increased risk of
symptomatic ICH168. FLAIR-DWI mismatch could potentially be used in patients with
unknown onset times (approximately 14 to 25% of all AIS patients)169,170 to identify those
with ischemia duration < 4.5 hours, who are more likely to benefit from thrombolysis.
In addition to providing anatomical and functional information about vessel
patency, tissue viability, ischemia duration and other factors, MRI is more readily available
in the AIS setting than PET and does not require ionizing radiation. However, MR scanners
have limited availability compared to CT outside of large city hospitals or academic
centers, and patients with MRI contraindications (e.g. claustrophobia, ferromagnetic
implants, pacemakers) must be excluded from imaging; screening for contraindications
also results in longer door-to-needle times compared to CT171. Despite these limitations,
MRI is an important modality for triaging and management of AIS patients.
1.3.3
Computed Tomography
CT is the most commonly used modality for assessing AIS patients because it is
more widely available172, less expensive, and faster compared to MRI, and CT can be
performed without first screening the patient for common MRI contraindications. Patients
with AIS symptoms are often assessed with NCCT, CTA or multiphase CTA, and CTP.
1.3.3.1
Non-Contrast Computed Tomography
Admission NCCT is required for any patient with stroke symptoms to rule out
non-vascular stroke mimics and primary ICH. The intensity in each voxel of CT images,
coefficient. NCCT has good sensitivity for detecting acute phase ICH which appears as a
hyperintense lesion124, and is more cost-effective as a screening tool than MRI74. In
addition to ruling out ICH, careful examination of NCCT can also yield information about
early ischemic damage and clot characteristics. ASPECTS is a standardized CT reading
method based on assessment of 10 regions of interest (ROI) located in the MCA territory
visible in two 5mm thick CT slices, one at the level of the thalamus and basal ganglia, and
one just rostral to ganglionic structures. One point is subtracted from 10 for each ROI with
evidence of early ischemic damage118. Signs of early ischemic damage visible on NCCT
include hypoattenuation, sulcal effacement due to mass effect from edema, and loss of
gray-white matter differentiation, including loss of the insular ribbon and obscuration of
the lentiform nucleus173. ASPECTS ≤ 7 has been associated with increased risk of poor
functional outcome and symptomatic ICH in patients treated with IV t-PA118.
Retrospective studies of patients in the NINDS and ECASS II trials found no significant
effect of baseline ASPECTS on IV t-PA treatment effect174,175, however ASPECTS ≤ 7
was associated with significantly increased risk of symptomatic ICH in the ECASS II
patients175, and there was a trend toward decreased treatment benefit and increased
mortality in the NINDS patients174. Low ASPECTS was also associated with increased
risk of poor functional outcome, mortality, and symptomatic ICH in patients treated with
IAT176 and was part of the exclusion criteria for three of the seminal trials demonstrating
the efficacy of IAT113,114,117. Current clinical guidelines suggest IAT should only be
performed in patients with ASPECTS ≥ 658, but there is some evidence that patients with
Intraluminal thrombus in the distal ICA, M1, and M2 segments of the MCA can
also be visualized in patients as hyperintensity on NCCT, this has been proposed as a
method of confirming the presence of LVO without performing CTA in patients being
considered for IAT. The hyperdense artery sign can detect LVO (as assessed with gold
standard CTA) with high specificity (95-100%) and moderate sensitivity (30-55%) when
NCCT is reconstructed with standard 5mm thick slices179,180, studies have shown that
sensitivity can be improved to 70-100% by using thinner (0.625-1.5mm) slices180–182.
Thrombus length measured on NCCT also agrees with length measured on CTA within
±1mm when slice thickness is ≤ 2.5mm183. Studies have shown that IV t-PA is less
effective for thrombi longer than 10mm on NCCT184, and that clot length and location are
associated with outcome in IAT-treated patients185.
1.3.3.2
Computed Tomography Angiography
CTA requires IV administration of iodinated contrast agent and rapid scanning after
a short delay to capture peak intravascular enhancement. Iodinated k-edge falls within the
energy range of diagnostic x-rays, causing iodinated contrast agents to produce a
measurable increase in x-ray attenuation (~30HU per 1mg/mL of iodine), and therefore
signal intensity measured on CT. CTA source images can be viewed directly, or as
maximum intensity projections or 3D reconstructions with postprocessing; blood vessels
perfused with contrast agent as the image is acquired will appear hyperdense. Evaluation
of flow dynamics is also possible with 4D-CTA or multiphase CTA, where images are
acquired either continuously (4D-CTA), or at multiple discrete time points (multiphase
CTA) as contrast travels through cerebral vasculature, rather than conventional CTA where