Available online: http://edupediapublications.org/journals/index.php/IJR/ P a g e | 1010
A Two Level Unified Space Vector Pulse Width Modulation for
Field Oriented Control of Induction Motor
Kappeta Venkata Dinesh Reddy1, R.Venkata Dileep2, Dr.A.Mallikarjuna Prasad3
1
P.G. Scholar, 2Guide, Assistant Professor, 3Head of the Department 1,2,3
BRANCH : EEE , POWER AND INDUSTRIAL DRIVES 1,2,3
Geethanjali College Of Engineering And Technology,Nannur Email.Id : [email protected], [email protected]
Abstract
:In this paper, space vector pulse width modulation (SVPWM ) to control the speed of an induction motor fed with Zsource inverter is presented. In recent years, the field oriented control (FOC) of induction motor drive is widely used in high performance drive system due to its high efficiency, good power factor and extremely rugged property. The Z-source inverter is also introduced to the system which employs a unique LC network to couple the inverter main circuit to the diode front end. By controlling the shoot-through duty cycle, the Z-source can produce any desired output ac voltage, even greater than the line voltage. As results, the new Z-source inverter system provides ride-through capability under voltage sags, reduces line harmonics, and extends output voltage range.
INTRODUCTION
Dual-inverter configuration with two separated DC voltage supplies is one of the attractive approaches to provide a higher voltage for motor drives in electric vehicle (EV) applications, or large-power wind energy generation system. Since each end of the stator windings of the open winding AC machine is directly connected to an inverter, usually the reference voltage vector will be split into two voltage vectors, two independent space vector pulse width modulations (SVPWM s) or discontinuous
PWMs are adopted to determine the gate pulses for each inverter. Thus, the switching frequency during a sampling period is doubled compared with a single inverter fed drive system. In order to reduce the switching frequency, an alternate-sub-hexagonal-center PWM switching strategy and an alternate-inverter PWM strategy are proposed. However, the DC-link voltages for the two inverters are restricted to be equal, and the output performance might be deteriorated when the two DC voltages are different.
Available online: http://edupediapublications.org/journals/index.php/IJR/ P a g e | 1011
reduced to 1/3 of that of the dual SVPWM algorithm, and a good performance is obtained for a wide speed range.
Pulse Width Modulation
Pulse width modulation (PWM ) has been actively used in circuits and systems for many years. Its unique features help it participate in various applications, including motor control, telecommunications, switch-mode power supplies (SM PS), and class D power amplifiers (PA). The PWM is an inevitable part of the SM PSs and the class D PAs among the other major applications. Being a part of these circuits and systems makes the PWM be a part of a huge family of products addressing various markets such as consumer electronics, wearable electronics, automotive, healthcare, industrial, military/defense, and aerospace.
The evolution of a simple PWM chip was first started by Silicon General’s cofounder and power electronics engineer, Bob M ammano, in 1975. Constant advances in the electronics technology have triggered the evolution of the first PWM integrated circuit (IC) so that the transition from a simple chip to a complete power management IC (PM IC) was achieved.
The significant role of the PWM in wide range of circuits and systems has been motivating many researchers and engineers to develop its theoretical and practical background for many years. Today, the PWM can be implemented in various platforms with different methods. The PWM can be implemented by an analog or a digital application specific integrated circuit (ASIC) or general purpose digital ICs such as a field-programmable gate array (FPGA) or a digital signal processor (DSP). Besides, the PWM can be implemented in discrete circuit level with active and passive electronic components.
Control S chemes Of Induction Motor
Numerous induction motor control schemes have been developed to enable independent control of torque and these control schemes can generally be divided into two categories. They are field oriented control (FOC) and direct torque control (DTC). FOC involves the separation of the stator current into two components, one that controls the flux and another that controls the torque. The DTC directly controls the inverter in order to apply a voltage that will drive the torque and flux towards the reference values.
Available online: http://edupediapublications.org/journals/index.php/IJR/ P a g e | 1012
mechanical transducers on the machine shaft. Thus, DTC and DSC can be considered as “sensorless type” control techniques. The basic scheme of DSC is preferable in the high power range applications, where a lower inverter switching frequency can justify higher current distortion. In this proposed system, the attention will be mainly focused on the basic DTC scheme, which is more suitable in the small and medium power range applications.
3.1 Field Oriented Control (Foc)
AC Induction motors offer enviable operational characteristics such as robustness, reliability and ease of control. They are extensively used in various applications ranging from industrial motion control systems to home appliances. However, the use of induction motors at its highest efficiency is a challenging task because of their complex mathematical model and non-linear characteristic during saturation. These factors make the control of induction motor difficult and call for use of a high performance control algorithms such as “vector control”.
Scalar control such as the “V/Hz” strategy has its limitations in terms of performance. The scalar control method for induction motors generates oscillations on the produced torque. Hence to achieve better dynamic performance, a more superior control scheme is needed for Induction M otor. With the mathematical processing capabilities offered by the microcontrollers, digital signal processors and FGPA, advanced control strategies can be implemented to decouple the torque generation and the magnetization functions in an AC induction motor. This decoupled torque and magnetization flux is commonly called rotor Flux Oriented Control (FOC). Field Oriented Control (FOC) is probably the most common control method used for
high-performance induction motor applications. The invention of FOC in the beginning of 1970s, and the demonstration that an induction motor can be controlled like a separately excited DC motor, brought a renaissance in the high-performance control of ac drives (Holtz & Bube1991, Jansen et al 1994). Because of dc machine-like performance, FOC is also known as decoupling, orthogonal, or transvector control. FOC was the first technique developed to allow independent control of induction motor torque and flux. It refers to induction motor operation in a synchronously rotating d,q reference frame that is aligned with one of the motor fluxes typically the rotor flux (Kwindler et al 1994, De Doncker et al 1994). In this mode of operation, control of the torque and flux is decoupled such that the d- axis component of the stator current controls the rotor flux magnitude and the q-axis component controls the torque produced. This was initially difficult to implement due to the complexity of transforming the three phase variables to a rotating d, q reference frame. With the development of suitable low cost microprocessors in the early 1980s, FOC become practical to implement in commercial motor drives.
Available online: http://edupediapublications.org/journals/index.php/IJR/ P a g e | 1013
motor applications which can operate smoothly over the wide speed range, can produce full torque at zero speed, and is capable of quick acceleration and deceleration”
Working Principle of Field Oriented Control
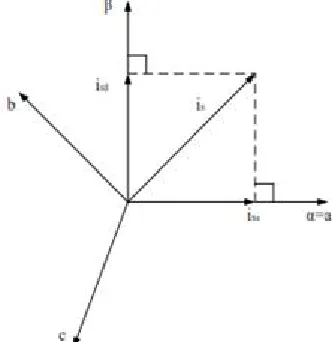
The field oriented control consists of controlling the stator currents represented by a vector. This control is based on projections that transform a three phase time and speed dependent system into a two coordinate (d and q frame) time invariant system. These transformations and projections lead to a structure similar to that of a DC machine control. FOC machines need two constants as input references: the torque component (aligned with the q coordinate) and the flux component (aligned with d coordinate).
The three-phase voltages, currents and fluxes of AC-motors can be analyzed in terms of complex space vectors. If we take ia, ib, ic as instantaneous currents in the stator phases, then the stator current vector it defined as follow:
where (a,b,c) are the axes of three phase system.
This current space vector represents the three phase sinusoidal system. It needs to be transformed into a two time invariant coordinate system. This transformation can be divided into two steps: (a,b,c) → (α, β)
(the Clarke transformation), which outputs a two co-ordinate time variant system. (α, β) → (d,q) (the Park transformation), which
outputs a two co- ordinate time invariant system.
The (a,b,c) → (α, β) Projection (Clarke
transformation)
Three-phase quantities either voltages or currents, varying in time along the axes a, b, and c, can be mathematically transformed into two-phase voltages or currents, varying
in time along the axes α and β by the
following transformation matrix:
Assuming that the axis α and the axis β are
along same direction and β is orthogonal to
them, the vector diagram as shown in Figure 2.1.
Figure 2.1 Stator Current vector diagram
The above projection modifies the three phase system into the (α, β) two dimension
Available online: http://edupediapublications.org/journals/index.php/IJR/ P a g e | 1014
But these two phase (α, β) currents still
depends upon time and speed. The (α, β) →
(d,q) projection (Park transformation)
This is the most important transformation in the FOC. In fact, this projection modifies the
two phase fixed orthogonal system (α, β)
into d,q rotating reference system. The transformation matrix is given below:
where „θ‟ is the angle between the rotating
and fixed coordinate system.
Consider the d axis aligned with the rotor flux, Figure 2.2 shows the relationship from the two reference frames for the current vector:
where “θ” is the rotor flux position. The torque and flux components of the current vector are determined by the following equations:
These components depend on the current
vector (α, β) components and on the rotor
flux position. If you know the accurate rotor flux position then, by above equation, the d,q component can be easily calculated. At
this instant, the torque can be controlled directly because flux component (isd) and torque component (isq) are independent now.
Basic Module for Field Oriented Control
A block diagram of a field-oriented controller is shown in Figure 2.3, the stator phase currents are measured. These measured currents are fed into the Clarke transformation block. The outputs of this
projection are entitled isα and isβ. These
two components of the current enter into the Park transformation block that provide the current in the d,q reference frame. The isd and isq components are contrasted to the references: isdref (the flux reference) and isqref (the torque reference). At this instant, the control structure has an advantage.
It can be used to control either synchronous or induction machines by simply changing the flux reference and tracking rotor flux position. In case of PM SM the rotor flux is fixed determined by the magnets so there is no need to create one. Therefore, while controlling a PM SM , isdref should be equal to zero. As induction motors need a rotor flux creation in order to operate, the flux reference must not be equal to zero. This easily eliminates one of the major shortcomings of the “classic” control structures. The portability from asynchronous to synchronous drives. The outputs of the PI controllers are Vsdref and Vsqref. They are applied to the inverse Park transformation block. The
outputs of this projection are Vsαref and Vsβref are fed to the space vector pulse
Available online: http://edupediapublications.org/journals/index.php/IJR/ P a g e | 1015
1) In case of synchronous motor(s), the rotor speed is equal to the rotorflux speed. Then rotor flux position is directly determined by position sensor or by integration of rotor speed.
2) In case of asynchronous motor(s), the rotor speed is not equal to the rotor flux speed because of slip. Therefore a particular method is used to evaluate
rotor flux position (θ). This method
utilizes current model, which needs two equations of the induction motor model in d,q rotating reference frame.
These components depend on the current
vector (α, β) components and on the rotor
flux position. If you know the accurate rotor flux position then, by above equation, the d,q component can be easily calculated. At this instant, the torque can be controlled directly because flux component (isd) and torque component (isq) are independent now.
S pace vector pulse width modulation method (S VPWM)
Space vector pulse width modulation method is best among all the PWM techniques for drive applications and the three phase voltage source inverters (VSI). Compared to sinusoidal pulse width modulation M ethod (SPWM ), SVPWM has many advantages, which are less switching losses, less total harmonic distortion, it is easy to digitalize and better utilization of
dc-bus voltage. The performance of the SVPWM inverter is based on the following criteria: switching losses of the inverter, total harmonic distortion (THD) and maximum output voltage. Originally the SVPWM method is developed as a vector approach to pulse width modulation (PWM ) for three phase inverters. In SVPWM inverter the reference wave is revolving reference voltage vector and the carrier signal is high frequency triangular or saw tooth waveform. The intersection of these two will give the gate pulses to inverter to control the voltage and frequency of the inverter.
Features of S VPWM
The SVPWM is better than the other PWM methods due to the following features.
It has the wide linear modulation range including with PWM third harmonic injection automatically.
It has lesser switching losses because only one switch is operating at a time in the SVPWM inverter.
It gives 15.5% more utilization of DC-Link voltage than the conventional PWM methods.
It has higher efficiency.
It gives output phase voltage is Vdc and output line voltage is V ,but in SPWM the output
Concept of space vector
Available online: http://edupediapublications.org/journals/index.php/IJR/ P a g e | 1016
Let us take the three phase balanced voltages as shownbelow,
If we apply these three phase balanced voltages to the three phase induction motor, it produces rotating flux vector in the air gap of the induction machine rotating with a velocity . This rotating flux vector magnitude and angle can be calculated using the Clark’s transformation method in stationary reference frame as shown below
The above equation is separated into real and imaginary parts which are
The above equations can be represented in matrix form as shown below
Figure 3.1. Representation of rotating vector in complex plane
3.4 Principle of S pace Vector PWM
The three phase voltage source inverter (VSI) with BLDC motor load is shown in figure 3.2. It has three legs that have two switching devices and those are complimenting each other. I.e. only one switch is operating at a time. Therefore the output voltage of the inverter is determined by the ON/OFF of the three switching devices (S1, S3, and S5).
Figure 3.2. Three phase VS I with BLDC motor
The output voltage is controlled by the switching variables a, b, c, a’, b’ and c’. If the upper switch is ON then the switching variable a, b, or c is 1, then the corresponding switching device is OFF, then the switching variable a’, b’, or c’ is 0. The following matrix gives the relation between switching variable and the output phase voltages and output line voltages.
Available online: http://edupediapublications.org/journals/index.php/IJR/ P a g e | 1017
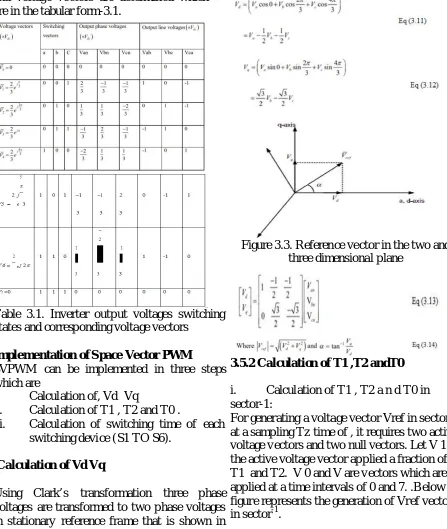
and voltage vectors are determined which are in the tabular form-3.1.
Table 3.1. Inverter output voltages switching states and corresponding voltage vectors
Implementation of S pace Vector PWM
SVPWM can be implemented in three steps which are
i. Calculation of, Vd Vq
ii. Calculation of T1 , T2 and T0 .
iii. Calculation of switching time of each switching device (S1 TO S6).
Calculation of Vd Vq
Using Clark’s transformation three phase voltages are transformed to two phase voltages in stationary reference frame that is shown in figure.
Figure 3.3. Reference vector in the two and three dimensional plane
3.5.2 Calculation of T1 ,T2 andT0
i. Calculation of T1 , T2 a n d T0 in sector-1:
Available online: http://edupediapublications.org/journals/index.php/IJR/ P a g e | 1018
Figure 3.4. Calculation Vref in sector-1
calculated as follows Using volt-sec balance equation Vref
Separate real and imaginary parts from the above equation, then
Using equations (3.17) and (3.18) T1 and T2
are calculated as follows which are
ii. Calculation of T1 , T2 a n d T0 in any sector:
Separate real and imaginary parts from the above equation, then
Using equations (2.23) and (2.24) T1 and T2 are
calculated as follows which are
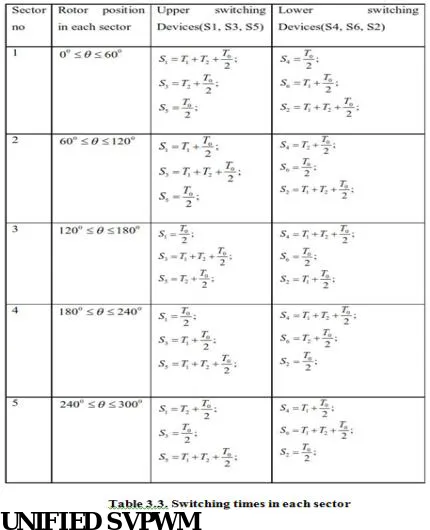
Calculation of switching time of each switching device (S1 TO S6):
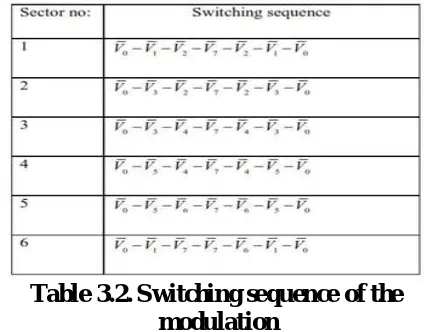
The following table shows the switching sequence corresponds to each sector. For each cycle there are 7 switching states in each sector. The odd sector numbers travels in anti-clockwise direction and even sector numbers travels in clockwise direction. The following table represents the switching sequence each sector.
Table 3.2. S witching sequence of the modulation
In sector-1 the switching states sequence is
Available online: http://edupediapublications.org/journals/index.php/IJR/ P a g e | 1019
Here sampling time period is equal to the switching time period Ts, which is divided among the 7 switching states, out of which three are zero vectors.
The following figure 3.4 shows the switching pulse pattern in all the sectors. The following symmetrical pulse patterns gives the less harmonics. Based on the symmetric pulses waveforms switching times of all the switching devices in all the sectors are derived. Table-3.2 represents the switching times of the inverter in each sector
Figure 3.5. S witching signal derivation for a period from voltage vectors in all the sectors
UNIFIED S VPWM
The configuration of a dual two-level inverter system with two isolated DC voltage sources Vdc1 and Vdc2 is shown in Fig.4.1, where the ratio of two DC voltages, k=Vdc1/Vdc2, is an arbitrary positive value.
Dual- inverter with two isolated DC Sources:
Figure 4.1. Configuration of dual inverter with two isolated DC sources
The relationship between the reference voltage vector Vs and the vector outputs of the dual inverter Vinv1 and Vinv2 is represented as:
Available online: http://edupediapublications.org/journals/index.php/IJR/ P a g e | 1020
unified SVPWM , each inverter provides an active voltage vector, Vex for INV1 while Vy for INV2, and their time durations tx, ty are expressed as
Voltage vector plane and Vector selection for the Dual- inverter:
Where Vsm is the amplitude of the reference voltage vector Vs, Ts is the sampling period and
θ ϵ (0,π/3] is the angle between Vs and Vx.
The voltage vector plane for the dual inverter system is divided into 6 sectors. Considering that the time durations tx and ty are limited to Ts, each sector is divided into 3 regions, as shown in Fig. 4.2 for sector I as an example. If tx > Ts, the voltage vector Vs is located in region ②, as displayed in Fig. 4.2(b). If ty >Ts, Vs is located in region ③, as shown in Fig. 4.2(c). Otherwise, Vs is in region ①, as exhibited in Fig. 4.2(a). When Vs is not located in region ①, a complementary voltage vector is needed according to the voltage-second integral principle.
Figure 4.2. Vectors synthesis process when Vs appears in three regions
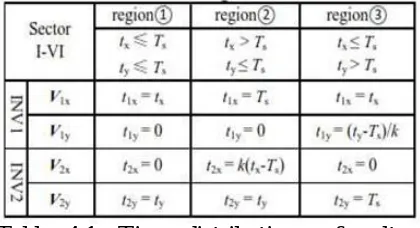
The time distributions of voltage vectors for the dual-inverter in different sectors and regions are showed in Table 4.1. Where, V1x = Vx and V2y = Vy represent the voltage vectors used initially in region ①. The complementary vector for INV1 is presented as V1y and V2x for INV2. The corresponding time durations of V1x, V2y, V1y, and V2x are represented by t1x, t2y, t1y, and t2x, respectively.
Table 4.1. Time distributions of voltage vectors for the dual inverter
The synthesis process of the reference voltage vector in sector I for three different regions is also elaborated in Fig. 4.2 as an example. Each inverter provides two non-zero voltage vectors, i.e. V1x and V1y are produced by INV1 while V2x and V2y by INV2. After obtaining tx and ty according to Eq (4.2), and the time durations for each inverter are determined based on the relationship of tx, ty and Ts as illustrated in Tab. 4.1. When Vs is located in region ①, no complementary voltage vectors are needed, thus, t1y and t2x are set to zero. For region ②, t1x is limited to Ts, the complementary voltage vector V2x is provided by INV2, and t2x can be determined according to Eq (4.3).
Available online: http://edupediapublications.org/journals/index.php/IJR/ P a g e | 1021
To reduce the switching frequency during a sampling period, the voltage vector V1x and V2y will be chosen from V1, V3 and V5 according to the located sector of the reference
voltage vector, while the relevant compensatory voltage vectors V1y and V2x can be picked up from V2, V4 and V6. Consequently, the zero vector for both inverters will be V0.
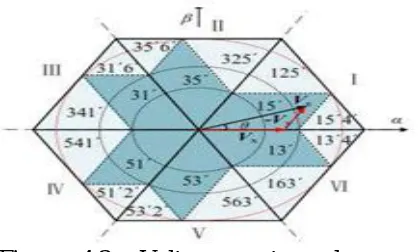
In summary, the voltage vector plane and voltage selection for the dual-inverter is illustrated in Fig.4.3. The number n (n=1,2,3,4,5,6) and n’ represent the vectors Vn provided by INV1 and INV2, respectively. The black dotted circles in Fig.4.3 are the boundaries of different regions, which indicate that how many regions the reference voltage vector Vs will pass through in a sector, and the radii are determined by the two DC source voltages. The maximum linear modulation index region is indicated by the red dotted circle, and the linear modulation region is (Vdc1+Vdc2)/3.
Figure 4.3. Voltage vector plane and Voltage selection for the dual-inverter
According, take sector I as an example: for different regions, the voltage vector switching sequences during a sampling
period for each inverter are illustrated in Figs. 4.5
Figure 4.4. Voltage vector switching sequence for INV1 in sector 1
Fig 4.5. Voltage vector switching sequence for INV2 in sector 1
For region ①, both inverters work in switching mode, as shown in Fig. 4.4(a) and Fig. 4.5(a). When the reference voltage vector is located in region②, INV1 works in clamping mode while INV2 works in switching mode, as presented in Fig. 4.4(b) and Fig. 4.5(b). For the case in region ③, INV1 will work in switching mode while INV2 works in clamping mode, as illustrated in Fig. 4.4(c) and Fig. 4.5(c).
Available online: http://edupediapublications.org/journals/index.php/IJR/ P a g e | 1022
shown in Fig. 4.4(b).
Simulation and experiment verification
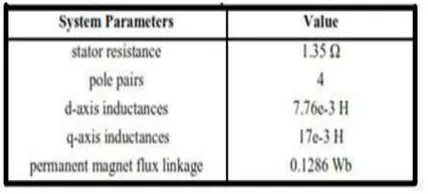
In order to verify the effectiveness of the proposed unified SVPWM algorithm, experiments are implemented on a dual two-level inverter system based on an open winding PM SM . The parameters of the PM SM are listed in Tab. 5.1 the sum of two DC-link voltages Vdc1 and Vdc2 is set to 140 V for all experiments. The experimental setup is shown in Fig. 5.1. Two two-level voltage source inverters are built with SEM IKRON SKM 75GB12T4 insulated gate bipolar transistors (IGBTs), which are driven by SEM IKRON SKHI61 driver boards. A digital signal processor (DSP) TM S320F28335 is adopted to implement the control algorithms and generate gate pulses for IGBTs. A dynamometer controller is adopted as the load of the PM SM .
Table 5.1 M otor parameters
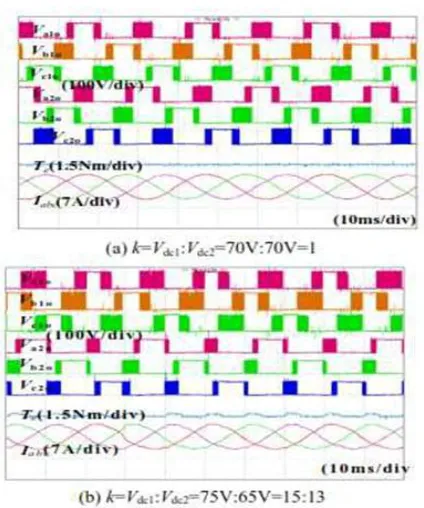
The experimental results are shown in Figs. 5.1-5.2, the waveforms are three-phase pole voltages for INV1 and INV2, the motor output torque, and three-phase current from top to bottom, respectively. The voltage vectors selected in different regions for sector I are shown in the enlarged views of Figs. 5.2(a) and 5.3(a), which are consistent with the theoretical analysis.
When the running speed is 500 r/min, the experimental results for the alternate-inverter PWM switching strategy are shown in Fig. 5.2 , and those for the proposed unified SVM are exhibited in Fig. 5.2. It can be seen that both algorithms exhibit good performance when k=1, as displayed in Figs. 5.3.a and 5.4.a. However, the current and the
torque outputs are distorted even with a small difference between two DC voltages (k=15:13) for the algorithm proposed, as shown in Fig. 5.2 (b), and the system even cannot operate properly with larger voltage difference. But for the proposed algorithm, the performance
Available online: http://edupediapublications.org/journals/index.php/IJR/ P a g e | 1023
Figure 5.2. The alternative-inverter PWM switching strategy [7] at 500 r/min
When the speed is increased to 1000r/min in Fig. 5.4, the output performance is still good under different values of k. It can be concluded from Figs. 5.3-5.4 that the unified SVPWM algorithm can obtain good performance for a wide speed range and the ratio of two DC voltage supplies can be flexible.
Figure 5.3. The unified SVM at 500r/min
Available online: http://edupediapublications.org/journals/index.php/IJR/ P a g e | 1024
To verify the output performance of the proposed method in this letter, the current harmonic profiles for the discontinuous PWM , the alternate-inverter PWM switching strategy and the unified SVPWM are displayed as in Fig.5.4. It can be seen that the unified SVPWM has the best current harmonic profile output among all three modulations.To test the output performance of the unified SVPWM , the fast Fourier transformation (FFT) analysis results of ia under different ratios of DC-link voltages k are tabulated in Table 5.2. It can be seen that the current output performance is satisfying with various value of the ratio k.
Figure 5.5. Current harmonic profiles for three different methods at 500 r/min under k=Vdc1:Vdc2=70V
Table 5.2. Current FFT results under different DC-link voltage ratios
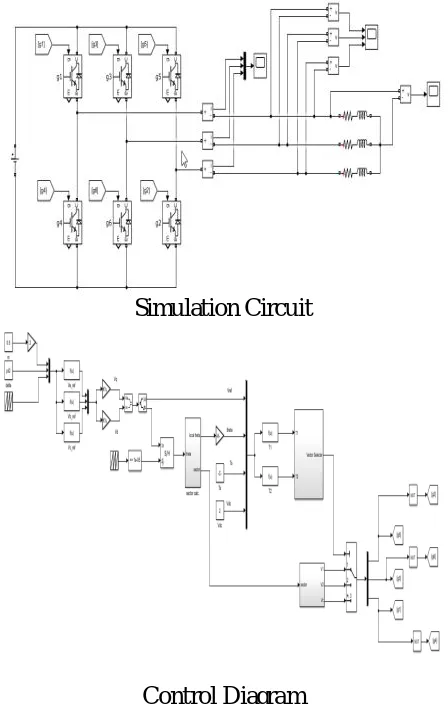
S IMULATION CIRCUIT AND RES ULTS
Simulation Circuit
Control Diagram
Available online: http://edupediapublications.org/journals/index.php/IJR/ P a g e | 1025
Output Current
Output Filtered Voltage
Circuit For FOC Control of M otor
Control Diagram of Model
Output Voltage
Output Current
Available online: http://edupediapublications.org/journals/index.php/IJR/ P a g e | 1026
CONCLUS ION
In this project Simulink models for two techniques have been developed and tested in the MAT-LAB/SIM ULINK environment. The simulation results are compared for nonlinear loads and then it analyzed by computing their total harmonic distortion (THD). Therefore it has been observed that Unified SVPWM is better in reducing harmonics in non-linear load. The current distortion is analyzed for different switching frequencies. Also it has been observed that Unified Space vector is better in reducing THD as compared to Alternate Inverter pulse width modulation for a wide speed range.
The highly nonlinear currents drawn especially by high-power single-phase rectifier loads greatly distort the outputs of Nonlinear Loads. So the permanent magnet synchronous motor drive fed by the Dual inverter with DC supply is used. Potential zero sequence current in the open end winding drive system has to be considered since it causes circulating current in the winding and leads to high current stress of power semiconductor devices and high losses. Zero sequence switching combinations do not produce zero sequence voltage are used to synthesize the reference voltage in existing method. In order to suppress zero sequence current in the open end winding Nonlinear Loads drive unified SVPWM is used. In addition the total switching frequency reduced by 1/3 of that of the dual SVPWM
The simulation results are compared for nonlinear loads and analyzed by computing their total harmonic distortion (THD).It has been observed that Unified SVPWM is better in reducing harmonics in nonlinear load. The current distortion is analyzed for different switching frequencies. It has been observed that
Unified Space vector is better in reducing THD as compared to Alternate Inverter pulse width modulation for a wide speed range. The results of inverter fed induction motor drive systems are presented. It is observed that the by shoot-through operation DC-link voltage has been increased upto 360 Vdc so that inverter can produce 220-230 Vac for 230V induction motor drives to improves its efficiency and performance
REFERENCES
[1] H. Stemmler, “High-power industrial drives,” Proc. IEEE, vol. 82, no. 8, pp. 1266-1286, Aug. 1994.
[2] H. Nian, Y. Zhou and H. Zeng “Zero-sequence current suppression strategy for open winding PM SG fed by semicontrolled converter,” IEE Trans. Power Electron., vol. 31, no.1, pp. 711-720, Jan. 2016.
[3] J.Hong, H. Lee and K. Nam, “Charging method for the secondary battery. [4] C. Patel, R. P. P., A. Dey, R.
Ramchand, K. Gopakumar and . P.Kazmierkowski, “Fast direct torque control of an open-end induction motor drive using 12-sided polygonal voltage space vectors,” IEEE Trans. Power Electron., vol. 27, no. 1 , pp. 400-410, Jan. 2012.
[5] K. R. Sekhar and S. Srinivas, “Discontinuous decoupled PWM s for reduced current.
[6] V. T. Somasekhar, S. Srinivas and K. Gopakkumar, “A space vector based PWM switching scheme for the reduction of common-mode voltages for a dual inverter fed open-end winding induction motor drive,” Power Electron. Specialists Conf., 2005. PESC '05. IEEE 36th, Recife, 2005, pp. 816-821.
Available online: http://edupediapublications.org/journals/index.php/IJR/ P a g e | 1027
strategies for a three-level dual-inverter-fed open-end winding induction motor drive and their comparative evaluation,” IET Electric Power Appl.,vol. 2, no. 1, pp. 19-31, Jan. 2008.
[8] S. Srinivas and K. R. Sekhar, “Theoretical and experimental analysis for current in a dual-inverter fed open-End winding induction motor drive with reduced switching PWM ,”IEEE Trans. Ind. Electron., vol. 60, no. 10, pp.4318-4328, Oct.2013
[9] R. Zhou, R. Raju and L. Garces, “Dual voltage DC generator for compact light-weight ship electrical systems,” 2011 IEEE Electric Ship Technologies Symposium, Alexandria, VA, 2011, pp. 382-387.
[10]B. A. Welchko, “A double-ended inverter system for the combined propulsion and energy management functions in hybrid vehicles with energy storage,”31st Annual Conference of IEEE Industrial Electronics Society, 2005. IECON 2005, Raleigh, NC, 2005, pp. 6 pp. 1401-1406.
[11]S. Pradabane, B. L. Narasimharaju and N. V. Srikanth, “Two-quadrant clamping inverter scheme for three-level open-end winding induction motor drive,” Power Electron., Drives and Energy Syst. (PEDES), 2014 IEEE Int. Conf. on, M umbai, 2014, pp. 1-4. [12]V. T. Somasekhar, S. Srinivas and K.
K. Kumar, “Effect of zero-vector placement in a dual-inverter fed open-end winding induction motor drive with alternate sub-hexagonal center PWM switching scheme,” IEEE Trans. Power Electron., vol.23, no. 3, pp. 1584-1591, M ay 2008.
[13]Q. An, J. Liu, Z. Peng, L. Sun and L. Sun, “Dual space vector control of open-end winding permanent magnet synchronous motor drive fed by dual