Hunting for QCD strings in
e
+e
−-annihilation
MarinaKozhevnikova1,∗,ArmenOganesian2,∗∗, andOlegTeryaev1,∗∗∗
1Joint Institute for Nuclear Research, Dubna, Russia
2Institute of Theoretical and Experimental Physics, Moscow, Russia
Abstract. We develop a new mathematical method of extraction of nonper-turbative corrections in QCD. The main attention is directed to the study of dimension 2 operator and its properties. The ordinary perturbation theory (PT) and analytical perturbation theory (APT) are used. TheD-function is explored in dependence on bothQ2 and Borel parameterM2. It is shown that theC
2 coefficient of the dimension 2 operator is negative and its compatibility to zero depends on choice of PT or APT and can vary in chosen ranges ofM2. The strong (anti)correlation betweenC2 and gluon condensate found previously is confirmed.
1 Introduction
The problem of the existence of an operator with dimension 2 whose contribution to the QCD sum rules [1] is proportional to 1/Q2 and the search for relevant corrections of the
operator product expansion (OPE) have already been studied for quite a long time [2–4]. In the pioneering paper [2] the concept of short strings leading to corrections with dimension 2
was suggested. In the Cornell potential [5]V(r) ≈ −4αs(r)
3r +krthe termkrdescribes the
string potential (connected to the phenomenon of confinement) at short distances leading to the correction∼k/Q2. Note that in local OPE the first correction to thee+e−-annihilation cross-section is∼DGµνGµνE/Q4. The contribution of the operator with dimension 2 to the e+e−data was studied later [4,6] and it was found to be compatible to zero with large errors. The main purpose is to verify whether the operator with dimension 2 exists.
We extend our analysis [7] based on the use of the Adler function, applying the Borel transform by including the consideration of APT [8–15].
2 Construction of the model of the data
We get the separate fits of the data on the following channels:
e+e−→π+π−[16] ;e+e−→2π+2π−[17]; e+e−→π+π−2π0[18–23] ;e+e−→3π+3π−[24] ;
e+e−→2π+2π−2π0[24].
For fitting of each process we use the method of minimization ofχ2-functional. The data
for the processe+e− → π+π−is presented as squared form factor on energy √s. To fit the data we use [7] the generalized [16] model of Gounaris and Sakurai [25].
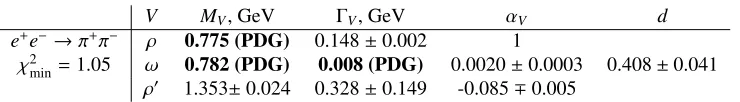
The fitting results are shown in Tab.1. We use the PDG [26] data formρ,mωandΓω. In
calculation ofχ2only statistical errors are used.
Table 1.The fitting results for the processe+e−→π+π−
V MV, GeV ΓV, GeV αV d
e+e−→π+π− ρ 0.775 (PDG) 0.148±0.002 1 χ2
min =1.05 ω 0.782 (PDG) 0.008 (PDG) 0.0020±0.0003 0.408±0.041
ρ0 1.353±0.024 0.328±0.149 -0.085∓0.005
For the cross-sections of the other processes we introduce the model including two or three Gaussian resonances [7]. The fitting results are shown in Tab.2.
Table 2.The fitting results for particulare+e−
-annihilation channels
i Mi, GeV σi, GeV αi
e+e−→2π+2π− 1 1.512±0.003 0.242±0.002 1.560±0.016 χ2
min=1.85 2 2.125±0.016 0.231±0.012 0.458±0.022
3 2.656±0.025 0.808±0.019 0.590±0.014
i Mi, GeV σi, GeV αi
e+e−→π+π−2π0 1 1.786±0.005 0.327±0.003 1.484±0.029
χ2
min=8.45 2 1.070±0.006 0.099±0.005 0.370±0.017
3 1.343±0.004 0.188±0.004 0.916±0.012 e+e−→3π+3π− i Mi, GeV σi, GeV αi
χ2
min=0.62 1 1.789±0.015 0.083±0.012 0.154±0.020
2 2.050±0.014 0.291±0.011 0.433±0.017 e+e−→2π+2π−2π0 i Mi, GeV σi, GeV αi
χ2
min=1.03 1 2.348±0.012 0.331±0.008 1.598±0.085
2 1.740±0.011 0.120±0.009 0.558±0.035
3 Calculation of
R
-ratio and
D
-function
Collecting all the data, we calculate theI=1R-ratio whose theoretical form in the PT and in the APT is:
RPTth/APT(s)=3 2
1+
αPT/APT
s (s) π
. (1)
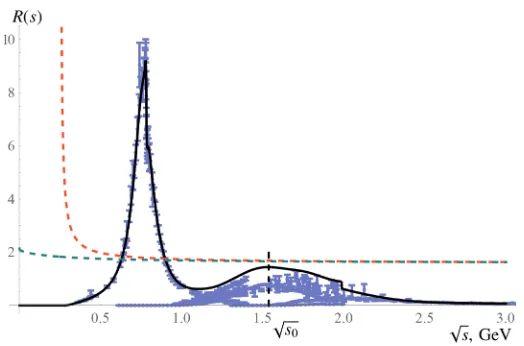
The summation result is presented in Fig. 1 by the black solid curve. Blue dots cor-respond to particular annihilation channels. The R-ratio in the full energy region is
Rexp-th(s)=Rexp(s)θ(s≤s0)+Rth(s)θ(s>s0),wheres0is the continuum threshold, we
cal-culated the values0≈1.542GeV2.
To calculate the error of the fullR-ratio, we find the error of the full cross-section and then in the interval ofsfrom 0 tos0we find:∆R(s)= ∆σe+e−→pions(s)/σe+e−→µ+µ−(s).To the
full1error ofσwe account for systematic ones by adding and subtracting them at each point
sito get the minimal and maximal value ofσ(si). Then we fit each of the three obtained sets (average, minimal and maximum values) and get three fitting curves. In the region ofs
froms0to∞where theR-ratio is described by the theoretical form (1) its error is neglected.
1The contribution of the statistical errors is very small since it is proportional to 1/N
Figure 1. The fullR-ratio (Rexp) in dependence on √sat√s≤3 GeV (black), the experimental data (blue dots), the theoretical representationRth(s) in the PT (red, dashed) and in the APT (blue, dashed). s0≈1.542GeV2
There exist two ways to write down D-function, dispersional: Dexp(Q2) =
Q2R4∞m2π
Rexp-th(s)ds
(s+Q2)2 ,and by PT and OPE:DPT+OPE(Q 2)= 3
2 1+
αs(Q2) π +
P
n≥1Γ(n)
C2n
Q2n
,
and similarly for APT withαs(Q2) → As(Q2) andC2n →C˜2n, in the present work we use three first corrections. The factorΓ(n) is introduced in order to have the simple expression for Borel transform ofD-function.
The running coupling in one-loop approximation has the form: αs(Q2) = 4π
b0
1
ln(Q2/Λ2).
Hereb0=11−2Nf/3 is the first coefficient of theβ-function expansion andΛis the QCD scale parameter. Note thatαs(Q2) has the unphysical singularity atQ2= Λ2. In the
frame-work of APT the running coupling reads: As(Q2) = 4π
b0 1
ln(Q2/Λ2 APT)
− Λ
2 APT
Q2−Λ2 APT .One
can see that the additional term in this expression removes the singularity.
4 The Borel transform of
D
-function and sum rules
The Borel transformed forms of theD-function2, dispersional and by OPE, are:
ˆ
BQ2→M2[Dexp(Q2)]= Φexp(M2)= Z ∞
0
Rexp-th(s)
1− s M2
e−s/M2 ds
M2, (2)
ˆ
BQ2→M2[DPT+OPE(Q2)]= ΦPT+OPE(M2)=
3 2 ˆ
BQ2→M2[αs(Q2)]
π +
3 2
C2 M2 +
C4
M4 +
C6
M6
,
and similarly for APT withαs(Q2)→ As(Q2) andC
2n →Ce2n.
Equating the two forms of the Adler function, we get the sum rules for PT and APT. The error ofΦ(M2),∆Φ(M2), can be calculated using formula (2) through the error of the
R-ratio,∆R(s):∆Φ(M2)=Rs0
0 ∆R(s)
1−Ms2
e−s/M2 ds
M2.
5 Analysis of the sum rules and extraction of the condensates
The coefficientsC2,C43are extracted from obtained sum rules using theχ2-minimization:
χ2(C 2,C4)=
1
Nd.f.
N
X
n=1
Φexp(M2n)−ΦPT(APT)+OPE(M2n;C2,C4)
2
∆ Φexp(M2n)2
, (3)
whereNd.f.=N−dis the number of degrees of freedom,Nis the number of points,d=2 is
the number of varying parameters. To explore the dependence on the squared Borel massM2, we consider the different ranges of M2 obtained by dividing the full range by equidistant points. We perform theχ2-minimization on each range. We implement this method for PT and APT.
The results for PT and APT with Λ =0.25 GeV are shown in Tabs. 3 and 4
consequently and in Fig. 2. The main qualitative feature of all received results is the strong (anti)correlation between C2 and gluon condensate (g.c.), expressed as
g.c.(GeV4)=A(GeV2)·C2(GeV2)+B(GeV4), marked previously in our work [7]. One can
see that at oneσ-level our results for standard local gluon condensate are compatible with that from [1,27,28].
Table 3.The fitting results for different intervals ofM2in PT withΛ =0.25 GeV. In the fifth column theσ-level whereC2=0 is shown. In the sixth column the (anti)correlation between the gluon
condensate andC2is shown
Range ofM2, GeV2 C2, GeV2 <αsGGπ >, GeV4 χ2 σ-level (Anti)correlation
[10/20, 160/20] -0.093∓0.054 0.025±0.008 0.758 3 −0.153C2+0.011
[11/20, 120/20] -0.076∓0.052 0.023±0.008 0.553 3 −0.154C2+0.011
[12/20, 100/20] -0.065∓0.052 0.021±0.008 0.406 2 −0.154C2+0.011
[13/20, 90/20] -0.058∓0.053 0.020±0.008 0.323 2 −0.154C2+0.011
[14/20, 80/20] -0.052∓0.053 0.019±0.008 0.265 1 −0.155C2+0.011
[15/20, 70/20] -0.047∓0.052 0.018±0.008 0.212 1 −0.155C2+0.011
[16/20, 60/20] -0.042∓0.051 0.017±0.008 0.156 1 −0.155C2+0.011
[17/20, 50/20] -0.037∓0.048 0.016±0.007 0.097 1 −0.156C2+0.011
[18/20, 40/20] -0.032∓0.044 0.016±0.007 0.041 1 −0.156C2+0.011
[19/20, 30/20] -0.027∓0.036 0.015±0.006 0.005 1 −0.156C2+0.011
To compare the method of Borel transform with the standard analysis ofD-function, we get the D-function in dependence ofQ2 with the parametersC2andC4 obtained using (3)
in range 0.5 GeV2≤M2≤8 GeV2. The results are shown in Fig.3. The OPE curve is in
reasonable agreement with dispersion curve atQ≥1 GeV.
6 Results
The model of the data one+e−-annihilation is constructed, the R-ratio and D-function are calculated, the Borel transform is applied, the condensates are extracted.
The PT and APT approaches are compared and it is shown that the contribution of short string is closer to zero for APT.
The observed earlier (anti)correlation between short string and gluon condensate is con-firmed.
3We fix the coefficientC
6 calculating quark condensate [1] as in work [27]: C6 = −448π
3
27 αshqq¯ i 2 ≈
Table 4.The fitting results for different intervals ofM2in APT withΛ =0.25 GeV. In the fifth column theσ-level whereCe2=0 is shown. In the sixth column the (anti)correlation between the gluon
condensate andCe2is shown
Range ofM2, GeV2
e
C2, GeV2 <αsGGπ >, GeV4 χ2 σ-level (Anti)correlation
[10/20, 160/20] -0.067∓0.053 0.026±0.008 0.723 2 −0.159Ce2+0.016
[11/20, 120/20] -0.048∓0.053 0.023±0.008 0.508 1 −0.159Ce2+0.016
[12/20, 100/20] -0.036∓0.054 0.021±0.009 0.368 1 −0.159Ce2+0.016
[13/20, 90/20] -0.028∓0.057 0.020±0.009 0.296 1 −0.159Ce2+0.016
[14/20, 80/20] -0.022∓0.058 0.019±0.009 0.244 1 −0.159Ce2+0.016
[15/20, 70/20] -0.017∓0.059 0.018±0.009 0.195 1 −0.159Ce2+0.016
[16/20, 60/20] -0.012∓0.058 0.017±0.009 0.142 1 −0.159Ce2+0.016
[17/20, 50/20] -0.006∓0.055 0.017±0.009 0.086 1 −0.160Ce2+0.016
[18/20, 40/20] -0.000∓0.051 0.016±0.008 0.035 1 −0.160Ce2+0.016
[19/20, 30/20] 0.006∓0.045 0.015±0.007 0.004 1 −0.160Ce2+0.016
Figure 2.The regions ofχ2≤χ2 min+1,χ
2≤χ2 min+2,χ
2≤χ2
min+3 for PT (left panel) and APT (right panel) with the dependence of the gluon condensate onC2withΛ =0.25 GeV
Figure 3.The standard dependence ofD-function onQfor PT (left panel) with received values ofC2 andC4(blue) and for APT (right panel) withCe2andCe4(magenta) and dispersion curves (black) with taking into account dominant systematic error (statistic error is negligible)
The standard dependence D(Q2) with the received parametersC
2 andC4 is in a good
Acknowledgments. We are indebted to O.P. Solovtsova, D.V. Dedovich for useful dis-cussions. The work of O.T. was supported by RFBR grant 18-02 01107.
References
[1] M. A. Shifman, A. I. Vainshtein and V.I. Zakharov, Nucl. Phys. B147, 385 and 448 (1979)
[2] K.G. Chetyrkin, S. Narison, V.I. Zakharov. Nucl. Phys. B550, 353 (1999) [3] S. Narison, V.I. Zakharov. Phys. Lett. B679, 355 (2009)
[4] S. Bodenstein, C.A. Dominguez, S.I. Eidelman, H. Spiesberger, K. Schilcher. JHEP 1201, 039 (2012)
[5] E. Eichten, K. Gottfried, T. Kinoshita, J. B. Kogut, K. D. Lane and T. M. Yan, Phys. Rev. Lett.34, 369 (1975). Erratum: [Phys. Rev. Lett.36, 1276 (1976)]
[6] H. Spiesberger, Mod. Phys. Lett. A28, 1360009 (2013)
[7] M. E. Kozhevnikova, A. G. Oganesian and O. V. Teryaev, EPJ Web Conf. 138, 02006 (2017)
[8] V. L. Khandramai, R. S. Pasechnik, D. V. Shirkov, O. P. Solovtsova and O. V. Teryaev, Phys. Lett. B706, 340 (2012)
[9] O. P. Solovtsova, Nonlin. Phenom. Complex Syst.17, 445 (2014)
[10] D. V. Shirkov and I. L. Solovtsov, Phys. Rev. Lett.79, 1209 (1997); K. A. Milton and I. L. Solovtsov, Phys. Rev. D55, 5295 (1997)
[11] D. V. Shirkov and I. L. Solovtsov, Theor. Math. Phys.150, 132 (2007) [12] K. A. Milton and O. P. Solovtsova, Phys. Rev. D57, 5402 (1998)
[13] R. S. Pasechnik, D. V. Shirkov, O. V. Teryaev, O. P. Solovtsova and V. L. Khandramai, Phys. Rev. D81, 016010 (2010)
[14] A. V. Sidorov and O. P. Solovtsova, Nonlin. Phenom. Complex Syst.16, 397 (2013) [15] A. V. Sidorov and O. P. Solovtsova, Phys. Part. Nucl. Lett.14(1), 1 (2017)
[16] L. M. Barkov et al., Nucl. Phys. B256, 365 (1985)
[17] B. Aubert et al. (BABAR Collaboration), Phys. Rev. D71, 052001 (2005) [18] M. R. Whalley, J. Phys. G: Nucl. Part. Phys.29, A1 (2003)
[19] L. M. Kurdadze et al., J. Exp. Theor. Phys. Lett.43, 643 (1986) [20] S. I. Dolinsky et al., Phys. Rep.202, 99 (1991)
[21] M. N. Achasov et al., Preprint BUDKER-INP-2001-34 (2001) [22] B. Bisello et al., Preprint LAL-90-35 (1990)
[23] G. Cosme et al., Nucl. Phys. B152, 215 (1979) [24] B. Aubert et al., Phys. Rev. D73, 052003 (2006)
[25] G. J. Gounaris, J. J. Sakurai, Phys. Rev. Lett.21, 244 (1968)