Genetic Mapping in Xenopus
laevis:
Eight
Linkage Groups Established
Jean-Daniel Graf
Station de Zoologie Expirimentale, Universiti de Geniue, 1224 Chine-Bougeries, Switzerland
Manuscript received April 17, 1989 Accepted for publication June 26, 1989
ABSTRACT
Inheritance of alleles at 29 electrophoretically detected protein loci and one pigment locus (albinism) was analyzed in Xenopus laevis by backcrossing multiply heterozygous individuals generated by inter- subspecies hybridization. Pairwise linkage tests revealed eight classical linkage groups. These groups have been provisionally numbered from 1 to 8 in an arbitrarily chosen order. Linkage group 1
includes ALB-2 (albumin), ADH-I (alcohol dehydrogenase), NP (nucleoside phosphorylase), and a p
(periodic albinism). Linkage group 2 contains ALB-1 and ADH-2, and probably is homeologous to group 1. Linkage group 3 comprises PEP-B (peptidase B), MPI-I (mannosephosphate isomerase),
SORD (sorbitol dehydrogenase), and mIDH-2 (mitochondrial isocitrate dehydrogenase). Linkage group
4 contains GPI-I (glucosephosphate isomerase) and EST-4 (esterase 4). Linkage group 5 contains GPI- 2 and PEP-D (peptidase D). Linkage group 6 comprises ACP-3 (acid phosphatase), sME (cytosolic malic enzyme), and GLO-2 (glyoxalase). Linkage group 7 consists of sSOD-1 (cytosolic superoxide dismutase),
GPD-2 (glycerol-3-phosphate dehydrogenase), mME (mitochondrial malic enzyme), and the sex deter- mining locus. Linkage group 8 includes FH (fumarate hydratase) and TRF (transferrin). Recombina- tion frequencies between linked loci showed differences related to the genomic constitution (parental subspecies) and to the sex of the heterozygous parent. Independent assortment was observed between the duplicate ALB loci. This is true for the duplicate ADH, GLO, and MPZ loci as well, supporting the view that these genes have been duplicated as part of a genome duplication that occurred in the evolutionary history of X . laevis. Comparative analysis of genetic maps reveals a possible conservation of several linkages from the Xenopus genome to the human genome.
X
ENOPUS laevis is widely used as an experimental animal in developmental and molecular biology, and constitutes a model system for the study of ver- tebrate embryogenesis. I t is therefore surprising thatso little effort has been devoted to the task of estab- lishing a genetic map of this organism. Of the nearly
50 developmental mutations described so far, six have been mapped with respect to the centromere (THIB BAUD, COLOMBELLI and MULLER 1984; REINSCHMIDT et al. 1985). In addition, allelic variants of several protein genes have been identified (VONWYL and
FISCHBERG 1980; WOLFF and KOBEL 1985; BURKI
1987) and the sex-determining locus has been local- ized with respect to the centromere (COLOMBELLI, T H I ~ B A U D AND MULLER 1984) and to a linked enzyme locus (GRAF 1989).
Comparative studies of karyotypes (TYMOWSKA and
FISCHBERG 1982) and DNA content ( T H I ~ B A U D and
FISCHBERG 1977) indicate that the various Xenopus
species constitute a polyploid series in the proportions 2:4:8: 12. DNA contents correspond closely, whereas chromosome numbers are multiples of either x = 9 or
x = 10, so that the above series reads in chromosome numbers as 20:40 and 36:72: 108 (KOBEL and D u PASQUIER 1986). This variation in basic number re-
of pagecharges. Thisarticle must therefore be hereby marked “advertisement” T h e publication costs of this article were partly defrayed by the payment in accordance with 18 U.S.C. 9 1734 solely to indicate this fact.
Generics 123: 389-398 (October, 1989)
flects chromosomal rearrangements that took place during the evolutionary history of the genus Xenopus. T h e only diploid species known so far is Xenopus tropicalis (2n = 20). X . laevis (36 chromosomes) is tetraploid with respect to DNA content but must be regarded as a functional diploid in view of the exclu- sive occurrence of bivalents at meiosis (MULLER 1974;
J. TYMOWSKA, personal communication). X. laevis is therefore referred to as “tetraploid-derived.” Molec- ular studies of gene structure and chromosomal ar- rangement have focused so far on X . tropicalis and X . laevis. For instance, the a- and @-globin genes are closely linked and form a single gene cluster in X . tropicalis, whereas X . laevis has two similar clusters, reflecting the genome duplication that occurred in its evolutionary history ( JEFFREYS et al. 1980; HOSBACH, WYLER and WEBER 1983). In contrast, segregation analysis of the four vitellogenin genes in X . laevis
indicated that three of them (A,, A*, and B,) belong to the same classical linkage group, whereas the fourth
(B2) segregates independently (SCHUBIGER and WAHLI
1986). Since X . tropicalis has three vitellogenin genes
(i.e., two closely related type-A and a single type-B gene), the chromosomal arrangement found in X . laevis supports an evolutionary scenario combining gene duplication, genome duplication, and gene elim- ination (SCHUBIGER and WAHLI 1986).
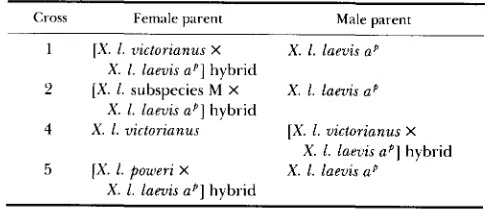
TABLE 1
Origin of backcross progenies used for segregation analysis
cross Female parent Male parent 1 [X. I . victorianus X X . 1. laevis ap
2 [ X . 1. subspecies M X X . 1. laevis ap
4 X . 1. victorianus [ X . 1. victorianus x
5 / X . 1. poweri X X . 1. laevis aP
X . 1. laevis aP] hybrid
X . 1. laevis a # ] hybrid
X . 1. laevis a ? ] hybrid
X . 1. laevis a P ] hybrid
laevis makes it an interesting object for the study of genome organization and chromosomal evolution. It is noteworthy that the karyotype of X . laevis presents a diploid-like arrangement, i.e. morphologically dis- tinct pairs of chromosomes (TYMOWSKA 1977), indi- cating that structural changes have affected the ho- meologous chromosomes. Evidently, the genetic map- ping of duplicate loci and duplicate linkage groups would provide a wealth of information on the evolu- tion of genome architecture in polyploid Xenopus in general.
T h e present study is based on analyses of linkage relationships among 30 genetic loci in four backcross families derived from parents heterozygous at multi- ple loci. These heterozygous individuals were ob-
tained by hybridizing different subspecies of X . laevis
that had different alleles for many of t h e loci exam- ined. It had been established previously that these
hybrids are fertile and show normal pairing of ho- mologs a t meiosis (MULLER 1977).
MATERIALS A N D METHODS
Animals: A series of crosses were made between labora- tory-bred animals of the following subspecies: Xenopus laevis laevis Daudin (L) homozygous for u p (periodic albino mu- tant; HOPERSKAYA 1975), X . lamis victorianus Ah1 (V), X .
laevis new subspecies I (M) originating from southern Ma- lawi, and X . laevis poweri Hewitt (P). Ovulation was artifi-
cially induced and fertilization was done in vitro following the procedure described in GURDON (1 967). First generation hybrids between V and L, M and L, or P and L, were backcrossed to X . laevis laevis homozygous for up or to the other parental subspecies (Table 1). Samples of backcross progenies were reared through metamorphosis. Subadult frogs were killed and dissected. Blood was drawn from the heart into a pipette that had been washed with a 3.2%
solution of tri-sodium citrate and centrifuged to separate the blood cells and plasma. Samples of liver, skeletal muscle, kidney and duodenum were removed and stored at -70” until analyzed.
Electrophoresis: Plasma proteins were separated on 7.5% nondenaturing polyacrylamide gels (PAGE) following the technique described in GRAF and FISCHBERG (1986). The bands corresponding to transferrin were identified using a partial purification procedure given in ROGERS (1973). For
isozyme analysis, tissue samples were homogenized on ice using a ratio of 1 g tissue to 3 ml extraction buffer ( 5 mM
MgC12, 25 mM KCI, 25 m M tris-HCI pH 7.4, with 0.01% 2- mercaptoethanol added just before use). The homogenates were centrifuged at 12,000 X g for 5 min. The supernatants were submitted to horizontal starch gel electrophoresis for 15 hr at 4 ” . Five different buffer systems were used. AC, amine-citrate; electrode: 0.04 M citric acid, adjusted to pH 6.0 with N-(3-aminopropyl)-morpholine, gel: 1/20 dilution of electrode buffer; DT, discontinuous tris-citrate; elec- trode: 0.30 M H3BOs, 0.06 M NaOH; gel: 0.076 M tris, 0.005 M citric acid; TC, continuous tris-citrate; electrode: 0.135 M tris, 0.045 M citric acid; gel: 1/15 dilution of electrode buffer; TG, Tris-glycine; electrode: 0.053 M tris, 0.147 M glycine; gel: 1/4 dilution of electrode buffer; TP, Tris-phosphate; electrode: 0.1 M tris, 0.1 M NaH2P04; gel: 1/20 dilution of electrode buffer. Gels were made using 60 g starch (University of Languedoc, Montpellier, France) and 500 ml gel buffer; 10 PI 2-mercaptoethanol were added before degassing.
Enzymes (Table 2) were stained following the procedures described in HARRIS and HOPKINSON (1976). For ACP, the substrate was 4-methylumbelliferyl phosphate. For EST, a mixture of a-naphthyl acetate and a-naphthyl propionate was used. The substrates for peptidases were Leu-Gly-Gly for PEP-B and Phe-Pro for PEP-D.
Nomenclature: Many enzymes occurred as multiple iso- zymes. When mitochondrial and supernatant forms oc- curred (BURKI 1987; GRAF 1989), they were distinguished by the prefix “m” or “s” as, for example, mME and sME. In other cases, isozymes were numbered so that the most anodal form was designated “ 1 ,” e.g., GPI-1 and GPI-2. Isozymes of LDH and CK were named according to previ-
ously established nomenclature (WOLFF and KOBEL 1982; BURKI 1985). Allelic variants of each locus were assigned small letters, so that the most anodal allozyme was desig- nated by “a.”
Data analysis: Phenotypic ratios in each backcross family were examined for agreement with Mendelian segregation ratios and independent assortment of loci. Contingency chi- square statistics were used to test for the independent as- sortment of pairs of loci. Estimates of recombination frac- tions and their standard errors were calculated according to SERRA (1965).
RESULTS
Electrophoretic phenotypes of protein loci: Most of the 21 proteins analyzed in this study occurred as multiple isozymes showing various levels of tissue spec- ificity. Evidence for the genetic control of multiple isozymes by separate loci was provided by the heritable variation in one form independently of the others.
TABLE 2
List of polymorphic proteins used for linkage analysis
Enzyme or blood protein Abbreviation EC No. Buffef Tissue used
Acid phosphatase ACP 3.1.3.3 T P Kidney
Aconitase ACO 4.2.1 .3 T G Kidney, muscle
Albumin ALB PAGE Plasma
Alcohol dehydrogenase ADH 1.1.1.1 DT Liver
Creatine kinase CK 2.7.3.2 AC Kidney, muscle
Esterase EST 3.1.1.1 TG, DT Liver
Fumarate hydratase FH 4.2.1.2 TG Liver, muscle
Glucosephosphate isomerase GPI 5.3.1.9 TG, AC Kidney, liver, muscle
Glycerol-3-phosphate dehydrogenase GPD 1.1.1.8 AC Muscle
Glyoxalase 1 GLO 4.4.1.5 TG Liver, muscle
lsocitrate dehydrogenase 1 DH 1.1.1.42 T P Kidney, muscle
Lactate dehydrogenase LDH 1.1.1.27 T P Kidney, liver
Malic enzyme ME 1.1.1.40 AC Kidney, muscle
Mannosephosphate isomerase MPl 5.3.1.8 T G Muscle
Nucleoside phosphorylase NP 2.4.2.1 T G Kidney, liver
Peptidase B PEP-B 3.4.3.1 DT Liver
Peptidase D PEP-D 3.4.3.1 Ai3 Kidney, duodenum
6-Phosphogluconate dehydrogenase PGD 1.1.1.44 AC Kidney, muscle
Sorbitol dehydrogenase SORD 1.1.1.14 TP, DT Kidney, liver
Superoxide dismutase SOD 1.15.1.1 TC, DT Liver
Transferrin TRF PAGE Plasma
' The buffer systems used for electrophoresis are described in text.
+
0 0
-
1 2 3 4 5
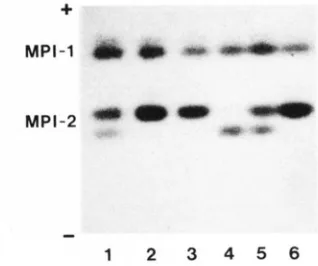
FIGURE 1 .-Electrophoretic patterns of fumarate hydratase. The
FH genotypes are: (1)-(3) alb; (4) b / b ; (5) ala. Liver homogenates were run in a starch gel using a tris-glycine (TG) buffer system.
+
GLO-1<
GLO-21
I
1
1 2 3 4
-
FIGURE 2.-Electrophoretic patterns of glyoxalase. The GLO-I genotypes are: (1)-(4) ala. The GLO-2 genotypes are: ( I ) c l e ; (2) c/
d ; (3) c/c; (4) ele. Liver homogenates were run in a starch gel using a tris-glycine (TG) buffer system.
mogenates, as already reported by WFSOLOWSKI and LYERLA (1983). T h e isozyme with higher staining intensity and higher anodal mobility was designated ADH-1. Although heterozygotes for either ADH-1 or
ADH-2 showed three-band phenotypes, attesting to
the dimeric structure of these isozymes, no heterodi- mer could be observed between ADH-1 and ADH-2. Creatine kinase occurred as four isozymes with well-
+
,..,..;,
-
1 2 3 4 5
FIGURE 3.-Electrophoretic patterns of mitochondrial isocitrate dehydrogenase. The mIDH-2 genotypes are: (1)-(4) b / b ; (5) alb. Kidney homogenates were run in a starch gel using a tris-phosphate (TP) buffer system.
+
MPI-1
11
m
-
--
-
1 2 3 4 5 6
FIGURE 4.-Electrophoretic patterns of mannosephosphate iso- merase. The MPI-I genotypes are: (1)-(6) ala. The MPI-2 geno- types are: (1). ( 5 ) blc; (2), (3), (6) b l b ; (4) c/c. Muscle homogenates were run in a starch gel using a tris-glycine (TG) buffer system.
Graf
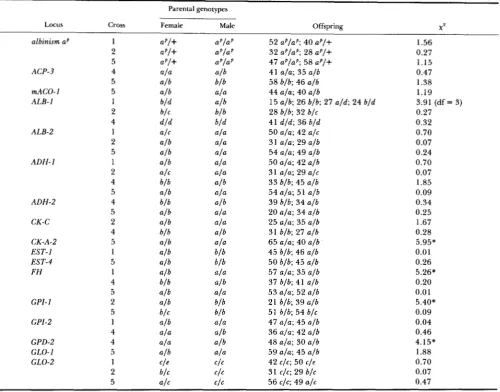
TABLE 3
Single-locus segregation at each of 30 genetic loci in crosses 1,2,4 and 5
Parental genotypes
Locus Cross Female Male Offspring X P
albinism ap
ACP-3
mACO-1 ALB-I
ALB-2
ADH-1
ADH-2
CK-C
CK-A-2
EST-1 EST-4 FH
GPI-1
GPI-2
GPD-2 GLO-1 GLO-2
1 2 5 4 5 5 1 2 4 1 2 5 1 2 4 5 4 5 2 4 5 1 5 1 4 5 2 5 1 4 4 5 1 2 5
52 aP/aP; 40 aP/+ 32 a P / a P ; 28 aP/+ 47 ap/aP; 58 aP/+ 41 a l a ; 35 a l b 58 blb; 46 a l b 44 a l a ; 40 a l b
15 a l b ; 26 blb; 27 a l d ; 24 bld 28 blb; 32 b/c
41 d l d ; 36 bld 50 a l a ; 42 a l c 31 a l a ; 29 a l b 54 a l a ; 49 a l b 50 a l a ; 42 a l b 31 a l a ; 29 a / c 33 blb; 45 a l b 54 a l a ; 51 a l b 39 blb; 34 a l b 20 a l a ; 34 a l b 25 a l a ; 35 a l b 31 blb; 27 a l b 65 a l a ; 40 a / b 45 blb; 46 a l b 50 blb; 45 a l b 57 a l a ; 35 a l b 37 blb; 41 a l b 53 a l a ; 52 a l b 21 blb; 39 a / b 51 blb; 54 blc 47 a l a ; 45 a l b 36 a l a ; 42 a l b 48 a l a ; 30 a l b 59 a l a ; 45 a l b 42 cIc; 50 c/e
31 clc; 29 blc 56 clc: 49 a l c
1.56 0.27 1.15 0.47 1.38 1.19 3.91 (df = 3) 0.27 0.32 0.70 0.07 0.24 0.70 0.07 1.85 0.09 0.34 0.25 1.67 0.28 5.95* 0.01 0.26 5.26* 0.20 0.01 5.40* 0.09 0.04 0.46 4.15* 1.88 0.70 0.07 0.47
*
Significant deviation from the expected Mendelian ratio, at P < 0.05 level with df = 1.** sgnificant at P < 0.01 level with df = 1.
band in stomach and eye homogenates, probably is a mitochondrial CK (WOLFF and KOBEL 1985). T h e genetic control of the muscle-specific CK isozymes is unusual in that the CK-A-2’ isozyme is a heterodimer consisting of a CK-A-1 subunit and a second subunit (CK-A-2) that apparently does not form any detectable homodimer (BURKI 1985; ROBERT and KOBEL 1988). Therefore, genotypes at the CK-A-2 locus can only be deduced from the simultaneous examination of the CK-A-1 and CK-A-2’ isozymes. Gels stained for ester- ase activity revealed four isozymes designated EST-1, EST-2, EST-3 and EST-4 by order of decreasing anodal mobility. Fumarate hydratase (FH) occurred as one band in liver and muscle homogenates (Figure
1). Glucosephosphate isomerase occurred as three iso- zymes, i . e . , two homodimers and one heterodimer, in most tissues. GPI-1 was the major isozyme in skeletal muscle and heart muscle, whereas GPI-2 was predom- inant in liver and kidney. Zymograms of glycerol-3-
Parental genotypes
Locus Cross Female Male Offspring x4
mIDH-2
LDH-C
sME
mME
MPI- 1
MPI-2
N P PEP-B PEP-D
PGD-2 SORD
sSOD- 1
TRF
1 4 1 2 4 5 1 2 4 5 1 2 4 5 1 2 5 1 4 5 1 2 1 4 5 1 4 5 1 4 5 1 2 4
5
33 blb; 47 a l b 22 a l a ; 36 a l b 50 blb; 41 a / b 34 blb; 26 a l b 36 a l a ; 42 a l b 52 a l a ; 48 a l b 44 c/c; 48 a l c 22 C / C ; 38 a l c
41 a l a ; 37 a l c 57 c/c; 48 a l c 53 a l a ; 39 a l b 24 a l a ; 36 a l b 36 blb; 42 a l b 4 3 a l a ; 52 a l c 39 a l a ; 53 a l b 27 a l a ; 33 a/c 42 a l a ; 63 a l c 48 blb; 44 a l b 38 a l a ; 40 a / b 48 blb; 57 b/c 51 a l a ; 41 a l b 28 a l a ; 32 a l b 48 a l a ; 44 a l b 31 616; 47 a l b 54 blb; 51 a l b 38 blb; 54 blc 26 c/c; 52 b/c 43 blb; 62 a l b 4 3 a l a ; 49 a l b 50 b/b; 28 a l b 58 a l a ; 47 a l b 5 1 GIG; 4 1 c l d
23 c l c ; 37 cld
20 alc; 16 a / & 23 c l d ; 18 d l d
53 c l c ; 48 blc
2.45
0.89 1.07 0.46 0.16 0.17 4.27* 0.20 0.77 2.13 2.40 0.46 0.85 2.13 0.60 4.20* 0.17 0.05 0.77
0.27 0.17
0.09
8.67**
3.44 0.39
1.15 3.38
1
.oa
3.28
2.78
7.38**
1 .oa 3.26 1.39 (df = 3) 0.25
(sME) and one mitochondrial (mME), in most tissues (BURKI 1987; C R A F 1989). T h e mitochondrial ME usually was the most anodal of the two. Mannose- phosphate isomerase occurred as two isozymes, con- trolled by two separate loci, i e . , MPI-1 and MPI-2, in heart and skeletal muscle (Figure 4). Zymograms of nucleoside phosphorylase (NP) from liver and kidney had one band in homozygotes and four bands in heterozygotes. Gels stained for peptidase B (PEP-B) and peptidase D (PEP-D) showed one band in homo- zygotes and three in heterozygotes. 6-Phosphogluco- nate dehydrogenase occurred as three isozymes con- trolled by two loci, i.e., PGD-1 and PGD-2; the PGD- 2 isozyme appeared to be more active than PGD-1 in all tissues tested. Zymograms of sorbitol dehydrogen- ase (SORD) from liver and kidney had a single band in homozygotes and five bands in heterozygotes. Su- peroxide dismutase occurred as four bands; the three most anodal bands were cytosolic isozymes controlled by two loci, i.e., sSOD-1 and sSOD-2, whereas the
fourth band was the mitochondrial isozyme (BURPJ
1987). Transferrin (TRF) occurred as one band 'in homozygotes and two bands in heterozygotes.
Inheritance of electrophoretic variants: For e:ach cross and each polymorphic locus, the segregaticm of parental alleles was analyzed and tested for confo rmity to expected Mendelian ratios for disomic inheri,tance. Most crosses were of the test cross type, and thlerefore were expected to yield homozygotes and heterozy- gotes in a proportion of 1: 1. In some CaFies, both parents were heterozygous but had different alleles, yielding four genotypic classes with an exprxted ratio of 1:l:l:l.
T h e segregation data presented in TabLe 3 show an overall agreement with Mendelian ratim. In a few cases, however, the observed numbers iliverge signif- icantly from the expected. There is an apparent defi- ciency of heterozygotes for CK-A-2 in cross 5 ( P
<
TABLE 4
List of loci used for pairwise linkage tests in crosses 1, 2, 4 and 5
Characteristics of informative parent
Genomic constitu-
Cross Sex tion“ Heterozygous loci
1 f VL up, ALB-1, ALB-2, ADH-I, EST-1, FH, GPI-2,
GLO-2, mlDH-2, LDH-C, sME, mME, MPI-
TRF.
I , MPI-2, NP, PEP-D, SORD, SSOD-1,
2 f ML up, ALB-1, ALB-2, ADH-I, CK-C, GPI-I,
GLO-2, LDH-C, sME, mME, MPI-1, PEP-B, TRF.
4 m VL ACP-3, ALB-I, ADH-1, ADH-2, CK-C, FH,
GPI-2, GLO-2, GPD-2, mIDH-2, LDH-C, sME, mME, MPI-2, PEP-D, SORD, sSOD-I, TRF.
5 f PL up, ACP-3, mACO-I, ALB-2, ADH-I, ADH-2,
GPI-I, LDH-C, sME, mME, MPI-1, MPI-2, CK-C, CK-A-2, EST-4, FH, GLO-I, GLO-2,
PGD-2, SORD, SSOD-1, TRF.
‘ Genomic constitution is indicated by the abbreviations of the two parental subspecies, female listed first; L, laevis; M, subspecies 1; P, poweri; V, victorianus.
0.01). In contrast, there is an apparent excess of heterozygotes for GPI-1 in cross 2 ( P < 0.025), for sME in cross
2
( P < 0.05), for MPI-1 in cross 5 ( P<
0 . 0 5 ) , and for SORD in cross 4 ( P < 0.01). In sum, eight of 70 tests made for single-locus segregation showed significant departure from the expected Men- delian ratio. This proportion can be considered rela- tively low, since three to four departures at a signifi- cance level of 0.05 would be expected by chance alone. Therefore, it may be assumed that meiosis in ,the four Xenopus hybrids tested proceeded normally.Linkage analysis: In the four crosses analyzed, pal.irwise linkage tests of 13 to 22 loci were performed (T‘lble 4). In most pairwise comparisons, four geno- typtts were found among the offspring. Since the linka-ge phase (coupling or repulsion) in the hetero- ZygoLIs parent was known, the genotypes in the prog- eny could be identified unambiguously as parental or recomtrinant. T h e offspring with either parental gen- otype w$ere grouped in a single “parental” class, and those wit,h either recombinant genotype were grouped in a “reccrmbinant” class. Contingency table analyses were perfcxmed based on numbers expected for in- dependent assortment. For evidence of linkage, the significance level of P
<
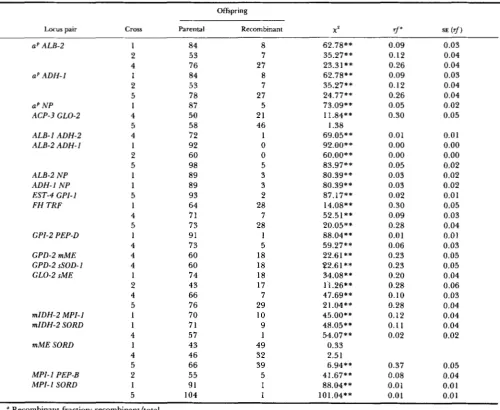
0.01 was required.Of 361 pa.irs of loci tested for linkage, 20 showed significant dewiation from independent assortment in at least one of ,the crosses examined. T h e contingency table analyses s f these 20 pairs of loci for all crosses in which they w’ere tested are presented in Table 5. In addition, the linkage analyses for four pairs of
duplicated loci are presented in Table 6.
There is an overall agreement between the four crosses concerning the status of linkage or independ- ence of most pairs of loci. Nevertheless, two excep- tions have to be pointed out. First, mME and SORD
showed joint segregation in cross 5 (recombinant frac- tion 0.37) but independent assortment in crosses 1 and 4 (Table 5). Since the evidence for iinkage of these two loci is tenuous, mME and SORD are conserv- atively considered unlinked. Secondly, ACP-3 and
GLO-2 showed joint segregation in cross 4 (recombi- nant fraction 0.30) and independent assortment in cross 5. In this case, linkage is strongly supported by unambiguous data indicating that ACP-3 and GLO-2
are both linked to sME (Table 5).
From the data presented in Table 5 , eight linkage groups were defined, comprising 23 genetic loci (Fig- ure 5). It is worth noting that large discrepancies occur among the various crosses with respect to recombi- nation frequencies between linked loci. These differ- ences appear to be associated with the sex of the heterozygous parent and with its genomic constitution (parental subspecies).
For convenience, the linkage groups have been numbered from 1 to 8 in an arbitrarily chosen order. Linkage group 1 includes four loci, albumin-2, alcohol dehydrogenase-1 , nucleoside phosphorylase, and periodic albinism. T h e recombination frequencies were ALB-2, 0%, ADH-1, 3%, N P , 5%, up in a VL female (hybrid of X . laevis victorianus and X . laevis laevis), a n d A L B - 2 , 5 % , A D H - I , 26%, u p in a PL female (hybrid of X . laevis poweri and X . laevis laevis). Linkage group 2 includes ALB-1 and ADH-2, and probably is homeologous to linkage group 1.
Linkage group 3 comprises four loci, peptidase B,
mannosephosphate isomerase- 1, sorbitol dehydrogen- ase, and mitochondrial isocitrate dehydrogenase-2. The position of PEP-B with respect to SORD and
mIDH-2 has not been determined. T h e recombination
frequencies were: M P I - I , 1 %, SORD, 1 1 %, mIDH-2 in a VL female, and SORD, 2%, mIDH-2 in a VL male.
Linkage group 4 includes glucosephosphate isomer- ase-1 (GPI-I) and esterase-4 (EST-4), with recombi- nation frequency 2% in a PL female. Linkage group 5 contains glucosephosphate isomerase-:! (GPI-2) and peptidase D (PEP-D); their recombination frequency was 1 % in a VL female and 6.4% in a VL male.
Linkage group 6 comprises three loci, acid phos- phatase-3, cytosolic malic enzyme, and glyoxalase-2, with recombination frequencies ACP-3, 22%, sME,
l o % , GLO-2 in a VL male, and ACP-3, 34%, sME,
28%, GLO-2 in a PL female.
Linkage group
7
contains four loci, cytosolic super- oxide dismutase-1 , glycerol-3-phosphate dehydrogen- ase-2, mitochondrial malic enzyme, and sex (data inTABLE 5
Classical linkages detected in painvise comparisons between loci tested in this study
Locus pair ap ALB-2
ap ADH-I
aP N P ACP-3 GLO-2
ALB-1 ADH-2 ALE-2 ADH-I
ALE-2 NP ADH-I NP EST-4 GPI-1 FH TRF
GPI-2 PEP-I)
GPD-2 mME GPD-2 sSOD-1 GLO-2 sME
mIDH-2 MPI-I mIDH-2 SORD
mME SORD
MPI-1 P E P E MPI-I SORD
Cross 1 2 4 1 2 5 1 4 5 4 1 2 5 1 1 5 1 4 5 1 4 4 4 1 2 4 5 1 1 4 1 4 5 2 1 5
Offspring
Parental Recombinant X *
84 8 62.78**
53 7 35.27**
76 27 23.31**
84 8 62.78**
53 7 35.27**
78 27 24.77**
87 5 73.09**
50 21 11.84**
58 46 1.38
72 1 69.05**
92 0 92.00**
60 0 60.00**
98 5 83.97**
89 3 80.39**
89 3 80.39**
93 2 87.17**
64 28 14.08**
71 7 52.51**
73 28 20.05**
91 1 88.04**
73 5 59.27**
60 18 22.61**
60 18 ?2.61**
74 18 34.08**
43 17 1'1.26**
66 7 47.69**
76 29 2 1.04**
70 10 45.00**
71 9 48.05**
57 1 54.07**
43 49 0.33
46 32 2.51
66 39 6.94**
55 5 41.67**
91 1 88.04**
104 1 101.04**
+f" SE ( r f f
0.09 0.03
0.12 0.04
0.26 0.04
0.09 0.03
0.12 0.04
0.26 0.04
0.05 0.02
0.30 0.05
0.01 0.01
0.00 0.00
0.00 0.00
0.05 0.02
0.03 0.02
0.03 0.02
0.02 0.01
0.30 0.05
0.09 0.03 0.28 0.04
0.01 0.01
0.06 0.03
0.23 0.05
0.23 0.05
0.20 0.04
0.28 0.06
0.10 0.03
0.28 0.04
0.12 0.04
0.1 1 0.04
0.02 0.02
0.37 0.05
0.08 0.04
0.01 0.01
0.01 0.01
a Recombinant fraction: recombinant/total.
**
Significant at P < 0.01 level with df = 1TABLE 6 sex-determining locus with respect to sSOD-1 and
Linkage analysis of duplicate loci
Offspring
Locus pair Cross Parental Recombinant x'
ALB-I ALE-2 1 43 49 0.39
2 27 33 0.60
ADH-I ADH-2 4 42 31 1.66
5 34 30 0.25
GLO-I GLO-2 5 53 51 0.04
MPI-I MPI-2 1 51 41 1.09
5 47 58 1.15
GPD-2 has not been established.
Linkage group 8 includes fumarate hydratase ( F H )
and transferrin (TRF); their recombination frequency varied from 9% in a VL male to 30% in a VL female.
T h e linkage groups here established cannot for the time being be associated with individual chromo- somes.
It is worth noting that linkage group 4 has not been tested for independent assortment with linkage group
5. Similarly, some of the eight unassigned genetic loci (mACO-1, CK-C, CK-A-2, EST-1, GLO-1, LDH-C, MPI-2, PGD-2) were not tested in all possible combi-
sSOD-1, 23%, GPD-2, 23%, mME in a VL male. T h e mean recombination frequency between mME and sex
nations (Table.3).
DISCUSSION
is 6%, based on segregati'on analysis in three females, T h e inheritance results presented in this paper in-
1 2
ALB-2 ALB-1
ADH-1
5 6
sME
28 fPL
10 mVL
GLO-2
3
2 mVL
7
-
&OD- 123 mVL
-
GPD- 123 mVL
6 1 ’
- s e x
J.-D. Graf
4
EST-4
8
F H
30 NL
9 mVL
for linkage analysis of the X . laevis genome. T h e major advantage of using hybrid backcrosses resides in the fact that hybrids are heterozygous at multiple loci, with the consequence that every single cross allows a maximum number of pairwise linkage tests to be performed.
In most cases, the loci showing linkage association in one hybrid combination were found to be linked in other hybrids where they could be tested. However, estimates of recombination frequencies between linked loci showed differences related to the genomic constitution (parental subspecies) and to the sex of the heterozygous parent. For instance, the map distance between ALB-2 and U P was considerably larger in a
PL female ($= 0.26) than in a VL female ($= 0.09). Nevertheless, the same females displayed similar re- combination frequencies for the locus pairs FHITRF
or MPI-IISORD. When a VL male is compared to a
VL female, recombination estimates are greater in the female for three pairs of loci (FHITRF; GLO-2IsME;
mIDH-2ISORD) and greater in the male for one pair
(GPI-2/PEP-D). These results indicate that the prob- ability of recombination, at least in certain segments of the genome, is affected by sex and other genetic differences. Recombination appears to be less fre- quent generally in males than in females, although sex differences are not uniform throughout the genome, and might even occur in opposite directions at differ- ent locations in the genome. Definite evidence for reduced recombination in males has been found in
lTRF
FIGURE 5.-Linkage groups in hybrids between various subspecies of X . laevis. The groups have been numbered from 1 to 8 in an arbitrarily chosen order. Arrows indicate the two possible positions of a locus in a group, when the data were insufficient to determine its exact position. Esti- mated recombination frequencies (in percent) are indicated on the left side of the linkage groups. When different crosses yielded different recombination frequencies, the highest and lowest estimates are given, followed by the sex and subspecies constitution of the hybrid in which they occurred. Subspecies abbreviations are as follows: L, laevis;
M, subspecies I; P, poweri; V, victorianus. (*) indicates an average value based on three crosses (data in GRAF 1989).
other vertebrate species, e.g., in salmonid fish (JOHN-
SON, WRIGHT and MAY 1987) and in man (BARKER et
al. 1987). In their detailed study of human chromo- some 7, BARKER et al. (1987) observed that the male/ female difference in recombination rate was not uni- form throughout the chromosome but was concen- trated in a few intervals. It has been proposed that, when sex differences occur, recombination usually is less frequent in the heterogametic sex (reviewed in
DUNN and BENNETT 1967). T h e preliminary results obtained with X . laevis, a species in which the female is heterogametic (reviewed in GRAF 1989), are not consistent with this hypothesis.
There is compelling evidence, from data on kary- otype and DNA content (THI~BAUD and FISCHBERG
1977), that X . laevis arose by tetraploidization. More- over, the exclusive occurrence of bivalents at meiosis
(MULLER 1974) supports an allotetraploid origin. Mo- lecular studies of globins (HOSBACH, WYLER and WE- BER 1983) and a-actin (STUTZ and SPOHR 1986) have
shown that the genome of X . laevis contains twice as many genes encoding these proteins as the genome of the diploid X . tropicalis. Similarly, the present study provides genetic evidence for the expression of dupli- cate loci coding for serum albumin (ALB), alcohol dehydrogenase (ADH), glucosephosphate isomerase
(GPI), glyoxalase (GLO) and mannosephosphate iso- merase (MPI). Four duplicate pairs (ALB-I/ALB-2;
ADH-IIADH-2; GLO-IIGLO-2; MPI-l/MPI-2) were
Xenopus laevis
cross family, but none of these loci was found to be linked with its duplicate. However, ALB-1 showed close linkage with ADH-2, as did ALB-2 with ADH-1,
suggesting that the entire ALB
-
ADH linkage group has been duplicated. These results (i.e. independent assortment of duplicate loci and duplicate linkage groups) strongly support the view that the greater complexity of the X . laevis genome (as opposed to X . tropicalis) was produced by genome duplication and not by tandem duplications.T h e supposed homology of many enzyme loci throughout the vertebrates allows to compare the genetic maps of closely related as well as distantly related species. For instance, the linkage map of X . laevis (Figure 5 ) can be compared with those of other amphibian species, i . e . , Rana pipiens, Rana berlandieri
(WRIGHT et al. 1983) and Rana nigromaculata ( N I - SHIOKA, OHTANI and SUMIDA 1987), as well as with
the very detailed human gene map (MCKUSICK 1987).
Xenopus linkage groups 1 and
2
(Figure 5): ALB andADH are also linked in R. berlandieri and R. nigroma- culata, and this group includes an albino locus in R. nigromaculata ( N P not mapped in Rana); similarly,
ALB and ADH are syntenic on human chromosome 4 ,
whereas N P is located on chromosome 1 4 . Linkage group 3 (Figure 5): PEP-B and MPI are also linked in
R. pipiens and R. nigromaculata (SORD and mIDH not mapped in Rana); MPI, SORD and mIDH are syntenic on human chromosome 15, whereas PEP-B is located on chromosome 12. Linkage groups 4 and 5 (Figure
5): GPI and PEP-D are also linked in R. berlandieri,
and syntenic on human chromosome 19. Linkage group 6 (Figure 5): GLO and ACP are linked in R. pipiens (sME not mapped in this species); GLO and
sME are syntenic o n human chromosome 6. Linkage group
7
(Figure 5): sSOD is also sex-linked in Rana pipiens: in addition, GPD, “ME-A” and “SOD-B” are linked in R. nigromaculata but it is unclear whether“ME-A” and “SOD-B” designate the cytosolic or mito-
chondrial form of these enzymes. In the human gene map, GPD, mME, and sSOD are located on three different chromosomes. Linkage group 8 (Figure 5):
FH and TRF have not been mapped in Rana; they are not syntenic in the human genome.
In sum, the loci that were tested in both Xenopus and Rana showed similar linkage relationships in these two taxa, suggesting that an important proportion of linkage groups have been conserved between these distantly related anuran genera. More surprising is the apparent conservation of linkages between the Xenopus and the human gene maps. Of eight linkage groups identified in Xenopus, five showed some sim- ilarity with human syntenic groups. It certainly would be premature to make a statement about the signifi- cance of this apparent conservation. T h e elaboration
of a more detailed genetic map of X . laevis should provide new insights as to which of the observed similarities truly reflect persistent ancestral gene ar-
rangements. It is noteworthy that the loci for pepti- dase D (PEP-D) and glucosephosphate isomerase (GPI) were found to be classically linked in all vertebrate taxa where they were tested, e.g., salmonid fish (JOHN- SON, WRIGHT and M A Y 1987), R. pipiens (WRIGHT et al. 1983), X . laevis (this article), mouse (WOMACK
1987), and man (MUKUSICK 1987), suggesting that this linkage relationship has been conserved for more than 300 million years. This example supports the
view that some linkage groups might effectively be stable over very long periods of evolution.
I an1 grateful to H. GLOOR for critically reading the manuscript. I thank BRUNELLA COLOMBELLI, HANS RUWLF KOBEL and CHARLES THIEBAUD for stimulating discussions and encouragement. PATRICE BAATARD, MONIQUE FORNALLAZ and ANDRE SOLARO provided ex- cellent technical assistance. This work was supported by the Swiss National Science Foundation, grant 3.596-0.87.
L I T E R A T U R E C I T E D
BARKER, D., P. GREEN, R. KNOWLTON, J. SCHUMM, E. LANDER, A. OLIPHANT, H. WILLARD, G. AKOTS, V. BROWN, T. GRAVIUS, C. HELMS, C. NELSON, C. PARKER, K. REDICKER, M. RISING,
1987 Genetic linkage map of human chromosome 7 with 6 3 DNA markers. Proc. Natl. Acad. Sci. USA 84: 8006-8010. BURKI, E., 1985 T h e expression of creatine kinase isozymes in
Xenopus tropicalis, Xenopus laevis laevis, and their viable hybrid. Biochem. Genet. 23: 73-88.
BURKI, E., 1987 Comparative analysis of electrophoretic protein phenotypes in the genus Xenopus (Anura: Pipidae). PhD thesis No. 2244, University of Geneva, Switzerland.
COLOMBELLI, B., C. H. THIEBAUD and W. P. MULLER, 1984 Production of WW superfemales by diploid gynogenesis in Xenopus laevis. Mol. Gen. Genet. 194: 57-59.
DUNN, L. C., and D. BENNETT, 1967 Sex differences in recombi- nation of linked genes i n animals. Genet. Res. 9 21 1-220. GRAF, J.-D., 1989 Sex linkage of malic enzyme in Xenopus lamis.
Experientia 45: 194-1 96.
GRAF, J.-D., and M. FISCHRERG, 1986 Albumin evolution in pol- yploid species of the genus Xenopus. Biochem. Genet. 24: 82 1- 837.
GURWN, J. B., 1967 African clawed toads, pp. 75-84 in Methods
in Developmental Biology, edited by N. H . WILT and N. K.
WESSELS. Crowell Company, New York.
HARRIS, H., and D. A. HOPKINSON, 1976 Handbook of Enzyme Electrophoresis in Human Genetics. North Holland, Amsterdam. HOPERSKAYA, 0. A., 1975 T h e development of animals homozy-
gous for a mutation causing periodic albinism (UP) in Xenopus laevis. J. Embryol. Exp. Morph. 34: 253-264.
HOSBACH, H. A., T . WYLER and R. WEBER, 1983 The Xenopus laevis globin gene family: chromosomal arrangement and gene structure. Cell 32: 45-53.
JEFFREYS, A . J., V. WILSON, D. WOOD and J. P. SIMONS, 1980 Linkage of adult a- and @-globin genes in X . laeuis and gene duplication by tetraploidization. Cell 21: 555-564. JOHNSON, K . R., J. E. WRIGHT, JR., and B. MAY, 1987 Linkage
relationships reflecting ancestral tetraploidy in salmonid fish. Genetics 116: 579-591.
KOBEL, H. R., and L. DU PASQUIER, 1986 Genetics of polyploid
Xenopus. Trends Genet. 2: 3 10-3 15.
MCKUSICK, V. A., 1987 The human gene map, pp. 534-597 in
GeneticMups 1987, edited by S. J. O’BRIEN. Cold Spring Harbor Laboratory, Cold Spring Harbor, N.Y.
MULLER, W. P., 1974 “ T h e lampbrush chromosomes of Xenopus
laeuis (Daudin). Chromosoma 47: 283-296.
MULLER, W. P., 1977 Diplotene chromosomes of Xenopus hybrid oocytes. Chromosonla 59: 273-282.
NISHIOKA, M., H. OHTANI and M. SUMIDA, 1987 Chromosomes and the sites of five albino gene loci in the Rana nigromaculata
group. Sci. Rep. Lab. Amphibian Biol. Hiroshima Univ. 9: 1- 52.
REINSCHMIDT, D., J. FRIEDMAN, J. HAUTH, E. RATNER, M. COHEN, M. MILLER, D. KROTOSKI and R. TOMPKINS, 1985 Gene- centromere mapping in Xenopus laevis. J. Hered. 76: 345-347. ROBERT, J., and H. R. KOBEL, 1988 Purification and characterizd- tion of cytoplasmic creatine kinase isozymes of Xenopus laevis.
Biochem. Genet. 26: 543-555.
ROGERS, J. S . , 1973 Protein polymorphism, genic heterozygosity and divergence in the toads Bufo cognatus and B. speciosus.
Copeia 1973: 322-330.
SCHUBIGER, J.-L., and W. WAHLI, 1986 Linkage arrangement in the vitellogenin gene family of Xenopus laeuis as revealed by gene segregation analysis. Nucleic Acids Res. 14: 8723-8734. SERRA, J. A,, 1965 Modern Genetics. Academic Press, London. STUTZ, F., and G. SPOHR, 1986 Isolation and characterization of
sarcomeric actin genes expressed in Xenopus lamis embryos. J. Mol. Biol. 187: 349-361.
T H I ~ B A U D , C. H., and M. FISCHBERG, 1977 DNA content in the genus Xenopus. Chromosoma 59: 253-257.
T H I ~ B A U D , C. H., B. COLOMBELLI and W. P. MULLER, 1984 Diploid gynogenesis in Xenopus laevis and the localiza- tion with respect to the centromere of the gene for periodic albinism ap. J. Embryol. Exp. Morphol. 83: 33-42.
TYMOWSKA, J., 1977 A comparative study of the karyotypes of eight Xenopus species and subspecies possessing a 36-chromo- some complement. Cytogenet. Cell Genet. 18: 165-181. TYMOWSKA, J., and M. FISCHBERG, 1982 A comparison of kary-
otype, constitutive heterochromatin, and nucleolar organizer regions of the new tetraploid species Xenopus epitropicalis Fisch- berg and Picard with those of Xenopus tropicalis Gray (Anura, Pipidae). Cytogenet. Cell Genet. 34: 149-157.
VONWYL, E., and M. FISCHBERG, 1980 Lactate dehydrogenase isozymes in the genus Xenopus: species-specific patterns. J. Exp. Zool. 211: 281-290.
WESOLOWSKI, M. H., and T . A. LYERLA, 1983 Alcohol dehydro- genase isozymes in the clawed frog, Xenopus laevis. Biochem. Genet. 21: 1003-1017.
WOLFF, J., and H. R. KOBEL, 1982 Lactate dehydrogenase of
Xenopus laevis laevis and Xenopus borealis depends on a multiple gene system. J . Exp. 2001. 223: 203-210.
WOLFF, J., and H. R. KOBEL, 1985 Creatine kinase isozymes in pipid frogs: Their genetic bases, gene expressional differences, and evolutionary irnp1ications.J. Exp. 2001. 234: 471-480. WOMACK, J. E., 1987 Comparative gene mapping: A valuable new
tool for mammalian developmental studies. Dev. Genet. 8: 281-293.
WRIGHT, D. A . , C. M. RICHARDS, J. S. FROST, A. M. CAMOZZI and B. J. KUNZ, 1983 Genetic mapping in amphibians. Isozymes Curr. Top. Biol. Med. Res. 10: 287-31 1.