Out of hours workload management: Bayesian inference
for decision support in secondary care
Iker Pereza,∗, Michael Browna, James Pinchina, Sarah Martindalea, Sarah Sharplesb, Dominick Shawc, John Blakeyd
aHorizon Digital Economy Research Institute, The University of Nottingham, Nottingham Geospatial Building, Jubilee Campus, Wollaton Road, Nottingham NG8 1BB, UK. bFaculty of Engineering, The University of Nottingham, Room B25 Coates Building,
University Park, Nottingham NG7 2RD, UK
cFaculty of Medicine & Health Sciences, The University of Nottingham, Room B21 Nottingham City Hospital, Hucknall Road, Nottingham NG5 1PB UK
dDepartment of Clinical Sciences, Liverpool School of Tropical Medicine, Pembroke Place, Liverpool L3 5QA, UK
Abstract
Objective: In this paper, we aim to evaluate the use of electronic technolo-gies in Out of Hours (OoH) task-management for assisting the design of effective support systems in health care; targeting local facilities, wards or specific work-ing groups. In addition, we seek to draw and validate conclusions with relevance to a frequently revised service, subject to increasing pressures.
Methods and Material: We have analysed 4 years of digitised demand-data extracted from a recently deployed electronic task-management system, within theHospital at Night setting in two jointly coordinated hospitals in the United Kingdom. The methodology employed relies on Bayesian inference methods and parameter-driven state-space models for multivariate series of count data.
Results: Main results support claims relating to (i) the importance of data-driven staffing alternatives and (ii) demand forecasts serving as a basis to intel-ligent scheduling within working groups. We have displayed a split in workload patterns across groups of medical and surgical specialities, and sustained as-sertions regarding staff behaviour and work-need changes according to shifts or days of the week. Also, we have provided evidence regarding the relevance of day-to-day planning and prioritisation.
Conclusions: The work exhibits potential contributions of electronic tasking alternatives for the purpose of data-driven support systems design; for schedul-ing, prioritisation and management of care delivery. Electronic tasking
technolo-∗Corresponding author. Iker Perez, Nottingham Geospatial Building, Jubilee Campus,
Wollaton Road, Nottingham NG8 1BB, UK. +44 (0) 754 728 4617.
Email addresses: [email protected](Iker Perez),
[email protected](Michael Brown),[email protected]
(James Pinchin),[email protected](Sarah Martindale),
gies provide means to design intelligent systems specific to a ward, speciality or task-type; hence, the paper emphasizes the importance of replacing traditional pager-based approaches to management for modern alternatives.
Keywords: Healthcare Management, Multivariate Time Series, Count Data,
Response to reviewers
General Comments: We are grateful to all reviewers for taking the time to review our paper and make a number of helpful comments that we believe have significantly improved the quality of the manuscript. All comments have been, according to their nature, merged, described and addressed here:
5
Comment 1: The major concern shared by reviewers relates to a lack prac-tical relevance of the results presented; for instance, managerial conclusions are not well exploited, the paper lacks a managerial perspective of the output from professionals involved in the study, or results do not extrapolate to different settings neither is it clear why they support the decision making.
10
Response to Comment 1: The authors agree that the previous version of the manuscript offered a mostly descriptive study of the data and lacked relevant interpretations and conclusions drawn from results. In addition, we believe we were not successful in clearly conveying the aims and scope of our work; yet, we have made the efforts to undertake the alterations necessary in order to correct 15
these problems.
Nationwide hospital settings are indeed subject to disparate workload pres-sures; these may drastically vary within distant geographical regions and in relation to specialities covered by each facility. The focus of our research team and this work relates to support systems for effective management that can 20
target local facilities and working groups. This is indeed a great problem, in that policy alterations and intelligent design of support systems (for instance, for rota design) are generally based on nationwide statistics of global admission and consultation counts, which lack the ability to represent the working loads of small wards or facilities. Hence, it is important to provide evidence regarding the 25
additive value of switching from old pager-based management systems to more modern electronic alternatives; being the most relevant one the ability to gain a detailed understanding of workload pressures for further design of data-driven and facility-oriented prioritisation, scheduling and management methods. We have thus made alterations (primarily in introduction and abstract) and added 30
relevant references to emphasize these important matters.
Also, such a long data acquisition can certainly allow for certain generalisa-tion of conclusions. We collaborate with nageneralisa-tionwide institugeneralisa-tions (Royal College of Physicians) and medical consultants who supervised the data acquisition over these years. In this new version of the manuscript, we have scrutinized profes-35
sionals and put a big emphasis on the extent up to which results generalise to different facilities. We have significantly extended discussions of results and we have drawn relevant conclusions not restricted to the study (specially in results and discussion sections).
Comment 2: While technically well explained, there is a lack of
comprehen-40
Response to Comment 2: We thank the reviewer for pointing out the need for better comprehensibility within the model set-up. Following the suggestion, 45
a worked example for the global series of task-demand counts has been included; hence, Section 2 has been altered in order to justify and provide practical exam-ples for design decisions taken. In addition, we have included a summary set of steps for the simulation-based parameter-optimization routine employed; thus describing marginal posterior distributions for all parameters within the model 50
(end of Section 2).
Comment 3: Taking a single modelling approach is problematic. I suggest an extension of the work with related work section, where other approaches in terms of time series modelling are reviewed and one or two most appropriate are compared on the same data.
55
Response to Comment 3: In this new version of the manuscript, we have included a section with references to previous work in modelling series of count data within a medical domain. While literature on time series modelling is ex-tensive and there exist numerous approaches to the matter, in terms of count data series this is usually reduced to observation and parameter driven settings 60
employing Poisson errors; and hence fall within the family of state space mod-els (Gaussian approximations are also common). Thus, we have reflected our thoughts on this matter and resorted to two common alternative methods in or-der to test congruency on results within a predictive setting (see also Comment 4).
65
Comment 4: The data analysis should be extended including a predictive model and correlation analysis among different variables.
Response to Comment 4: Indeed, testing the predictability of future demand is of special relevance as a basis to justify the usefulness and thus importance for the deployment of such data collection methodology within local health-70
care facilities. Also, it can contribute to growing debates discussing the need for data-driven methods for intelligent rota-design. We thank the reviewer for identifying this and we have now included a whole subsection focused on pre-dictability; this includes predictive comparisons over different time-horizons, employing forward-filtering approaches for latent dynamics in the model. Addi-75
tionally, we have established comparisons with observation-driven methodology and standard approaches based in generalized linear models (see also Comment 3). Also, a correlation analysis within model parameters was not included, since all parameter chains within the MCMC routine were fully uncorrelated; yet, we have made a explicit mention to this fact in Section 5.
80
Comment 5: The paper is generally well written and informative. It is statistical in nature, so I am not sure that it falls under a journal devoted to artificial intelligence in medicine. Could the results be used in some type of machine learning or other approach to intelligent scheduling? this would make it more relevant to the journal.
85
dis-cussing the additive value regarding embedded technologies for management support. We note that forecasting of work-demand is the basis to any intelli-gent method aiming to provide support for scheduling, prioritisation or man-agement of care (see also Comment 4). In this regard, the manuscript provides 90
strong evidence concerning the power of such tasking information within local facilities for (i) estimation of future demand (ii) enabling the understanding of workload within speciality specific wards or working groups. Thus, the authors understand that the target audience for this manuscript is the community of researchers with a focus on decision support and expert systems for healthcare; 95
rather than a statistical community with greater interest on methodology and the study of causality relationships in data. We thank the reviewer for bring-ing this to our attention, and we have now made the efforts to emphasize our perspective on the matter within the manuscript.
Final Comments: Finally, we have altered the manuscript in order to include 100
1. Introduction
Secondary healthcare systems around the world are under increasing pressure 105
([1, 2]). Patient admissions are rising ([3]), and the number of available beds is falling ([4]); simultaneously, the complexity of conditions and treatments is increasing ([5]). Hence, healthcare systems must undergo major changes and optimise the use of limited resources.
This situation is especially acute during the out of hours (OoH) setting. 110
For 75% of the working week hospitals are staffed by a skeletal team ([6]), and care must be delivered by a small and often junior group of clinicians over a wide range of medical specialities; frequently in large and complex sites ([7]). Decreasing budgets ([8]), tighter controls of working hours ([9]) and the desire for separation of work and private life ([10, 11]) have lead to a shrinkage of 115
OoH working teams. Hence, in order to deliver safe healthcare of a consistently high quality the provision of this service is frequently revised ([12–14]), often without underlying comprehensive data or understanding of the demand placed on clinical teams.
Extensive research has been concerned with the study of expert and knowledge-120
based systems in healthcare management. This includes logistics, resource scheduling or estimation of service demands, and we refer the reader to [15–17] (and references therein) for some examples of this work. In particular, quantita-tive demand-forecasting studies focused on patient volumes (e.g. [18]) have con-firmed that seasonal patterns and serial correlation structures play important 125
roles in understanding demand loads. Additionally, the study of explanatory covariates in admission volumes has proved helpful in order to identify social pressures on workload (e.g. [19]). However, research restricted to global admis-sion and consultation counts is insufficient in order to inform policy on local staff management; note that different patients receiving unrelated treatments 130
over several medical disciplines put disparate workload pressures on specialist staff groups and grades; moreover, such pressures may vary drastically within distant geographical regions.
Hence, there is a need to employ modern embedded technologies for the design of effective management support systems that can target local facilities 135
and specific working groups ([20]); examples of such work include [21] and [22]. In this paper, we explore the use of electronic task-management for the study of OoH workload in secondary facilities. The purpose is twofold; on one hand, to exhibit the additional value that such tasking data provides in combination with modern machine learning methodology, for supporting intelligent scheduling, 140
prioritisation and management of care delivery. On the other hand, to draw and validate conclusions with managerial relevance not restricted to the time-window and medical facilities covered in this study. We note that task-demand and completion numbers offer a better representation of workload, as opposed to admission or consultation counts; a lack of available sources has precluded 145
previous quantitative studies of this kind.
a useful framework to treat long series of observed multivariate counts, assum-ing independent observations conditionally on the values of a latent process. It 150
allows to not underestimate true serial dependencies and control for discrete-ness and over-dispersion ([23]); moreover, link functions may allow for intuitive interpretations of covariates’ effects (e.g. [24]). Thus, by means of a latent parameter-driven model, we show it is possible to draw inference on contem-porary and serial correlations on demand, over different medical and surgical 155
specialities within a local facility. We also exhibit the ability to quantify future demand pressures, and we compare results with approaches relying on common methodology. Finally, we offer a summary of relevant conclusions as scrutinized by local medical staff, consultants and nation-wide healthcare organizations.
The data collected for this purpose was gathered from two major university 160
hospitals, which combined provide secondary healthcare to over 2.5 million res-idents in the United Kingdom. In both hospitals involved, tasks for the team are requested, assigned and managed via web and mobile device interfaces; and the data is collected at each stage of this process, allowing work-demand to be monitored and analysed. The dataset used for this work contained 652,585 task 165
requests and covers the period from January 2012 to December 2015.
Main results in the paper identify shared characteristics of OoH workload and display a significant split between medical and surgical specialities. Also, strong serial dependencies in demand series and a fast-decreasing predictive power over increasing time-windows emphasize the importance of short-term 170
scheduling and prioritisation. Moreover, results support claims relating to both the importance of data-driven local staffing and work-demand forecasts serving as a basis to intelligent scheduling support. Patient and administrative needs vary significantly according to the day of the week or shift; notably, weekend planning must account for the variation between medical and surgical wards and 175
bank holidays need to be treated as weekends; yet, workforce should (subject to few exceptions) be similar all year-round.
The rest of the paper is organised as follows; in Section 2 we review litera-ture on state-space models with applications in time-series analysis, and explain the model employed in this study. Section 3 offers a discussion on alternative 180
approaches and related work within a medical context. A description and sum-mary of the data is offered in Section 4. In Section 5 we report results in the paper, and finally we offer conclusions and discuss policy recommendations in Section 6.
2. State-space models for multivariate count data 185
State-space models are a class of probabilistic graphical models (see [25]) that have found applications in time-series analysis for supply chain planning [26], text and music analysis ([27]), econometrics ([28]) or political science ([29]), to name a few. In particular, they allow us to describe the dependence between continuous latent state variables and discrete observed counts in terms of some 190
These models are either observation or parameter driven, and can extend generalized linear models by incorporating latent autoregressive processes within the conditional mean function (cf. [24, 30]); thus introducing both auto-regression 195
and over-dispersion. Less common multivariate extensions can handle both con-temporary and serial correlations, and therefore tackle questions not addressed by marginal models (cf. [31, 32]). In general, these models employ dynamic fac-tors or vector auto-regressions at the latent level, and various technical examples of this work can be found in ([28, 31–33]) and references therein.
200
Let yt ∈ Nn
0 denote a vector of task counts as observed at day t; in our
application, this reflects counts overndifferent medical and surgical specialities within the two hospitals. We now formulate a model such thatytis drawn from a family of conditionally-independent Poisson distributions, such that
yt,i|ht,µt∼ P(ht·µt,i), fori∈ {1,· · ·, n}, (1)
and
log(µt) =
X
j
fj(t) +νt, fort∈ {1,· · · , T}.
Here, µt∈ Rn+ denotes a latent rate vector of hourly-tasks, and ht∈ {16,24}
indicates the working hours of the day. Thus, we aim to capture the relation within daily workload and temporal or autoregressive patterns by means of a log-link function. In the following, we discuss the components of the model along with a simplified example for the univariate series of global counts in Figure 1. 205
200 400 600 800 1000
May 12 Nov 12 May 13 Nov 13 May 14 Nov 14 May 15 Nov 15
T
asks
Total number of daily tasks during OOH shifts
Figure 1: Joint time series of task-demand across both hospitals and specialities covered in the study.
2.1. Temporal trends in task-demand
The family{fj(t)∈Rn :j≥1}
t≥0are vector sequences defined to capture
data set, there we notice an approximate 48% increase on demand over a 4 year period. Next,
fj(t) = Kj
X
k=1
βj,k·
cos2πkt
Pj
,sin2πkt
Pj
0
, j ∈ {2,3}
are Fourier terms with periodicitiesP2= 7 andP3= 365. These are frequently
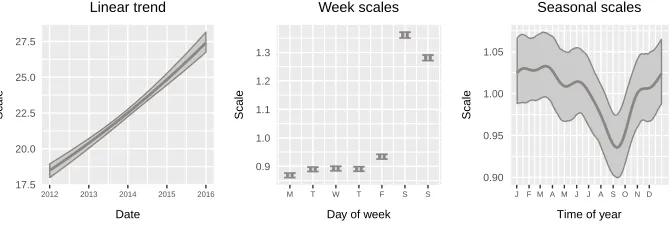
employed (c.f. [28, 33]) in both frequentist and Bayesian settings in order to capture weekly and year-round patterns. It is noticeable in Figure 2 (center) that global OoH demand is highly influenced by the divide within weekday and 210
weekend shifts (mostly explained due to further daylight hours during week-ends); additionally, a mild yet significant decay is observed within the months of August and September (plot on the right).
17.5 20.0 22.5 25.0 27.5
2012 2013 2014 2015 2016
Date
Scale
Linear trend
0.9 1.0 1.1 1.2 1.3
M T W T F S S
Day of week
Scale
Week scales
0.90 0.95 1.00 1.05
J F M A M J J A S O N D
Time of year
Scale
Seasonal scales
Figure 2: Graphical summary of exponentiated scales on global hourly-demand, across both hospitals and specialities covered in the study. Credible intervals shown at a 95% level.
Also,f4(t) includesncoefficientsβ4 allowing to further scale demand
dur-ing Bank Holidays. In our worked example, this is a sdur-ingle parameter and its exponential has mean value 1.44. We finally note that
β={βj ; j∈ {1,· · ·,4}} (2)
accounts forn×(3 + 2(K2+K3)) regression parameters.
2.2. Autoregressive trends in task-demand
215
In addition to seasonal trends, {νt ∈ Rn : t ≥ 1} defines a sequence of
latent effects accommodating possible contemporaneous and serial dependencies in counts, within a parameter driven framework. This is such that
νt∼ N(diag(δ)·νt−1,Σ), fort≥2, (3)
and ν1 ∼ N(0,Σ). Thus, it defines a vector auto-regression with a basic
to guarantee stationarity we impose|δi|<1 for alli∈ {1,· · · , n}, and note that matrix Θ with
Θi,j= Σi,j/(1−δiδj) fori, j∈ {1,· · ·, n}. (4)
denotes the stationary covariance matrix in (3). In Figure 3, we observe the sequence of latent effects for global demand during 2012; note that in the uni-variate case, the above formulation reduces to an AR(1) model with no constant, single parameter and white noise. In the figure, we notice positive autoregressive dynamics; its factor has mean 0.79 with a 95% credible interval of (0.74,0.83). 220
0.8 0.9 1.0 1.1 1.2
Jan 2012 Apr 2012 Jul 2012 Oct 2012 Dec 2012
Scale
Latent effects
Figure 3: Series of latent effects in global hourly task-demand during 2012.
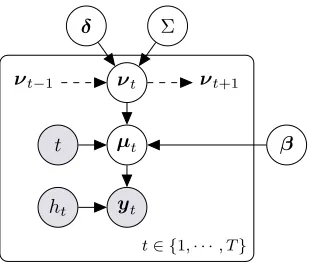
2.3. Graphical model, moments and parameter estimation
A graphical representation of the model in template notation is offered in Figure 4; in the case whereδ=0, the above formulation reduces to a variation of the model for correlated count data presented in [34]. Under this setting, it can be readily verified that
ˆ
yt:=E[yt|ht,f,δ,Σ] =ht·exp
1
2· ˜ Θ +
4
X
j=1
fj(t)
,
and
Cov yt|ht,f,δ,Σ
= (ˆyt·yˆ0t)◦(eΘ−1) + diag(ˆyt),
for allt ∈ {1,· · · , T}, where ˜Θ stands for the entries in the main diagonal of Θ and◦denotes the Hadamard product. Thus, main moments can be approx-imated according to laws of iterated expectation, with samples from the full posterior distribution of autoregressive parameters, the covariance structure, and sequences
µt
yt ht
t β
νt
νt−1 νt+1
δ Σ
t∈ {1,· · ·, T}
Figure 4: Graphical representation of the relation within counts and the latent structure in the model.
which we recall are multiplicative scaling factors forµin (1).
In this work, the focus is given to (i) the study of distributional properties of model components, in order to unveil workload patterns during OoH shifts, and (ii) the assessment of the ability to quantify future task-demand, for providing 225
support within intelligent management design. We note that analytical infer-ence is intractable due to non-conjugacy between the exponential family and the normal latent process; thus, we resort to stochastic simulation and learning on latent states and parameters {β,δ,Σ} is carried out through Markov Chain Monte Carlo, employing Metropolis-Hastings (M-H) updates within blocked 230
Gibbs steps. Starting values can be extracted ignoring the latent dynamic structure, and using standard optimization routines for classic likelihood-based estimation methods. Also, parameter priors forβandδin (2)-(3) are assumed uninformative, and a Wishart prior distribution is used for the precision matrix Σ−1in (3). In summary,
235
a) Latent vector dynamics inνtare updated by M-H, with target density
π(νt|ν\t,f,δ,Σ)∝ n
Y
i=1
expyt,iνt,i−htexp X
j
fj,i(t) +νt,i
·exp −1
2(νt−µ) 0Ω−1(ν
t−µ)
,
for allt∈ {2,· · ·, T −1}; casest∈ {1, T}are straightforward. Here,
Ω =Σ−1+d(δ)Σ−1d(δ)−1, µ= ΩΣ−1d(δ)νt−1+d(δ)Σ−1νt+1
.
b) Parameters in β can be updated by M-H, with nindependent blocks of medical speciality-specific regressors, each with target density
π(β·,i|ν)∝ T
Y
t=1
expyt,iX j
fj,i(t)−htexp X
j
for alli∈ {1,· · ·, n}
c) The precision matrix Σ−1 is sampled from a Wishart distribution, such
that
Σ−1|ν,δ∼ Wn(m, V),
withm=m0+T degrees of freedom, and scale matrix
V = V0−1+ν1ν01+ T−1
X
t=1
(νt+1−d(δ)·νt)(νt+1−d(δ)·νt)0
−1
.
Here, m0 and V0 are the prior degrees of freedom and scale matrix for
Σ−1, respectively.
d) Finally, the vector of marginal autoregressive termsδis truncated normal, and may be updated so that
δ|ν,Σ∼I(−1,1)· N(µ,Ω),
where,
Ω =h
T
X
t=2
d(νt−1)Σ−1d(νt−1)
i−1
, µ= Ω·
T
X
t=2
d(νt−1)Σ−1νt.
In this paper, we omit cumbersome details regarding proposal distributions in M-H steps, and we resort to the general purpose JAGS sampler ([35]) for 240
simplicity.
3. Related work
Time series of count data are common in studies with diverse medical ap-plications (for instance, see [36, 37] and references therein); hence, Bayesian modelling of such series has been a subject of previous research. Common 245
scalable approaches generally ignore either serial or contemporaneous correla-tion structures within data; and include standard log-linear models, Gaussian autoregressive approximations and observation-driven state space models. In this work, we will employ univariate Poisson regressions and observation-driven Poisson autoregressive models as a basis for drawing predictive comparisons 250
and discussing congruency in results within Section 5. For references describing these methods, we refer the reader to [24, 33] or [37].
In summary, Poisson or log-linear regression models allow to model seri-ally uncorrelated count data and will thus permit drawing comparisons with predictive results over large horizons. On the other hand, observation-driven 255
specifications for Poisson autoregressive models offer straightforward and effi-cient ways to draw inference over short-horizons ([24, 38]). These benefit from easy to calculate likelihoods; however, stationarity and ergodicity properties are hard to derive, and they most importantly suffer from a lack of interpretability on covariates when compared to the parameter-driven alternative discussed in 260
4. Data
The recently deployed electronic task-management system discussed in this paper allows a senior nurse coordinator to triage requests for clinical review and intervention over a team of doctors and clinical support workers; all within 265
theHospital at Night secondary-care setting in the UK. We note that different organizational models are used for providing OoH care internationally ([39]), and we refer the reader to [40, 41] for information on the setting and research in relation to the source of our data.
In brief, sourced data includes task requests outside the 9:00-17:00 Monday 270
to Friday in hours setting, and incorporates all hours during Bank Holidays. Data belongs to two jointly coordinated hospitals used within the study; there-fore, we have complementary sets offering precise information on the OoH sec-ondary healthcare demand within a geographical region with over 2.5 million residents. Table 1 offers a summary on capacity, total workload and average 275
staff on both sites. In this data set, we observe over 40 different kinds of task requests; most common observations include cannulations, drug prescriptions, clinical reviews and management orblood results interpretations, each account-ing for over 10% of total demand. Also, we notice reasonable amounts of work-load in relation tofluids prescriptions, clerking, X-ray requests/reviews or blood
280
test requests.
Average staff in shift(Equivalent in both sites)
Senior doctors
Junior doctors
CSW Nurse
coord.
5pm (9am) - 10pm 1 6 1 1
10pm - 9am 1 4 1 1
Bed capacity
Overall tasks in site
2012 2013 2014 2015
Hospital 1 1300 57869 76461 78349 78320
Hospital 2 1100 78353 81862 96229 105142
Table 1: OoH staff levels, capacity and overall workload in both Hospitals; note that day shifts during Weekends begin at 9am.
We find a total of 652,585 entries ranging from January 2012 to December 2015, and with each of them we obtain attached information including request and completion times, associated ward and medical or surgical speciality, ur-gency level and assigned staff group. This constitutes a very detailed and com-285
in counts; this is due to varying numbers of working hours during different days 290
of the week.
Min Median Max Mean & SD
Cardiology 1 17 58 19.29 (9.26)
Clinical haematology 4 18 59 18.44 (6.61)
Clinical oncology 5 23 79 25.94 (11.86)
Diabetes 5 22 102 30.94 (20.91)
General surgery 15 66 213 80.36 (38.37)
Care for the older people 10 37 170 54.72 (37.07)
Nephrology and transplants 4 19 72 21.27 (9.76)
Plastic surgery 0 9 36 10.14 (5.54)
Respiratory medicine 14 40 134 50.9 (26.21)
Rheumatology 0 10 68 14.26 (11.34)
Stroke assessment 4 25 85 28.97 (14.6)
Trauma and orthopaedic 1 21 71 23.71 (12.09)
Urology 0 9 42 10.03 (5.71)
Vascular surgery 0 11 57 12.44 (8.25)
Table 2: Summary of daily counts in different disciplines, for January 2012 to December 2015. Within parentheses we find standard deviation values.
5. Results
Results summarized in this work are obtained from a multivariate sample of 80,000 draws; 20,000 from each of the 4 independent chains run in parallel, all with a 100,000 burn-in phase and showing no significant pairwise correlation 295
within parameters. In this case, K2 = 3 and K3 = 5, and starting values are identical across chains; however, different seeds are used within parallel streams of generated random numbers (for details, see [42]). For predictive purposes, the various models are fitted to data from 2012 to 2014, and results are reported for out-of-sample data.
300
In the following, we display results that expose the additive value of such electronic tasking information within the local facilities targeted in this study, for the purposes of understanding staff behaviour and managing the delivery of care. Additionally, we summarize conclusions that generalize in time and context, as surveyed among medical consultants across nation-wide healthcare 305
institutions.
5.1. Periodic patterns, speciality split and bank holiday effect
Cardiology Clinical haematology Clinical oncology Diabetes General surgery
HCOP Nephrology/transplant Plastic surgery Respiratory medicine Rheumatology
Stroke assessment Trauma & orthopaedic Urology Vascular surgery 1.0
1.5 2.0
1.0 1.5 2.0
1.0 1.5 2.0
M T W T F S S M T W T F S S M T W T F S S M T W T F S S
Day of the week
Scales
Week scales on task demand rates
Figure 5: Credible intervals on weekly task-demand scaling factors accross different specialties.
There, we observe varying levels of significant departures from average demand in most specialities, specially over weekends.
An increase in OoH workload outside business days is mostly triggered by higher proportions of daylight hours; along with sets of leftover duties and routine care or ward round needs usually performed within thein hourssetting 315
during working days. Also, the rise in demand is generally more significant on Saturdays; partly, doctors on weekend shifts become familiar with patients and determine needs for treatment alterations during this day; also, Sunday duties may be left for day teams. In general, results sustain claims suggesting that (i) staff behaviour varies according to different shifts/weekdays and (ii) workload 320
is proportionally larger during daylight shifts (see [43] for a related discussion) However, the variation within business days and weekends is highly depen-dent on speciality; in this regard, we notice a first split within medical and surgical disciplines. In our study, certain specialities such as haematology or nephrology have external consultants performing ward rounds of their inpa-325
more elective (cf. [44, 45]), and thus allow for better planning; this explains 330
most lack of variation within weekly workload. Extensive research (see [46, 47] and references therein) has raised global concerns regarding a lack of sufficient staff during OoH shifts over weekends; for instance, mortality rates are known to be proportionally higher. In view of this case study, we notice the ability of electronic tasking-data in order to quantify ward and facility specific needs; 335
also, it is arguable that global weekend staffing should be discipline dependent. In Figure 6 we observe 90% credible intervals for bank holiday scaling fac-tors, these are further applied when estimating task-demand during holidays. The similarity between weekend and bank holiday effects is noticeable and not characteristic to this case study (cf. [48]); hence, similar considerations should 340
be made when prioritizing demand and designing rotas.
Cardiology Clinical haematology Clinical oncology Diabetes General surgery HCOP Nephrology/transplant Plastic surgery Respiratory medicine Rheumatology Stroke assessment Trauma & orthopaedic Urology Vascular surgery
1.0 1.5 2.0 2.5
Scale factor
Bank holiday scale
Figure 6: Credible intervals on Bank Holiday task-demand scaling factors accross different specialties
Next, we observe %90 credible intervals for year-round patterns of OoH task-demand in Figure 7. There, we again notice diverse levels of vulnerability to seasonality across specialities. The impact is of a lesser relevance to that in weekly scales; with exceptions such asnephrology, susceptible to suffer signifi-345
cant decreases in workload over summer-time, yet uniformly spread over both working and weekend days. There also exist predictable drops in summer work-load within specialities where treatment is susceptible to being deferred by pa-tients, such ashealth care for the older peopleordiabetes; and significant spikes are observed in categories where workload is vulnerable to admission levels or 350
Cardiology Clinical haematology Clinical oncology Diabetes General surgery
HCOP Nephrology/transplant Plastic surgery Respiratory medicine Rheumatology
Stroke assessment Trauma & orthopaedic Urology Vascular surgery 0.7
0.9 1.1 1.3
0.7 0.9 1.1 1.3
0.7 0.9 1.1 1.3
J F M A M J J A S O N D J F M A M J J A S O N D J F M A M J J A S O N D J F M A M J J A S O N D
Time of the year
Scales
Seasonal scales on task demand rates
Figure 7: Credible intervals on year-round task-demand scaling factors accross different spe-cialties.
efficient scheduling; hence, it is likely to cause workload alterations aiming to balance year-round stress within the system. Table 3 offers an overview of mean absolute deviations in seasonality scales, around a central tendency of 1. These statistics allow for direct comparison within disciplines, and manifest the afore-mentioned variability split within specialities, with the noticeable exception of 360
general surgery.
Finally, we note that seasonal effects on demand are likely to depend on the geographical location of each medical facilitiy; thus, studying localized solutions for demand estimation is of special relevance with aims to design intelligent rota schedules. Thus, we again notice that electronic tasking provides the means for 365
personalizing the study of workload patterns to meet medical facility or ward needs.
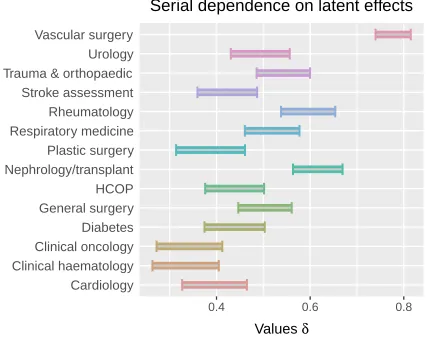
5.2. Serial dependencies and uncorrelated disciplines
In addition to periodic patterns, we analyse results on temporal and contem-poraneous relations within task-demand counts. Figure 8 shows %90 credible 370
Year deviation Week deviation
Cardiology 0.054 (0.011) 0.11 (0.009)
Clinical haematology 0.044 (0.009) 0.09 (0.008)
Clinical oncology 0.055 (0.008) 0.12 (0.009)
Diabetes 0.046 (0.010) 0.34 (0.009)
General surgery 0.036 (0.008) 0.17 (0.006)
Care for the older people 0.056 (0.009) 0.36 (0.008)
Nephrology and transplants 0.088 (0.017) 0.06 (0.009)
Plastic surgery 0.063 (0.013) 0.08 (0.011)
Respiratory medicine 0.046 (0.009) 0.21 (0.007)
Rheumatology 0.079 (0.015) 0.38 (0.014)
Stroke assessment 0.067 (0.011) 0.15 (0.009)
Trauma and orthopaedic 0.084 (0.014) 0.12 (0.009)
Urology 0.082 (0.017) 0.06 (0.011)
Vascular surgery 0.117 (0.025) 0.09 (0.012)
Table 3: Mean absolute deviations in seasonalities. Standard deviations in parentheses are obtained across samples.
Cardiology Clinical haematology Clinical oncology Diabetes General surgery HCOP Nephrology/transplant Plastic surgery Respiratory medicine Rheumatology Stroke assessment Trauma & orthopaedic Urology Vascular surgery
0.4 0.6 0.8
Values δ
Serial dependence on latent effects
Figure 8: %90 Credible intervals for autoregressive parameters in vectorδ.
Such relation in marginal counts reflects the existence of temporally persis-tent departures from general trends of expected workload; and emphasizes the 375
importance of short-term planning. Departures may reflect several things; on one hand, the presence of traditional epidemics and associated workload in a medical context, on the other hand, the impact that in hours staffing policy changes exercises on OoH workload. Note that an increase on team sizes during in hours shifts will likely cause a significant decrease in subsequent workload 380
The inclusion of such autoregressive effects in the model allows to capture these phenomena, hence reducing the bias on inferred seasonality patterns of demand over different categories. Yet, we notice that high serial dependencies observed in Figure 8 may lead to wide intervals of confidence on seasonal patterns; such 385
as invascular surgery as seen in Figure 7.
Also, Table 4 offers an overview of the latent stationary correlation ma-trix obtained from (4). We observe a rather homogeneous structure of mostly unrelated pairs across all disciplines, with few exceptions showing very weak contemporaneous dependencies in workload. This suggest it is possible to em-390
ploy scalable independent forecasts over different disciplines within the studied hospital facilities; yet, we note these relations may not be necessarily meaningful in the general context of OoH work, but rather respond to work management characteristics within the sites and team analysed in this study. However, gen-eral daily counts of task-demand are highly correlated across disciplines; in view 395
of these results, we conclude this is solely due to similarities on seasonal effects across groups of categories.
ClHae ClOnc Diabe GeSur HCOP Nephr PlSur ReMed Rheum StAss Traum Urolo VaSur
Cardi 0.059 -0.013 0.035 0.038 0.049 0.033 0.047 -0.002 0.000 0.003 0.031 0.066 0.011
(0.038) (0.038) (0.038) (0.036) (0.037) (0.038) (0.041) (0.037) (0.040) (0.039) (0.037) (0.041) (0.035)
ClHae 0.068 0.016 0.001 0.033 0.055 -0.024 0.013 0.017 0.028 -0.006 0.008 -0.027
(0.039) (0.037) (0.034) (0.036) (0.037) (0.041) (0.035) (0.038) (0.038) (0.036) (0.041) (0.032)
ClOnc -0.009 -0.009 -0.036 0.013 0.038 -0.020 0.007 0.010 0.001 -0.053 -0.004
(0.037) (0.034) (0.036) (0.035) (0.040) (0.035) (0.036) (0.037) (0.036) (0.040) (0.032)
Diabe 0.065 0.066 -0.026 -0.067 0.083 0.081 0.014 0.019 -0.001 0.068
(0.034) (0.036) (0.037) (0.039) (0.035) (0.037) (0.037) (0.038) (0.040) (0.035)
GeSur 0.080 -0.029 -0.053 0.042 0.071 -0.034 0.083 0.003 0.095
(0.033) (0.035) (0.036) (0.034) (0.035) (0.034) (0.034) (0.036) (0.033)
HCOP 0.033 -0.014 0.009 0.058 -0.001 0.043 0.022 0.021
(0.036) (0.039) (0.035) (0.036) (0.035) (0.035) (0.037) (0.033)
Nephr 0.075 -0.048 -0.034 0.009 0.028 0.094 -0.030
(0.040) (0.037) (0.038) (0.038) (0.037) (0.039) (0.039)
PlSur -0.036 -0.056 0.002 0.005 0.204 -0.055
(0.037) (0.042) (0.040) (0.040) (0.041) (0.038)
ReMed 0.020 0.016 -0.046 -0.041 0.061
(0.037) (0.036) (0.035) (0.038) (0.035)
Rheum 0.023 0.032 0.003 -0.005
(0.039) (0.041) (0.042) (0.038)
StAss -0.001 0.017 -0.035
(0.036) (0.040) (0.033)
Traum 0.011 -0.027
(0.040) (0.037)
Urolo -0.060
(0.036)
Table 4: Latent stationary correlation structure obtained from (4). Standard deviations shown within parentheses are computed across samples. Significant correlations at a 5% confidence level are shown in bold numbers.
5.3. Predictability of local demand and scheduling horizons
example be found in [50–52] and references therein. In this contribution, we discuss the ability of tasking data and forecasting methods for supporting local and ward level scheduling, prioritisation and management of care delivery.
Under the present framework, we note that it is possible to draw inference on expected work-demand across varied time-horizons. For that matter, either 405
deterministic integration or simulation based forward filtering-procedures may be employed (cf. [26, 28]); thus tracking the evolution of latent dynamics ν in (3). In both top plots in Figure 9 we observe the evolution of task-demand for disciplines general surgery and rheumatology; there, green bars represent out-of-sample demand during the beginning of year 2015. Additionally, super-410
imposed gray lines represent point estimates for expected demand as inferred from the model in Section 2; predictions over out-of-sample demand correspond to estimates obtained right at the end of 2014. Finally, orange lines represent 1-day ahead predictions obtained from dynamically updating the distribution of the latent processν, and represent work-demand predictions over the shortest 415
possible horizon.
General surgery Rheumatology
0 50 100 150 200
2014−11−01 2014−12−01 2014−12−31 2015−01−30 2014−11−01 2014−12−01 2014−12−31 2015−01−30
Time of the year
Demand
Observed and expected task demand. Late 2014 / Early 2015
General surgery Rheumatology
0 50 100 150 200
2014−11−01 2014−12−01 2014−12−31 2015−01−30 2014−11−01 2014−12−01 2014−12−31 2015−01−30
Time of the year
Demand
Observed and expected task demand. Late 2014 / Early 2015
Figure 9: Subset of the evolution of task-demand within disciplines general surgery and
On the other hand, the two bottom plots in Figure 9 present the same evo-lution of task-demand; yet, superimposed lines offer estimates of task-demand obtained from (i) a Poisson regression model (gray lines) and (ii) an observation-driven Poisson AR(1) model (orange lines, 1-day ahead predictions). Further-420
more, Table 5 offers varied measures of predictive accuracy for different fits within the full year 2015 and across all specialities in the study; these include cor-relation coefficients within estimations and observations, root relative squared errors and relative absolute errors. In order to compute error terms, demand observations and predictions are standardised across medical and surgical cate-425
gories, thus removing the effect of severe variations in global trends of demand over different specialities.
Cor. coef. rRSE RAE
1 day ahead 0.7409 71.98% 64.76%
2 days ahead 0.7113 75.98% 67.90%
Since end of 2014 0.6932 78.33% 69.97%
Obs-driven AR(1), 1 day ahead 0.7341 72.92% 65.52%
Univ. Poisson regression 0.6837 79.53% 71.43%
Table 5: Measures of predictive accuracy for various fits in out-of-sample data.
We notice the ability of tasking information in order to produce reasonable estimates on future demand; most importantly, we recall that the granular-ity of such information does not only allow to draw facilgranular-ity-level inference on 430
expected demand, but can also marginalise over sets of specific tasks within precise wards covering particular specialities. In addition, estimates are consis-tent across models employed and predictive horizons; nevertheless, strong serial dependencies previously observed in Figure 8 force a fast-decreasing predictive power over increasing horizons; again, emphasizing the relevance of short-term 435
scheduling and redesigning of staffing levels. Finally, Figure 10 shows 95% cred-ible intervals on the evolution of dynamicsν in (3) across general surgery and rheumatology, and provides additional evidence regarding the loss of informa-tion caused by forecasting over large horizons. There, gray intervals represent the MCMC output accounting for data up to the end of year 2014; on the other 440
hand, orange intervals offer 1-day ahead filtered values accounting for data up to the day before each estimate is drawn.
6. Discussion
The work in this paper has explored the use of electronic task-management alternatives in combination with modern statistical and machine learning method-445
General surgery Rheumatology
−1.0 −0.5 0.0 0.5 1.0
2014−11−01 2014−12−01 2014−12−31 2015−01−30 2014−11−01 2014−12−01 2014−12−31 2015−01−30
Time of the year
Latent eff
ects
Condifence intervals for in & out of sample latent variable processes
Figure 10: Credible intervals on the evolution of processνforgeneral surgeryand rheumatol-ogy. Orange intervals represent 1-day ahead filtered processes; gray intervals provide MCMC output with data up to 2014.
4-year time-window; and has drawn conclusions contributing to open debates 450
discussing needs for intelligent data-driven rotas, speciality-specific staffing vari-ations and the extent of workload disparity within different shifts or working days.
Major contributions in the paper have exhibited the capacity of such task-ing data, for providtask-ing means to support intelligent data-driven methods for 455
scheduling, prioritisation and management of care delivery. Replacing tradi-tional pager-oriented methods for digital alternatives based on web and mobile interfaces provides means to collect information on workload that has the power of being specific to each ward, speciality, working group or task-type. Also, quantifying demand variability over local facilities may allow for the study of 460
suspected relations with cyclic patterns of staff sickness, norovirus effects on wards, lack of social beds and traditional winter pressures ([53, 54]).
Additionally, scrutinized results in this work have validated several conclu-sions with practical relevance not restricted to the facilities in the study. In summary,
465
• Levels of predictable variation in workload and with disparate characteris-tics within medical and surgical disciplines suggest such split should serve as a basis for weekend rota scheduling.
• Year-round staffing levels should be unaltered. In this regard, imbalances are either mild or statistically not significant, subject to few exceptions. 470
• Sharp variation within weekday, weekend and bank holiday demand poses a clear argument regarding patients and staff behaving differently accord-ing to the day or shift. Also, bank holidays need to be treated as weekends.
• The existence of significant serial relations in task-demand yield fast-decreasing predictive powers over growing horizons; this emphasizes the 475
Finally, a technical limitation in the present modelling approach relates to the latent vector auto-regression structure, which could increase in complexity in order to accommodate a higher order or incorporate serial cross-dependencies within categories, yet increasing the computational requirements in such a high-480
dimensional problem. Also, it would be possible to further relax the restriction on the dispersion of counts using a negative binomial distribution (cf. [28]); or attempt to model contemporaneous correlations employing copulas ([31]). Ad-ditionally, while we have informed on the impact of seasonality, in order to draw inference on triggering factors (such as admission numbers or care complexity) 485
hospital occupancy information is required.
In conclusion, the work presents a valuable working framework for the study of workload within secondary healthcare institutions during Out of Hours. For this matter, the paper resorts to tasking information from an electronic man-agement system, and results contribute to the quantitative study of care frag-490
mentation, scheduling and team management in healthcare (cf. [17–19]).
Acknowledgements
We would like to thank the Royal College of Physicians and all the medical and administrative staff; visitors and patients; medical students, junior doctors and hospital volunteers that took part in the various studies.
495
This work was supported by The Health Foundation through the Insight 2014 project “Informatics to identify and inform best practice in out of hours secondary care” (7382) and RCUK thought the Horizon Digital Economy Re-search grants (EP/G065802/1, EP/M000877/1).
References 500
[1] C. Roehrig, A. Turner, P. Hughes-Cromwick, G. Miller, When the cost curve bent, pre-recession moderation in health care spending, New England Journal of Medicine 367 (2012) 590–593.
[2] C. Keegan, S. Thomas, C. Normand, C. Portela, Measuring recession sever-ity and its impact on healthcare expenditure, International journal of health 505
care finance and economics 13 (2013) 139–155.
[3] Royal College of Physicians, Hospitals on the edge: the time for action?, RCP London, 2012.
[4] C. Ham, C. Imison, N. Goodwin, A. Dixon, P. South, Where next for the nhs reforms? the case for integrated care, The King’s Fund (2011). 510
[6] M. Brown, P. Syrysko, S. Sharples, D. Shaw, I. Le Jeune, E. Fioratou, et al., Developing a simulator to help junior doctors deal with night shifts, Con-515
temporary Ergonomics and Human Factors. M. Anderson, Ed. Abingdon: Taylor and Francis (2013) 289–296.
[7] M. Brown, D. Shaw, S. Sharples, I. Le Jeune, J. Blakey, A survey-based cross-sectional study of doctors expectations and experiences of non-technical skills for out of hours work, BMJ open 5 (2015) e006102. 520
[8] A. Reeves, M. McKee, S. Basu, D. Stuckler, The political economy of austerity and healthcare: Cross-national analysis of expenditure changes in 27 european nations 1995–2011, Health Policy 115 (2014) 1–8.
[9] R. T. Clarke, A. Pitcher, T. W. Lambert, M. J. Goldacre, UK doctors views on the implementation of the european working time directive as applied 525
to medical practice: a qualitative analysis, BMJ open 4 (2014) e004390.
[10] L. Hallam, Primary medical care outside normal working hours: review of published work, BMJ 308 (1994) 249–253.
[11] C. Salisbury, Evaluation of a general practice out of hours cooperative: a questionnaire survey of general practitioners, BMJ 314 (1997) 1598. 530
[12] M. B. Christensen, F. Olesen, Out of hours service in denmark: evaluation five years after reform, BMJ 316 (1998) 1502.
[13] C. V. Uden, P. H. Giesen, J. F. Metsemakers, R. P. Grol, Development of out-of-hours primary care by general practitioners (gps) in the netherlands: from small-call rotations to large-scale gp cooperatives., Family Medicine 535
8 (2006) 565–9.
[14] R. Grol, P. Giesen, C. V. Uden, After-hours care in the united kingdom, denmark, and the netherlands: new models, Health Affairs 25 (2006) 1733– 1737.
[15] A. ˇCufar, A. Mrhar, M. Robnik-ˇSikonja, Assessment of surveys for the 540
management of hospital clinical pharmacy services, Artificial intelligence in medicine 64 (2015) 147–158.
[16] N. B. Peek, Explicit temporal models for decision–theoretic planning of clinical management, Artificial Intelligence in Medicine 15 (1999) 135–154.
[17] A. Rais, A. Viana, Operations research in healthcare: a survey, Interna-545
tional transactions in operational research 18 (2011) 1–31.
[19] Y. Ben-Shlomo, I. White, P. M. McKeigue, Prediction of general practice 550
workload from census based social deprivation scores., Journal of epidemi-ology and community health 46 (1992) 532–536.
[20] S. Sharples, M. Brown, J. Pinchin, J. Blum, A. Nagiyev, B. Ryan, et al., Ubiquitous technologies for capture of real-world performance, in: Pro-ceedings 19th Triennial Congress of the IEA, Editors G. Lindgaard & D. 555
Moore, International Ergonomics Association, volume 9, 2015, p. 14.
[21] C. Larkin, R. Valand, P. Syrysko, R. Harris, D. Shaw, M. Brown, et al., ’night shift’: A task simulation to improve on-call prioritisation, self-management, communication, and route planning skills, in: Interactive Technologies and Games (iTAG), 2014 International Conference on, IEEE, 560
2014, pp. 59–62.
[22] I. Perez, J. Pinchin, M. Brown, J. Blum, S. Sharples, Unsupervised labelling of sequential data for location identification in indoor environments, Expert Systems with Applications 61 (2016) 386 – 393.
[23] R. A. Davis, W. Dunsmuir, Y. Wang, Modeling time series of count data, 565
Statistics Textbooks & Monographs 158 (1999) 63–114.
[24] R. C. Jung, M. Kukuk, R. Liesenfeld, Time series of count data: modeling, estimation and diagnostics, Computational Statistics & Data Analysis 51 (2006) 2350–2364.
[25] D. Koller, N. Friedman, Probabilistic graphical models: principles and tech-570
niques, MIT press, 2009.
[26] N. Chapados, Effective bayesian modeling of groups of related count time series, Proceedings of the 31st International Conference on Machine Learn-ing, Ed. N. Lawrence, Journal of Machine Learning Research: W&CP, Mi-crotome Publishing (2014).
575
[27] A. Acharya, J. Ghosh, M. Zhou, Nonparametric bayesian factor analysis for dynamic count matrices, Proceedings of the 18th International Confer-ence on Artificial IntelligConfer-ence and Statistics, Ed. N. LawrConfer-ence, Journal of Machine Learning Research: W&CP, Microtome Publishing (2015).
[28] R. C. Jung, R. Liesenfeld, J.-F. Richard, Dynamic factor models for multi-580
variate count data: An application to stock-market trading activity, Jour-nal of Business & Economic Statistics 29 (2011) 73–85.
[29] P. T. Brandt, T. Sandler, A bayesian poisson vector autoregression model, Political Analysis 20 (2012) 292–315.
[30] S. L. Zeger, A regression model for time series of counts, Biometrika 75 585
[31] A. Heinen, E. Rengifo, Multivariate autoregressive modeling of time series count data using copulas, Journal of Empirical Finance 14 (2007) 564–583.
[32] B. Jørgensen, S. Lundbye-Christensen, P.-K. Song, L. Sun, A state space model for multivariate longitudinal count data, Biometrika 86 (1999) 169– 590
181.
[33] L. Held, M. H¨ohle, M. Hofmann, A statistical framework for the analysis of multivariate infectious disease surveillance counts, Statistical modelling 5 (2005) 187–199.
[34] S. Chib, R. Winkelmann, Markov chain monte carlo analysis of correlated 595
count data, Journal of Business & Economic Statistics 19 (2001) 428–435.
[35] M. Plummer, Jags: A program for analysis of bayesian graphical models using gibbs sampling, in: Proceedings of the 3rd International Workshop on Distributed Statistical Computing, Editors K. Hornik, F. Leisch & A. Zeileis, Technische Universitt Wien, Vienna, volume 124, 2003, p. 125. 600
[36] K. Bhaskaran, A. Gasparrini, S. Hajat, L. Smeeth, B. Armstrong, Time se-ries regression studies in environmental epidemiology, International journal of epidemiology (2013) dyt092.
[37] J. Schwartz, C. Spix, G. Touloumi, L. Bach´arov´a, T. Barumamdzadeh, et al., Methodological issues in studies of air pollution and daily counts 605
of deaths or hospital admissions., Journal of epidemiology and community health 50 (1996) S3–11.
[38] J. Durbin, S. J. Koopman, Time series analysis of non-gaussian observa-tions based on state space models from both classical and bayesian per-spectives, Journal of the Royal Statistical Society: Series B (Statistical 610
Methodology) 62 (2000) 3–56.
[39] L. Huibers, P. Giesen, M. Wensing, R. Grol, Out-of-hours care in west-ern countries: assessment of different organizational models, BMC health services research 9 (2009) 1.
[40] D. Beckett, C. Gordon, R. Paterson, S. Chalkley, C. Stewart, M. C. Jones, 615
M. Young, D. Bell, Improvement in out-of-hours outcomes following the implementation of hospital at night, QJM 102 (2009) 539–546.
[41] J. D. Blakey, D. Guy, C. Simpson, A. Fearn, S. Cannaby, P. Wilson, D. Shaw, Multimodal observational assessment of quality and productivity benefits from the implementation of wireless technology for out of hours 620
working, BMJ open 2 (2012) e000701.
[43] H. Fukuda, M. Takahashi, H. Airto, Nurses workload associated with 16-h 625
night shifts on the 2-shift system. i: Comparison with the 3-shift system, Psychiatry and Clinical Neurosciences 53 (1999).
[44] W. B. Robb, M. J. O’Sullivan, A. E. Brannigan, D. J. Bouchier-Hayes, Are elective surgical operations cancelled due to increasing medical admissions?, Irish Journal of Medical Science 173 (2004) 129–132.
630
[45] F. Dexter, L. ONeill, Data envelopment analysis to determine by how much hospitals can increase elective inpatient surgical workload for each specialty, Anesthesia & Analgesia 99 (2004) 1492–1500.
[46] R. Barba, J. Losa, M. Velasco, C. Guijarro, G. G. de Casasola, A. Zapa-tero, Mortality among adult patients admitted to the hospital on weekends, 635
European Journal of Internal Medicine 17 (2006) 322 – 324.
[47] L. Schmulewitz, A. Proudfoot, D. Bell, The impact of weekends on outcome for emergency patients, Clinical Medicine 5 (2005) 621–625.
[48] R. S. Kovats, S. Hajat, P. Wilkinson, Contrasting patterns of mortality and hospital admissions during hot weather and heat waves in greater london, 640
uk, Occupational and environmental medicine 61 (2004) 893–898.
[49] A. J. Elliot, K. W. Cross, D. M. Fleming, Acute respiratory infections and winter pressures on hospital admissions in england and wales 1990–2005, Journal of public health 30 (2008) 91–98.
[50] L. H. Aiken, S. P. Clarke, D. M. Sloane, Hospital staffing, organization, 645
and quality of care: Cross-national findings, Nursing Outlook 50 (2002) 187 – 194.
[51] C. Kovner, C. Jones, C. Zhan, P. J. Gergen, J. Basu, Nurse staffing and postsurgical adverse events: An analysis of administrative data from a sample of u.s. hospitals, 19901996, Health Services Research 37 (2002) 650
611–629.
[52] C. Kovner, P. J. Gergen, Nurse staffing levels and adverse events following surgery in u.s. hospitals, Image: the Journal of Nursing Scholarship 30 (1998) 315–321.
[53] K. Fullerton, V. Crawford, The winter bed crisisquantifying seasonal effects 655
on hospital bed usage, Qjm 92 (1999) 199–206.